. 2025 Jun;133(6):67008.
doi: 10.1289/EHP14458. Epub 2025 Jun 11.

The Association between Multiple Environmental Exposures and Symptoms of Generalized Anxiety Disorder in a Prospective, US-Based Cohort Study

Affiliations

The Association between Multiple Environmental Exposures and Symptoms of Generalized Anxiety Disorder in a Prospective, US-Based Cohort Study

Unnati V Mehta et al. Environ Health Perspect. 2025 Jun.

Abstract

Background: Emerging evidence has implicated built and natural environmental exposures in the etiology and exacerbation of anxiety symptoms.

Objectives: Our objective was to assess individual and joint associations between neighborhood socioeconomic status (nSES), walkability, greenness, fine particulate matter (PM2.5), nitrogen dioxide (NO2), and temperature and generalized anxiety disorder (GAD) symptoms.

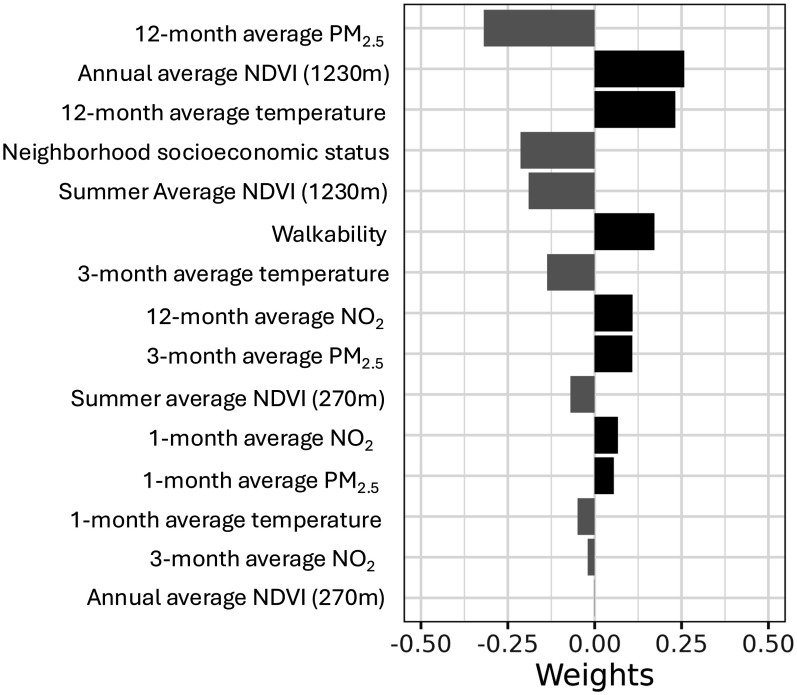
Methods: We included 81,897 participants of the Nurses' Health Study II. GAD symptoms were measured in 2013 and 2017 using the seven-item Generalized Anxiety Disorder scale (GAD-7). Walkability and nSES z-scores were calculated at the census tract level. Summer and annual average greenness were measured using Normalized Difference Vegetation Index (NDVI) at 270 m and 1,230 m buffer sizes. 1-, 3-, and 12-month averages of particulate matter with an aerodynamic diameter of <2.5micrograms (PM2.5), nitrogen dioxide (NO2), and temperature were predicted using spatiotemporal models. Exposures were measured at the residential level. Longitudinal logistic and generalized estimating equations (GEE) models estimated odds ratios (OR) and 95% confidence intervals (CIs) for clinically relevant GAD symptoms (GAD-7 5 points). We assessed effect modification by nSES, summer NDVI (1,230m), and select covariates. We employed quantile g-computation to assess the association between environmental exposure mixtures and GAD symptoms more directly.

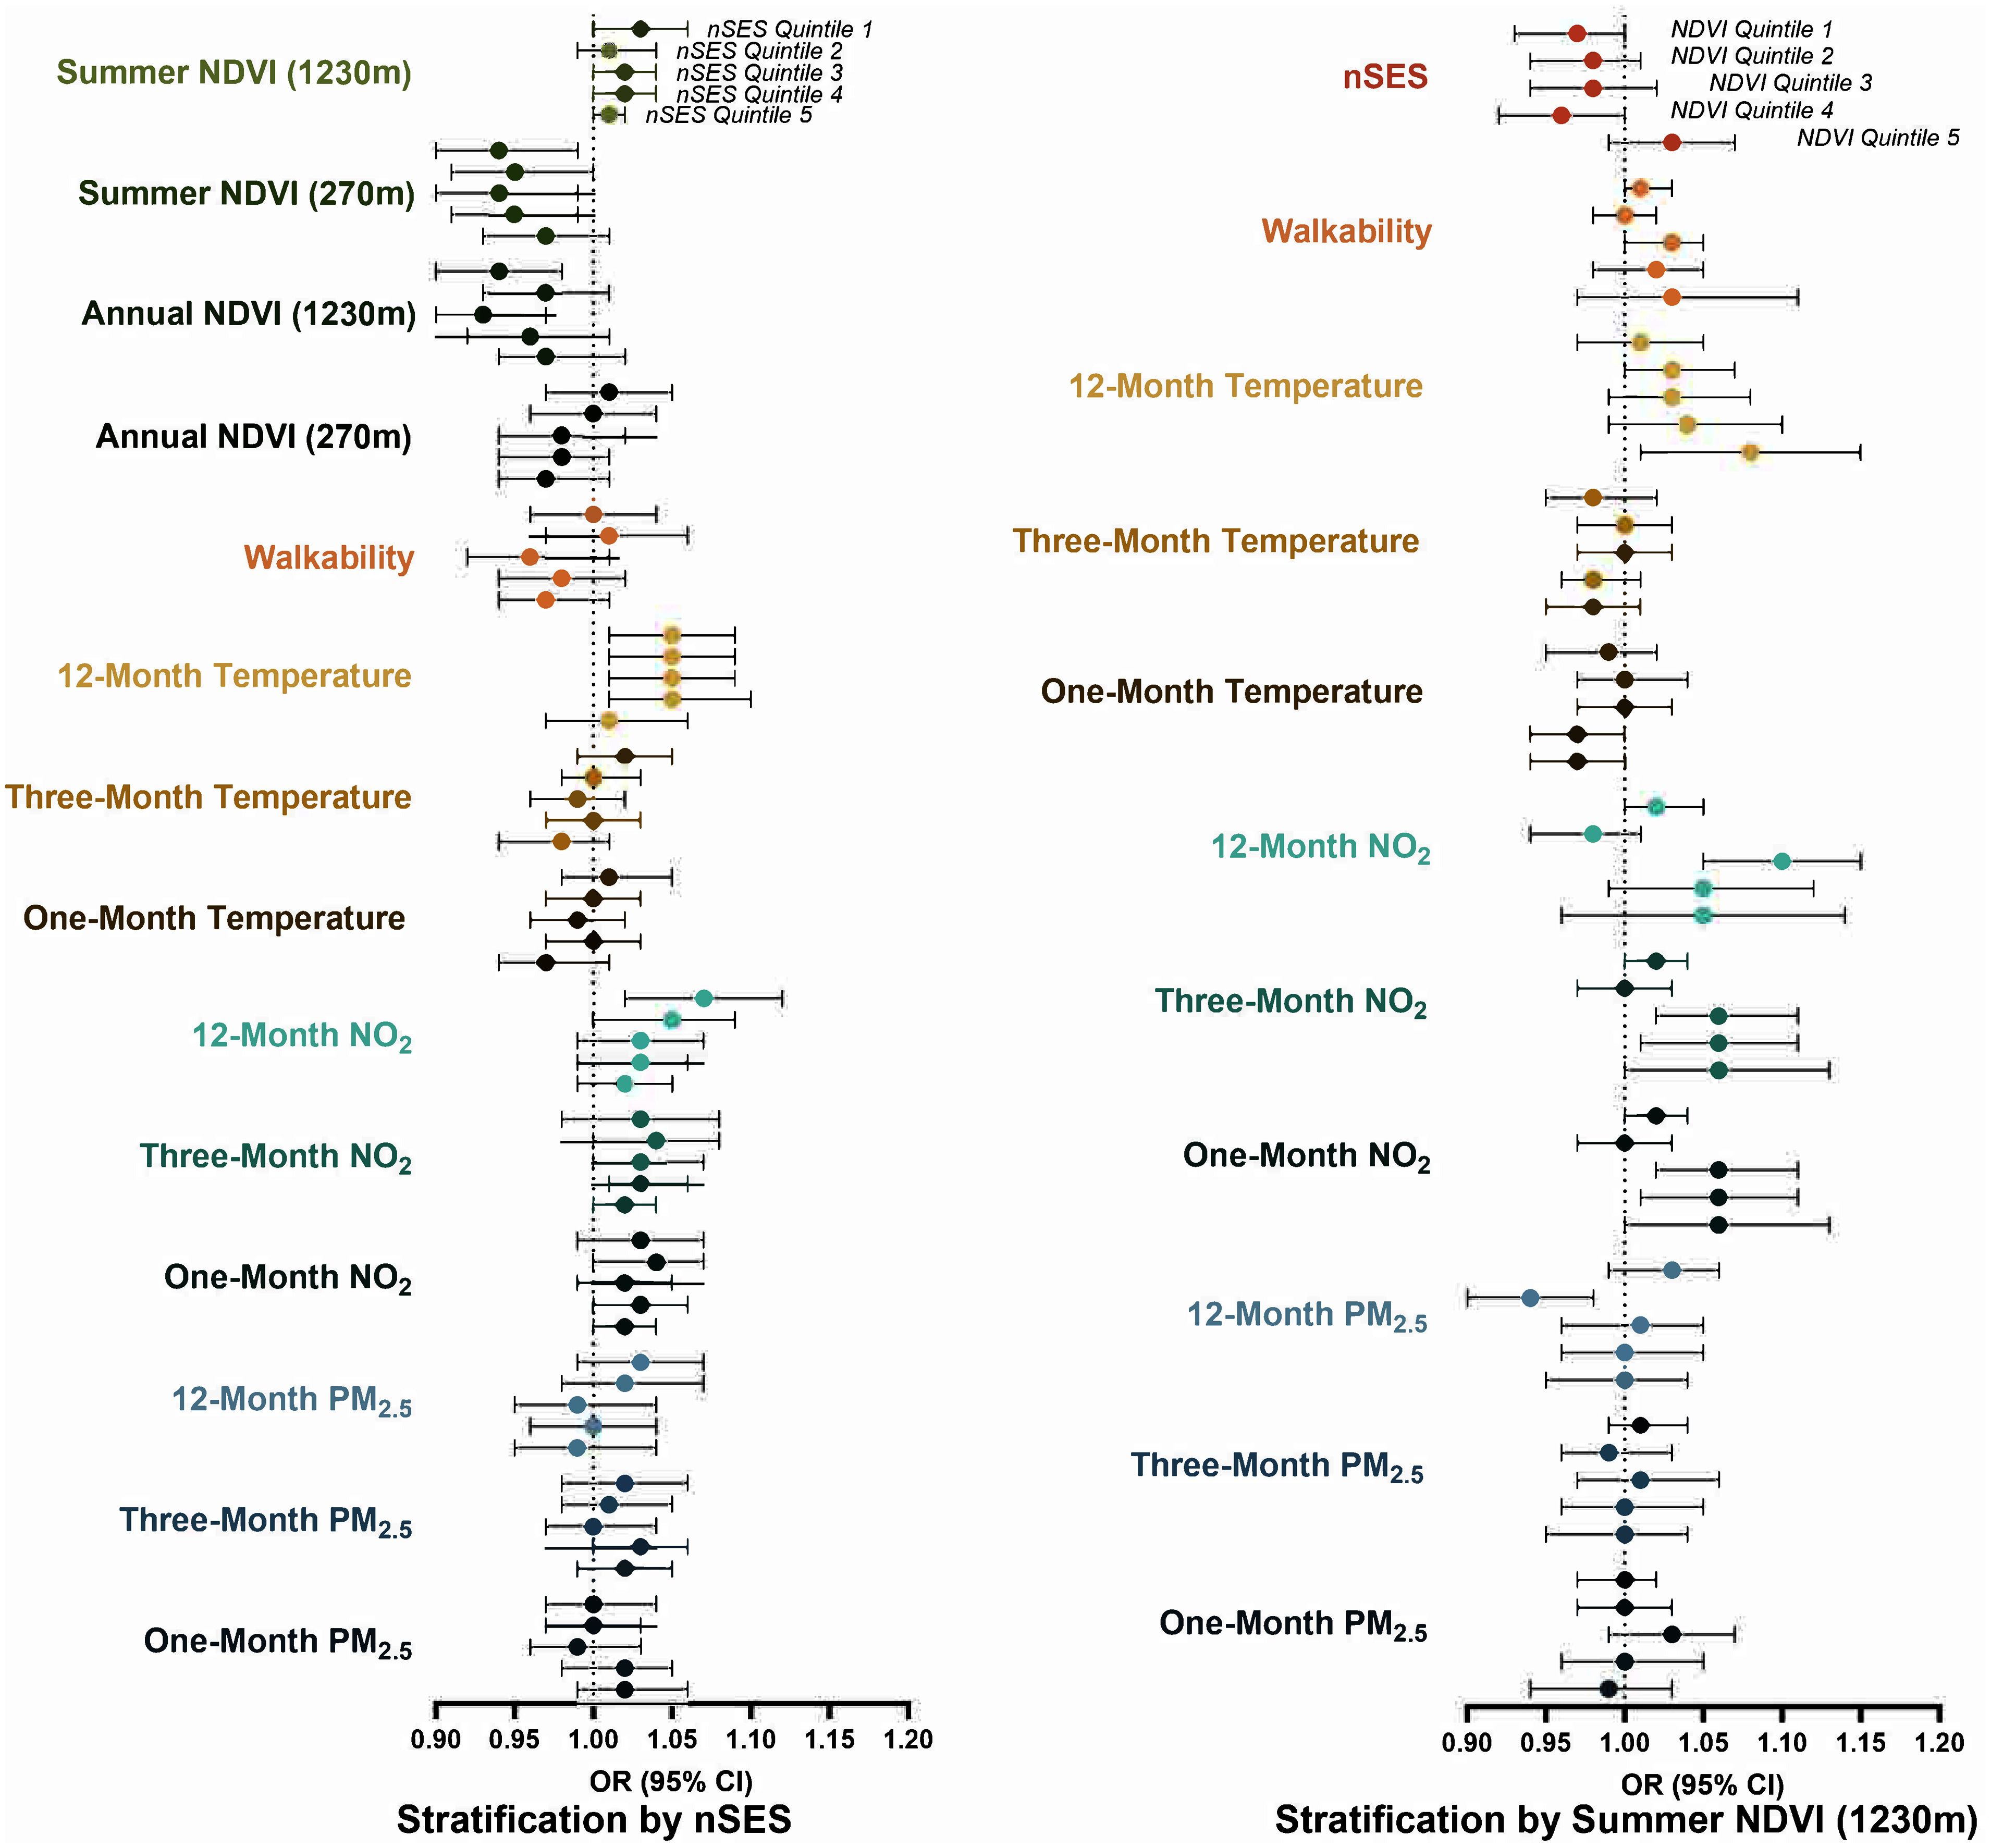
Results: In single-exposure models, summer NDVI (e.g., for 1,230m, OR=0.96; 95% CI: 0.94, 0.98), NO2 (e.g., for 12-month average NO2, OR=1.03; 95% CI: 1.01, 1.04), 12-month average temperature (OR=1.05; 95% CI: 1.03, 1.07), and walkability (OR=1.02; 95% CI: 1.01, 1.03) were associated with GAD symptoms. In the joint-exposure model, nSES (OR=0.96; 95% CI: 0.95, 0.98) and summer NDVI were associated (OR=0.92; 95% CI: 0.88, 0.96); all other associations were attenuated. Associations with summer NDVI (1,230m), temperature, and NO2 were modified by nSES, with stronger associations in socioeconomically deprived areas.

Discussion: In this population, higher levels of summer greenness and nSES may be protectively associated with GAD symptoms, whereas medium- and long-term NO2 exposure, long-term temperature, and walkability are adversely associated with GAD symptoms. Socioeconomically deprived areas may bear additional risks. The results of the quantile g-computation analysis suggest that environmental exposures may act antagonistically with one another in relation to GAD symptoms. https://doi.org/10.1289/EHP14458.


Figures

Figure 1 is a set of two forest plots, plotting One-month particulate matter begin subscript 2.5 end subscript, three-month particulate matter begin subscript 2.5 end subscript. 12-month particulate matter begin subscript 2.5 end subscript, one-month nitrogen dioxide, two-month nitrogen dioxide, 12-month nitrogen dioxide, one-month temperature, three-month temperature, 12 –month temperature, walkability, annual Normalized Difference Vegetation Index (270 meters), annual Normalized Difference Vegetation Index (1230 meters0, summer Normalized Difference Vegetation Index (270 meters), summer Normalized Difference Vegetation Index (1230 meters); and One-month particulate matter begin subscript 2.5 end subscript, three-month particulate matter begin subscript 2.5 end subscript. 12-month particulate matter begin subscript 2.5 end subscript, one-month nitrogen dioxide, two-month nitrogen dioxide, 12-month nitrogen dioxide, one-month temperature, three-month temperature, 12 –month temperature, walkability, neighborhood socioeconomic status (y-axis) across odds ratio (95 percent confidence intervals) under stratification by neighborhood socioeconomic status, ranging from 0.90 to 1.20 in increments of 0.05 and odds ratio (95 percent confidence intervals) under stratification by summer Normalized Difference Vegetation Index (1230 meters), ranging from 0.90 to 1.20 in increments of 0.05 (x-axis).
Figure 1.
ORs and 95% CIs for clinically relevant symptoms of at least mild GAD (GAD-7 5; modeled GAD-7 score dichotomized at a score of 5, indicating clinically relevant symptoms of mild GAD associated with each IQR increase in PM2.5 exposure, NO2 exposure, annual and summer NDVI, and walkability stratified by neighborhood nSES and summer 1,230-m NDVI using single-exposure GEE models for 81,897 participants with complete exposure data and outcome data in 2013 and/or 2017 in Nurses’ Health Study II. (Left) Stratification by quintiles of neighborhood socioeconomic status. (Right) Stratification by quintiles of NDVI at 1,230-m buffer size. Effect estimates are presented in Tables S3 and S4. Note: CI, confidence interval; GAD, generalized anxiety disorder; GAD-7, seven-item Generalized Anxiety Disorder scale; GEE, generalized estimating equations; IQR, interquartile range; nSES, neighborhood socioeconomic status; NDVI, Normalized Difference Vegetation Index; OR, odds ratio; PM2.5, particulate matter with aerodynamic diameter 2.5μm.
Figure 2 is a horizontal bar graphs, plotting Annual average Normalized Difference Vegetation Index (270 meters), 3-month average nitrogen dioxide, 1-month average temperature, 1-month average particulate matter begin subscript 2.5 end subscript, 1-month average nitrogen dioxide, Summer average Normalized Difference Vegetation Index (270 meters), 3-month average particulate matter begin subscript 2.5 end subscript, 12-month average nitrogen dioxide, 3-month average temperature, Walkability, Summer Average Normalized Difference Vegetation Index (1230 meters), Neighborhood socioeconomic status, 12-month average temperature, Annual average Normalized Difference Vegetation Index (1230 meters), and 12-month average particulate matter begin subscript 2.5 end subscript (y-axis) across Weights, ranging from negative 0.50 to 0.50 in increments of 0.25 (x-axis).
Figure 2.
Scaled weights from quantile g-computation analysis of a mixture of 15 environmental exposures and their associations with clinically relevant symptoms of at least mild GAD (GAD-7 5; modeled GAD-7 score dichotomized at a score of 5, indicating clinically relevant symptoms of mild GAD) across 81,897 participants with complete exposure data and outcome data in 2013 and/or 2017 in Nurses’ Health Study II. Quantile g-computation analysis was adjusted for age at baseline, time, AHEI (diet) score (including alcohol consumption), smoking status (past/current/never), marital status (married/unmarried), living arrangement (with others/alone), race (White/Non-White), ethnicity (Hispanic/non-Hispanic), husband’s education status (high school or below/past high school), and nSES z-score. Numerical data available in Table S7. Note: AHEI, Alternative Healthy Eating Index; GAD, generalized anxiety disorder; GAD-7, seven-item Generalized Anxiety Disorder scale; NDVI, Normalized Difference Vegetation Index; PM2.5, particulate matter with aerodynamic diameter 2.5μm; nSES, neighborhood socioeconomic status.

Similar articles

References

    1. Wild CP. 2012. The exposome: from concept to utility. Int J Epidemiol 41(1):24–32, PMID: 22296988, 10.1093/ije/dyr236. - DOI - PubMed
    1. Wild CP. 2005. Complementing the genome with an ‘exposome’: the outstanding challenge of environmental exposure measurement in molecular epidemiology. Cancer Epidemiol Biomarkers Prev 14(8):1847–1850, PMID: 16103423, 10.1158/1055-9965.EPI-05-0456. - DOI - PubMed
    1. Brauer M. 2024. Global burden and strength of evidence for 88 risk factors in 204 countries and 811 subnational locations, 1990–2021: a systematic analysis for the Global Burden of Disease Study 2021. Lancet 403:2162–2203, PMID: 38762324, 10.1016/S0140-6736(24)00933-4. - DOI - PMC - PubMed
    1. Harvard Medical School, Harvard University. 2007. National Comorbidity Survey (NCS) Data Table 1: Lifetime prevalence DSM-IV/WMH-CIDI Disorders by Sex and Cohort. Boston, MA: Harvard University.
    1. American Psychiatric Association, DSM-5 Task Force. 2013. American Psychiatric Association: Diagnostic and Statistical Manual of Mental Disorders: DSM-5™. 5th ed. Washington, DC: American Psychiatric Publishing, Inc.