. 2025 Apr 16;4(4):CD011689.
doi: 10.1002/14651858.CD011689.pub4.

Uterotonic agents for preventing postpartum haemorrhage: a network meta-analysis

Affiliations

Uterotonic agents for preventing postpartum haemorrhage: a network meta-analysis

Ioannis D Gallos et al. Cochrane Database Syst Rev. .

Abstract

Rationale: Postpartum haemorrhage (PPH) is the leading cause of maternal mortality worldwide. Prophylactic uterotonic agents can prevent PPH. The current World Health Organization (WHO) recommendation for preventing PPH is 10 IU (international units) of intramuscular or intravenous oxytocin. Several uterotonics prevent PPH, but there remains uncertainty about the most effective agent with the fewest side effects. This is an update of a review first published in April 2018, and incorporates trustworthiness screening of eligible trials.

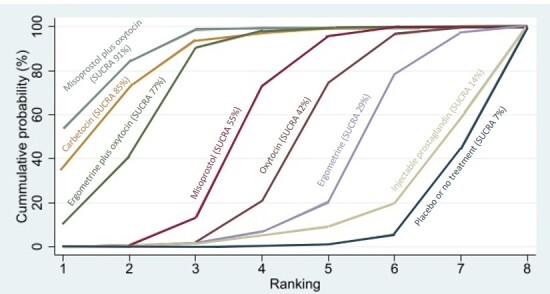
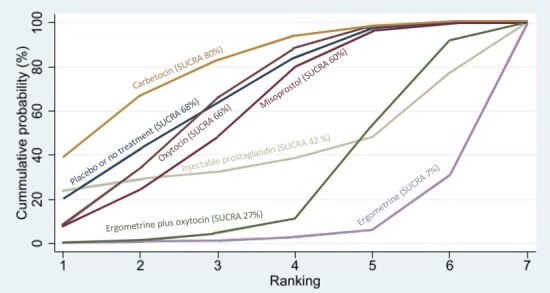
Objectives: To identify the most effective uterotonic agent(s) to prevent PPH with the fewest side effects, and generate a ranking according to their effectiveness and side effect profile.

Search methods: On 5 February 2024, we searched CENTRAL, MEDLINE, Embase and CINAHL in collaboration with the Cochrane Information Specialist.

Eligibility criteria: All randomised controlled trials (RCTs) or cluster-RCTs that compared the effectiveness and side effects of uterotonic agents with other uterotonic agents, placebo or no treatment for preventing PPH were eligible for inclusion. We screened eligible trials for trustworthiness. We included randomised trials published only as abstracts if we could retrieve sufficient information; we excluded quasi-randomised trials.

Outcomes: Primary outcomes were PPH ≥ 500 mL and PPH ≥ 1000 mL. Secondary outcomes included use of additional uterotonics, blood transfusion, vomiting, hypertension, and fever.

Risk of bias: We used RoB 1 to assess risk of bias.

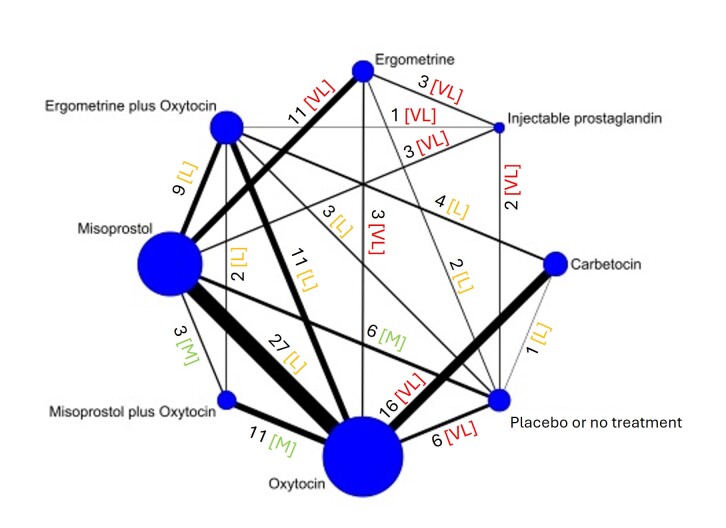
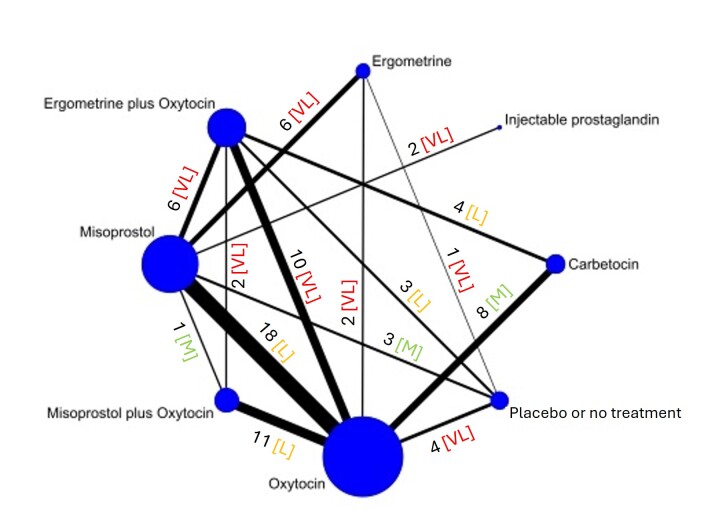
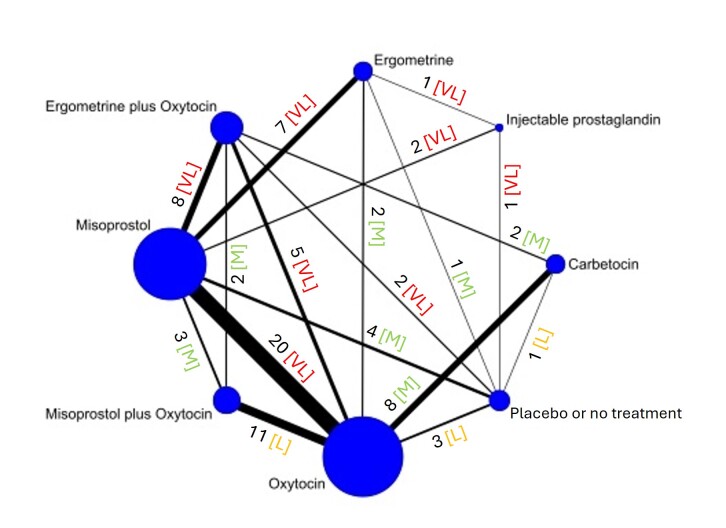
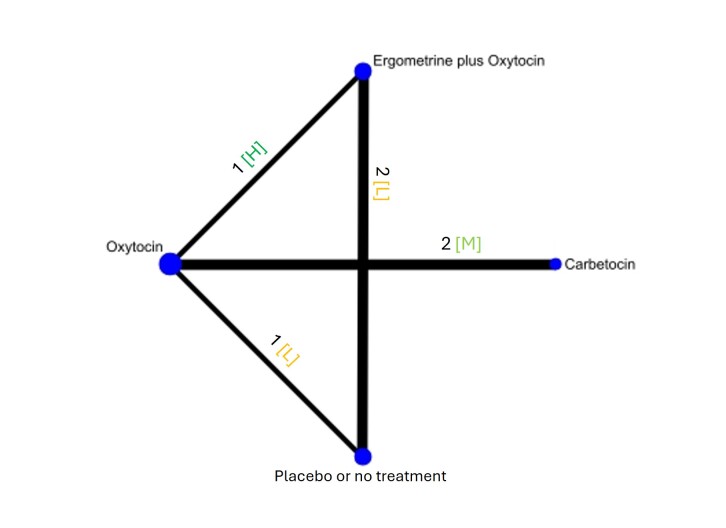
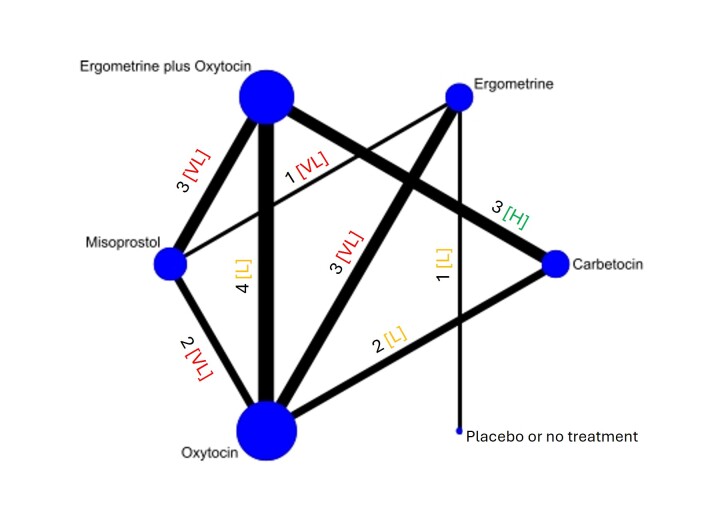
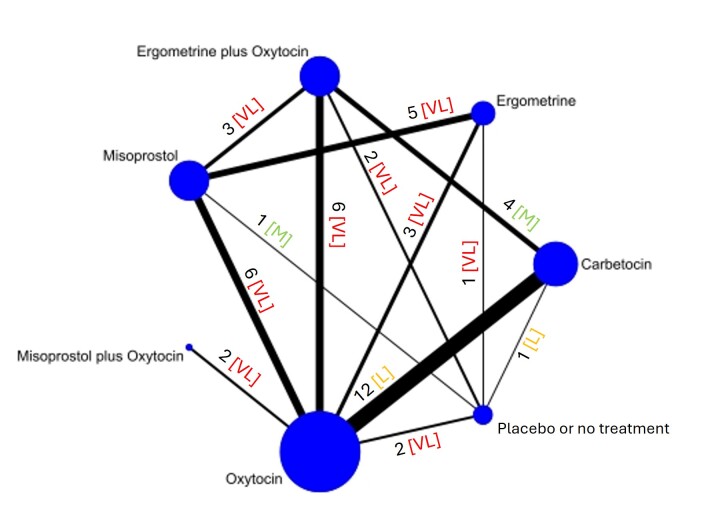
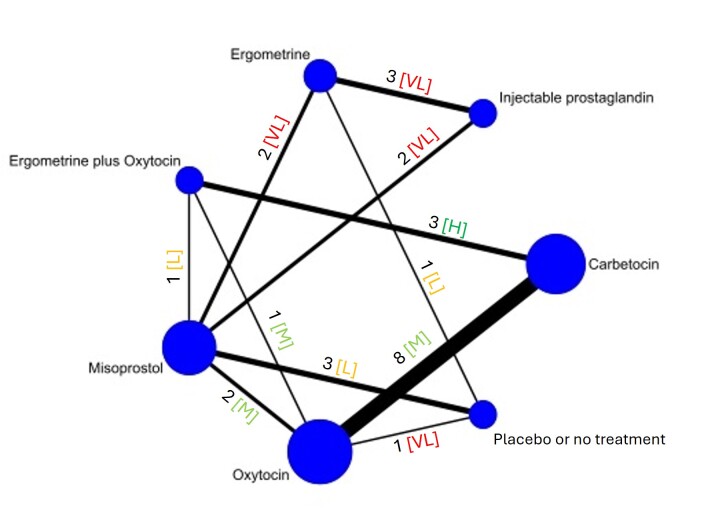
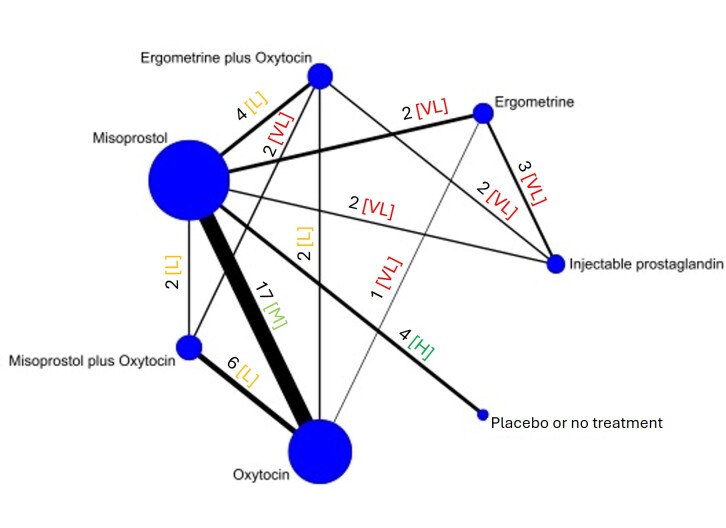
Synthesis methods: At least three review authors independently assessed trials for inclusion, trustworthiness, risk of bias, and certainty of evidence using GRADE. We estimated the relative effects and rankings for the primary and secondary outcomes. We reported primary outcomes for prespecified subgroups, stratified by mode of birth (caesarean versus vaginal), setting (hospital versus community), prior risk of PPH (high versus low), dose of misoprostol (≥ 600 μg versus < 600 μg), and regimen of oxytocin (bolus versus bolus plus infusion versus infusion only). We performed pairwise meta-analyses and network meta-analysis to determine the relative effects and rankings of all available agents.

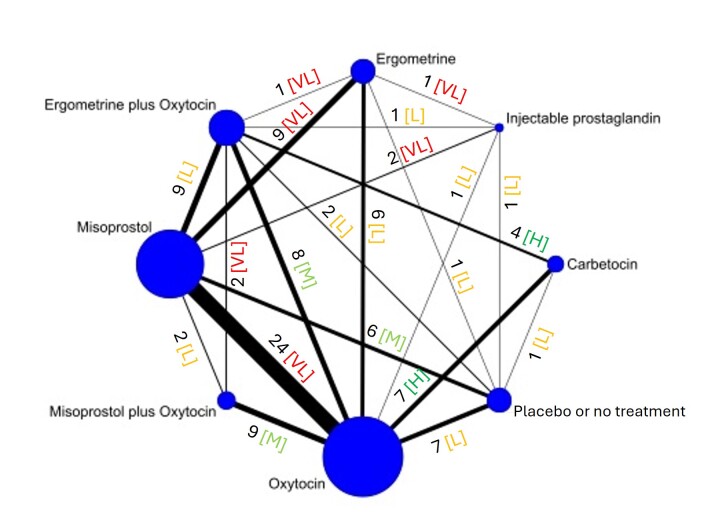
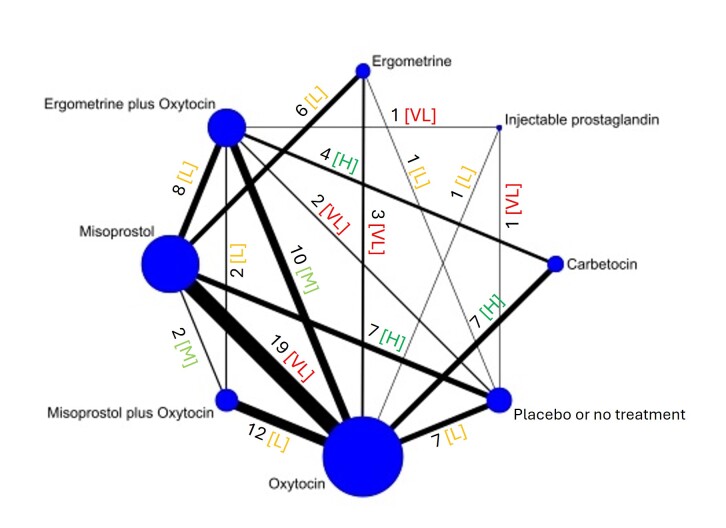
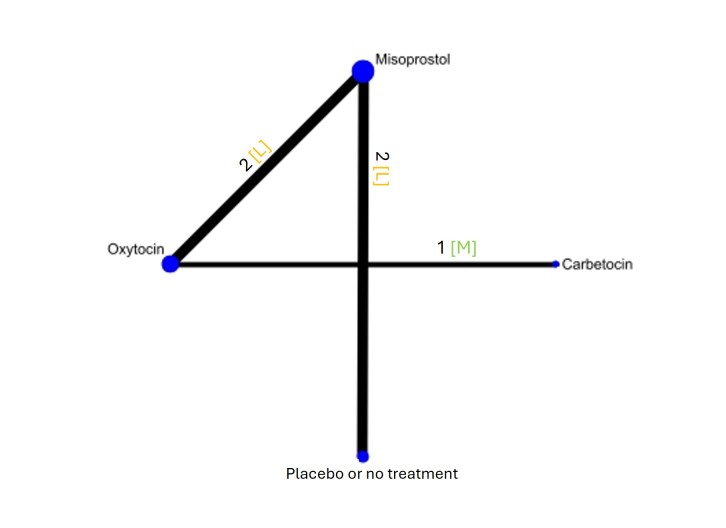
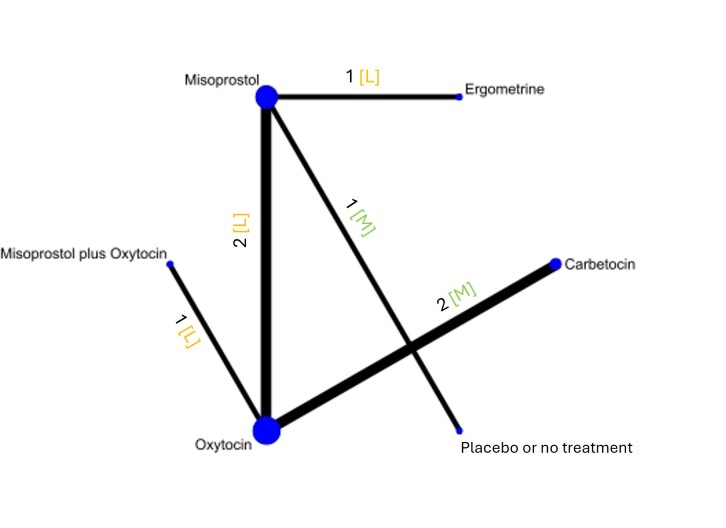
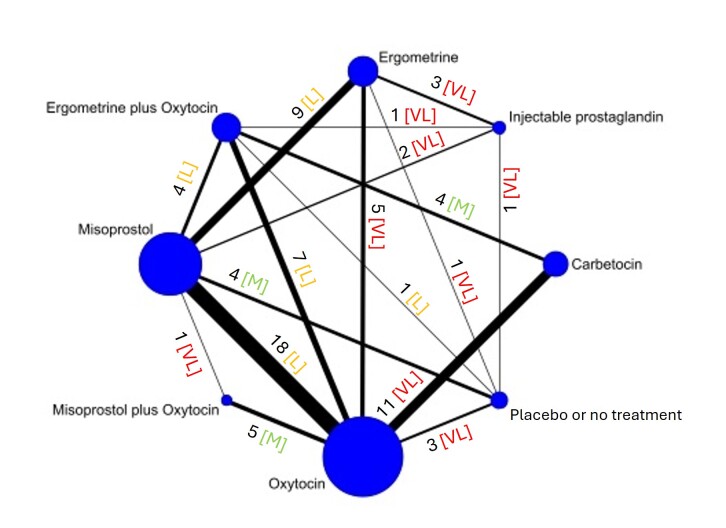
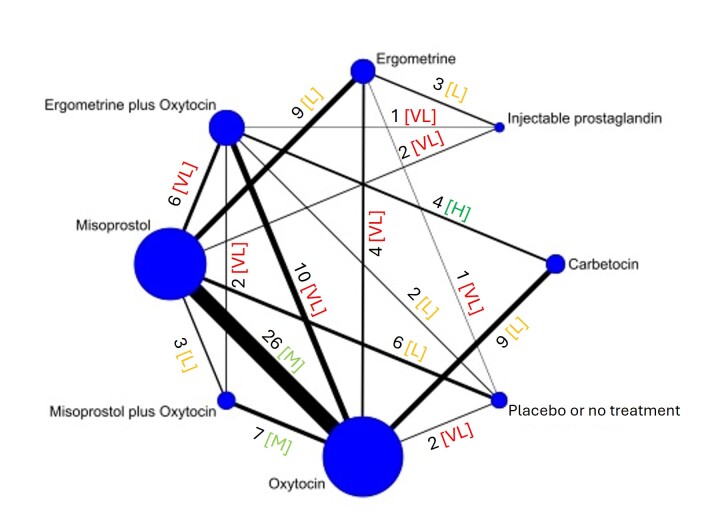
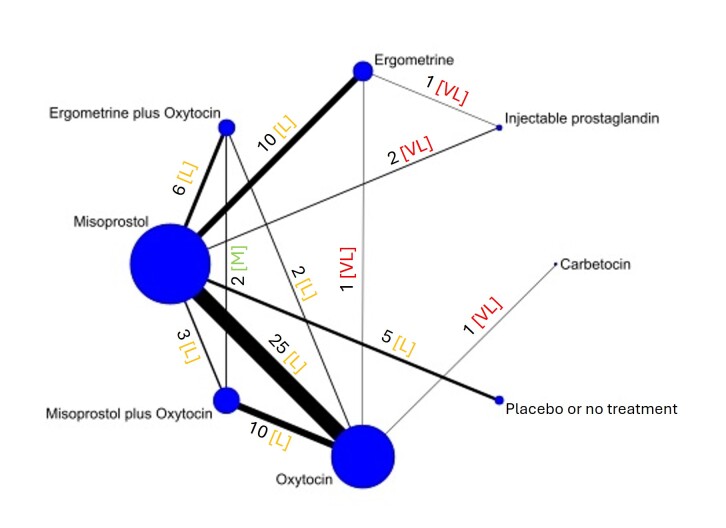
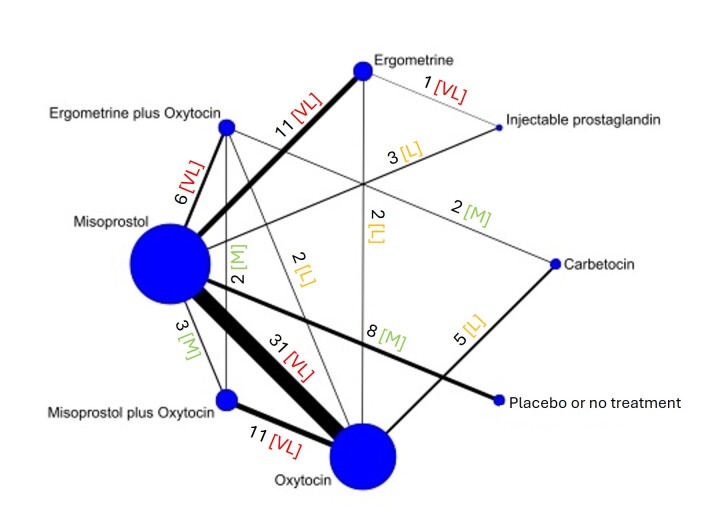
Included studies: The network meta-analysis included 122 trials (121,931 women), involving seven uterotonic agents and placebo or no treatment, conducted across 48 high-, middle- and low-income countries. Most were in a hospital setting (115/122, 94%), with women having a vaginal birth (87/122, 71%).

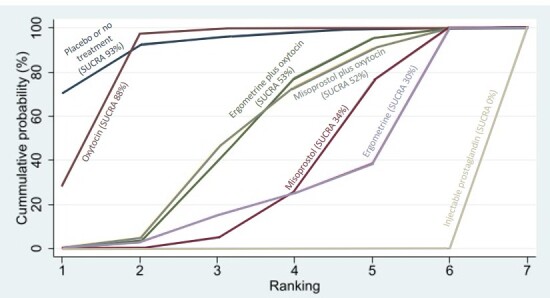
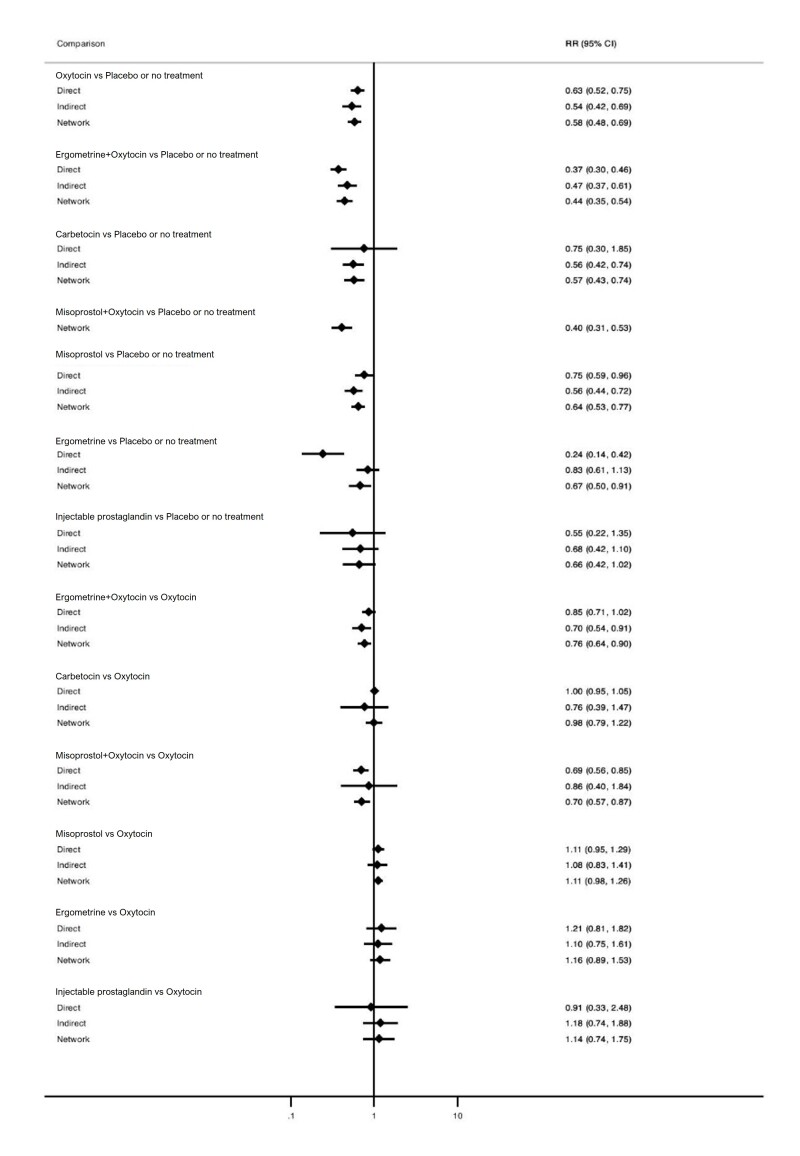
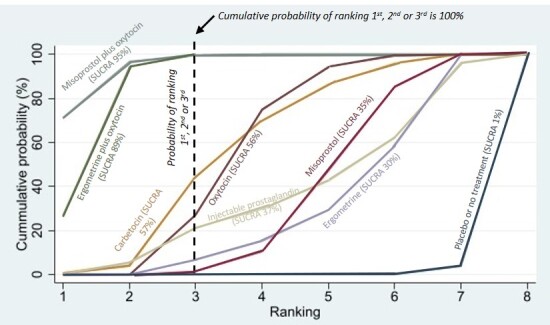
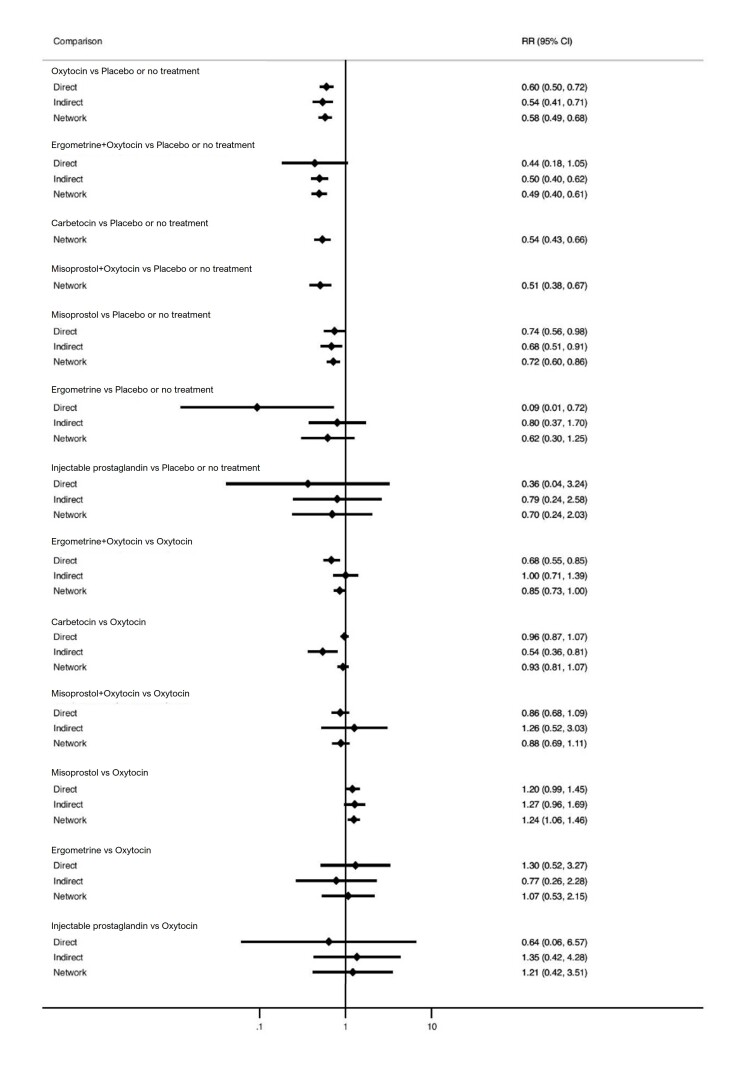
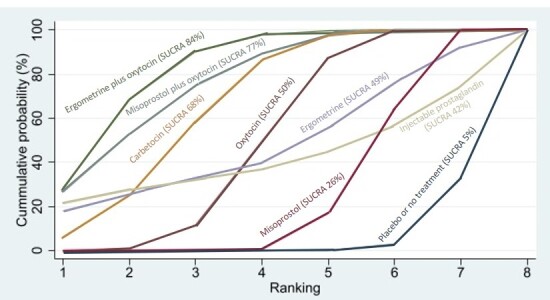
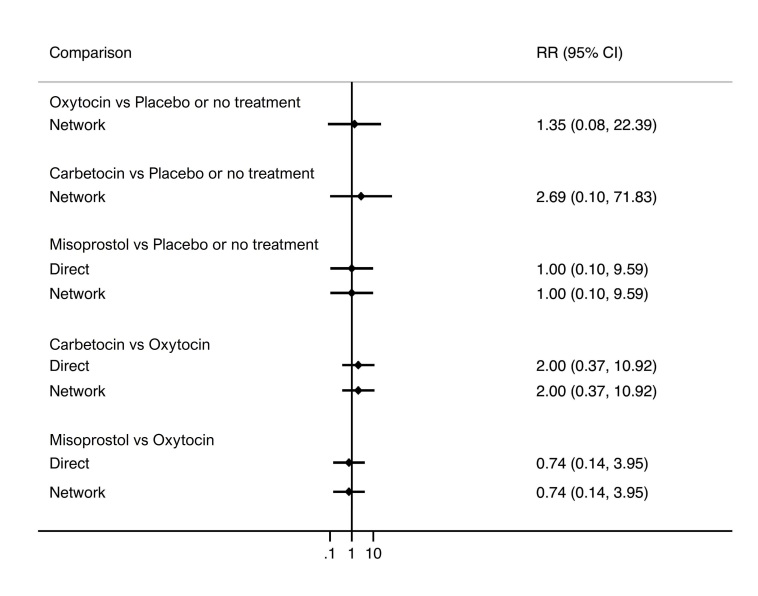
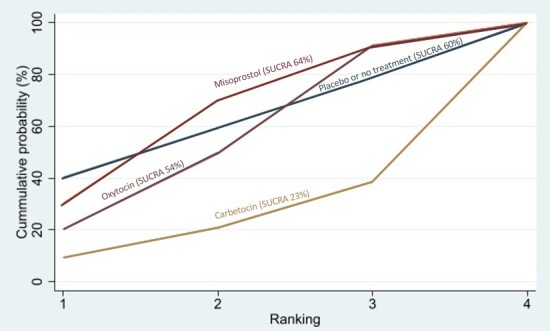
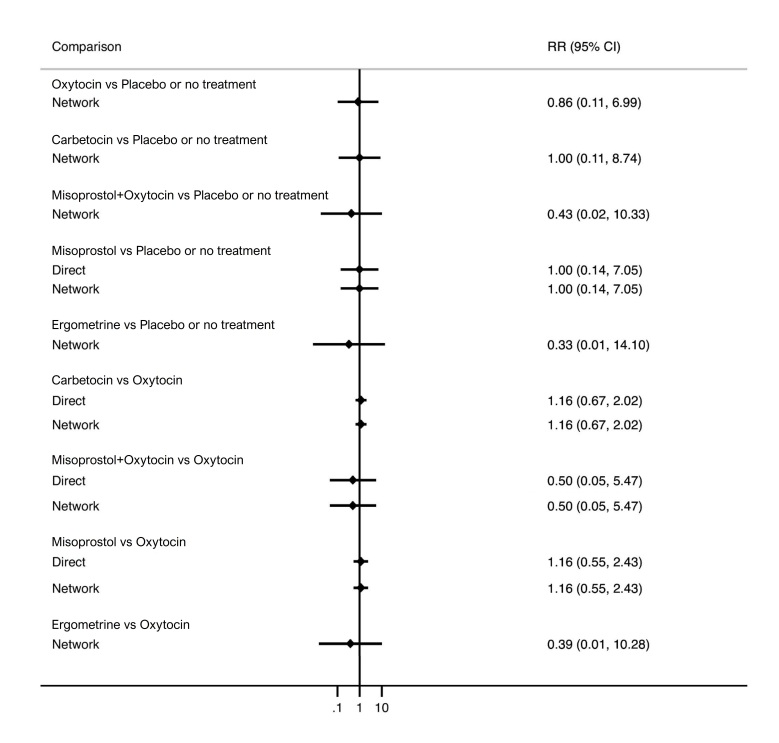
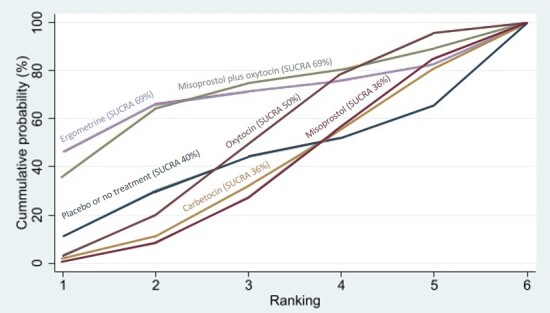
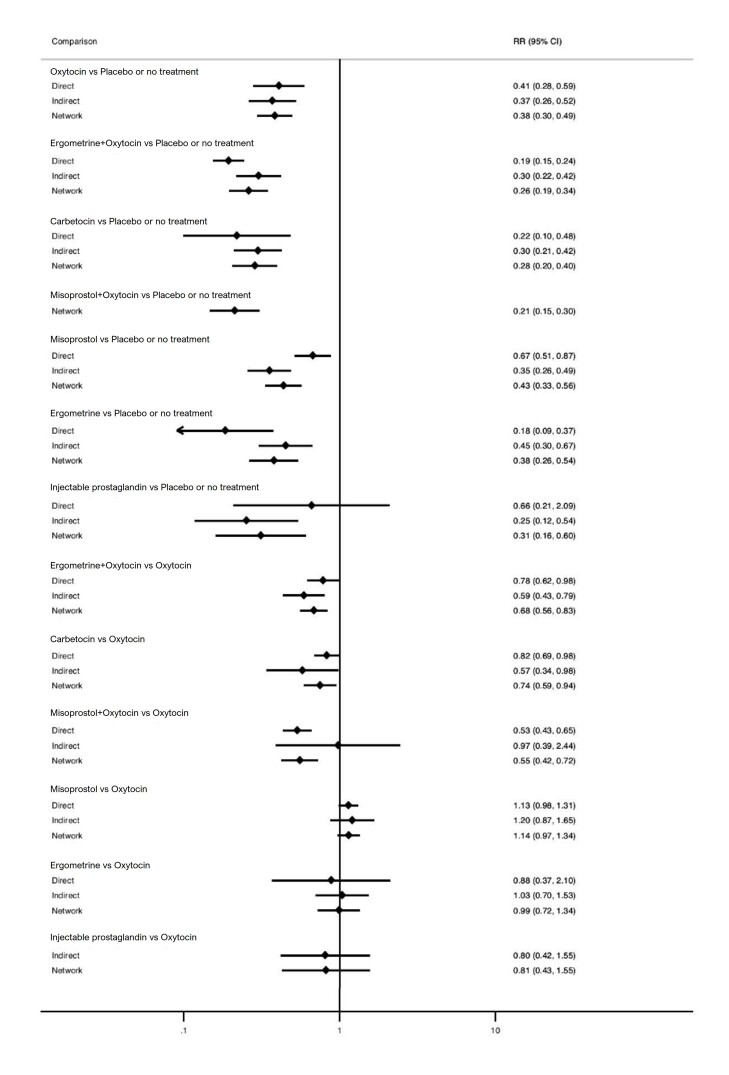
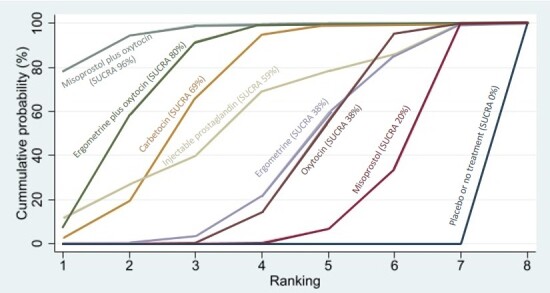
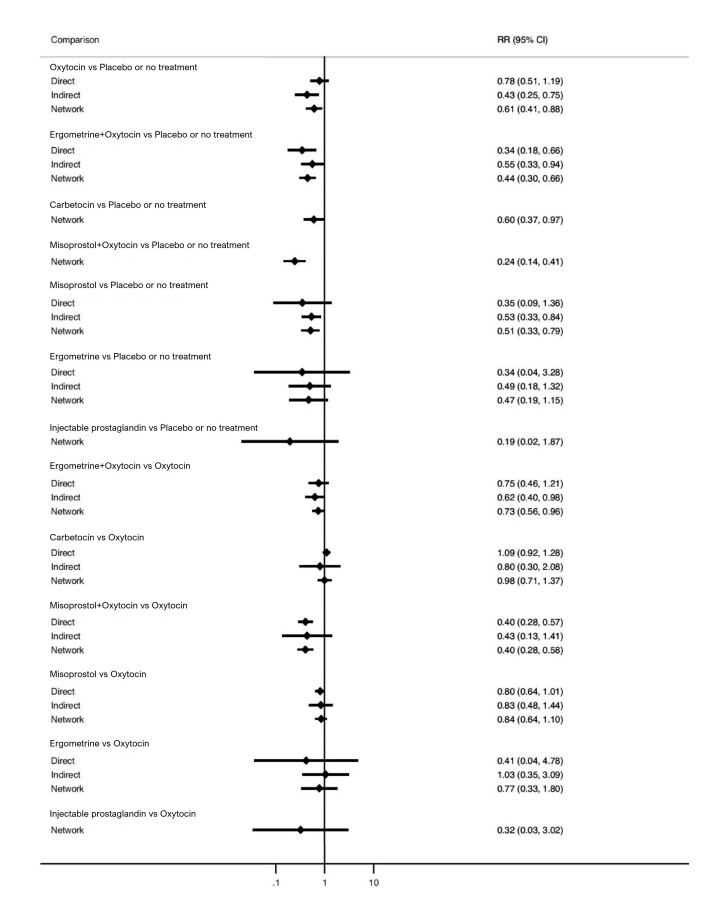
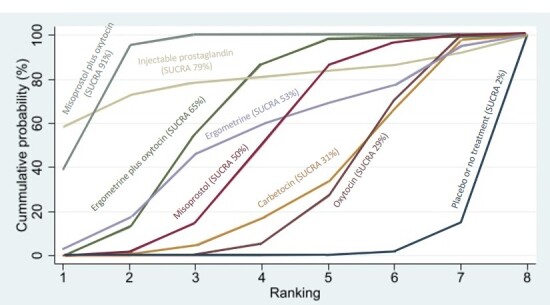
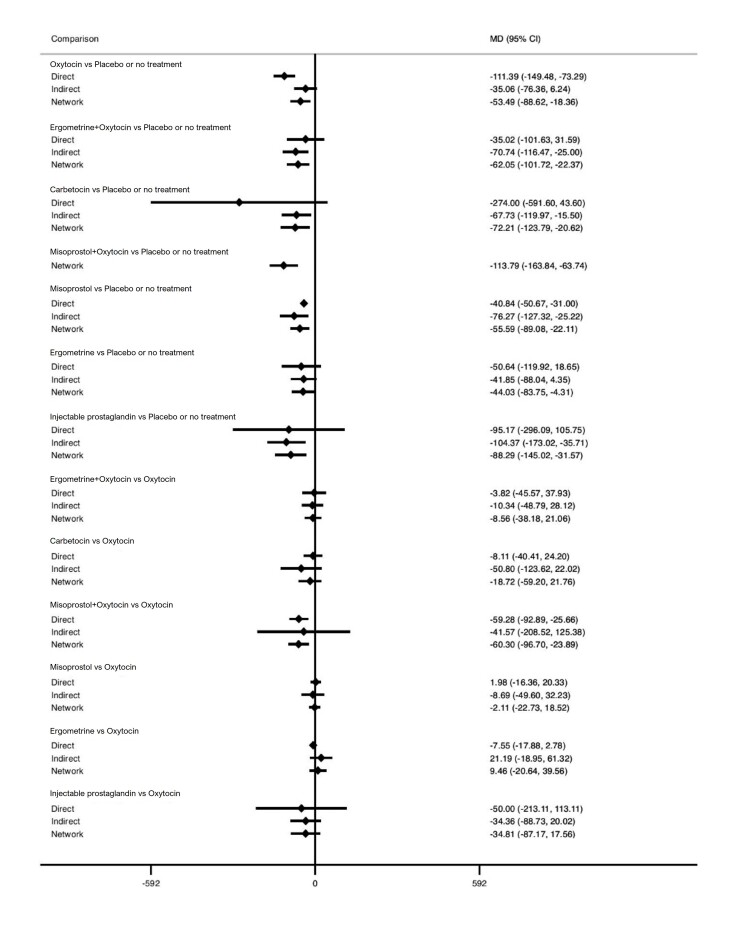
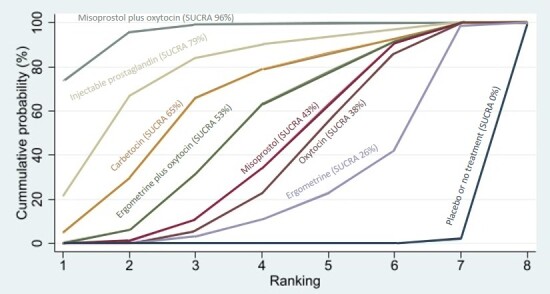
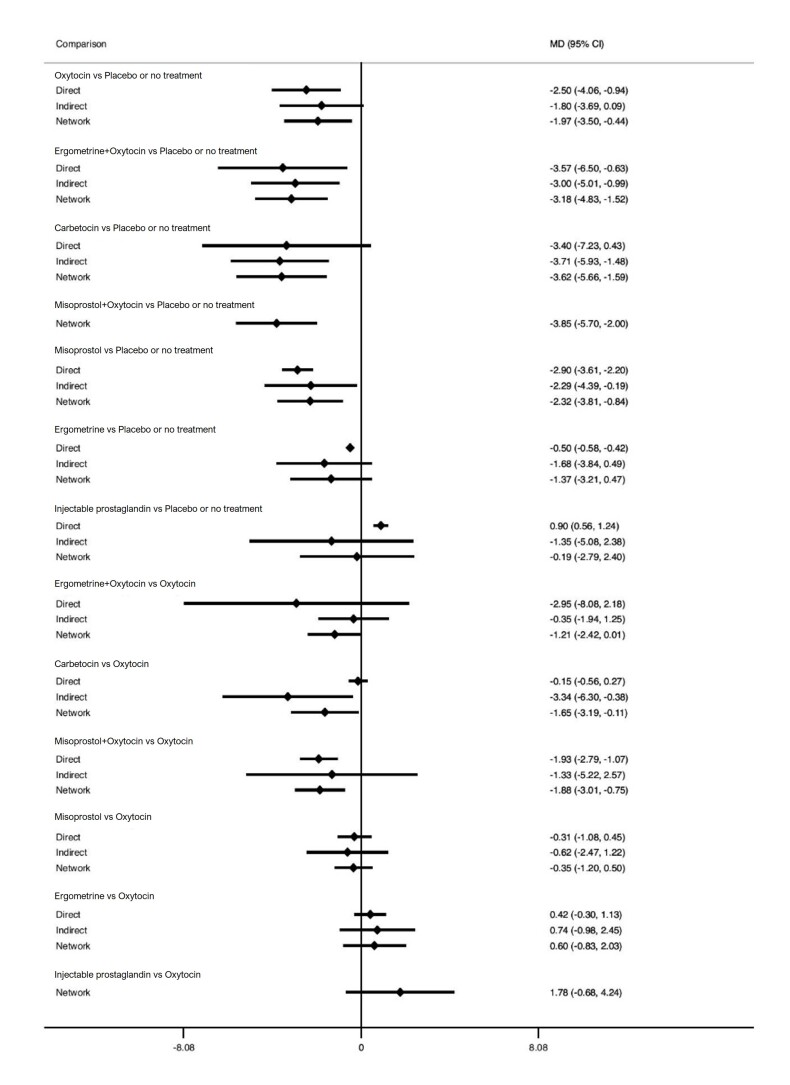
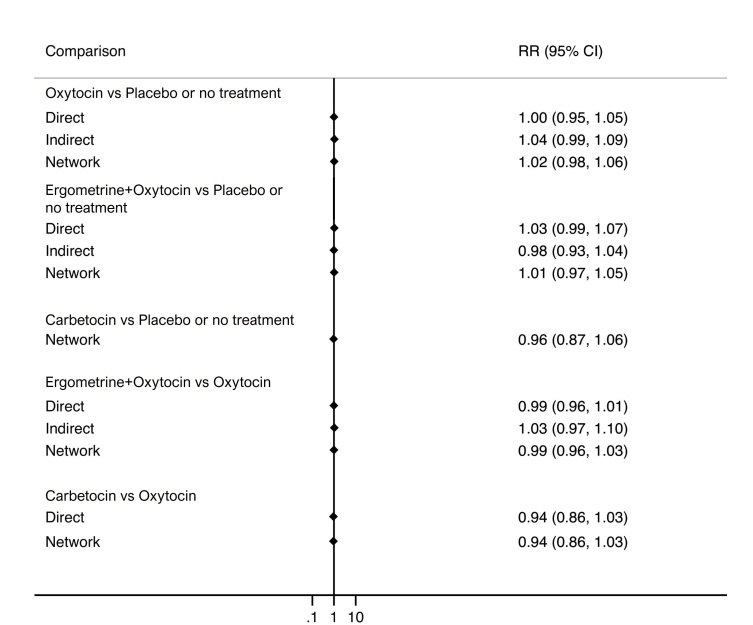
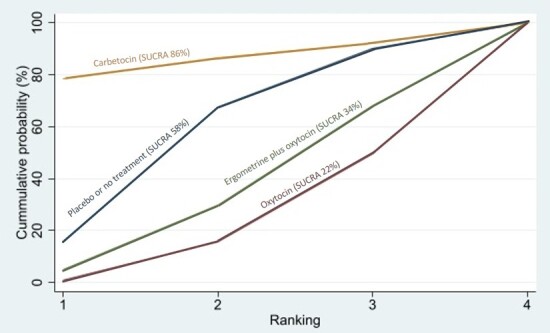
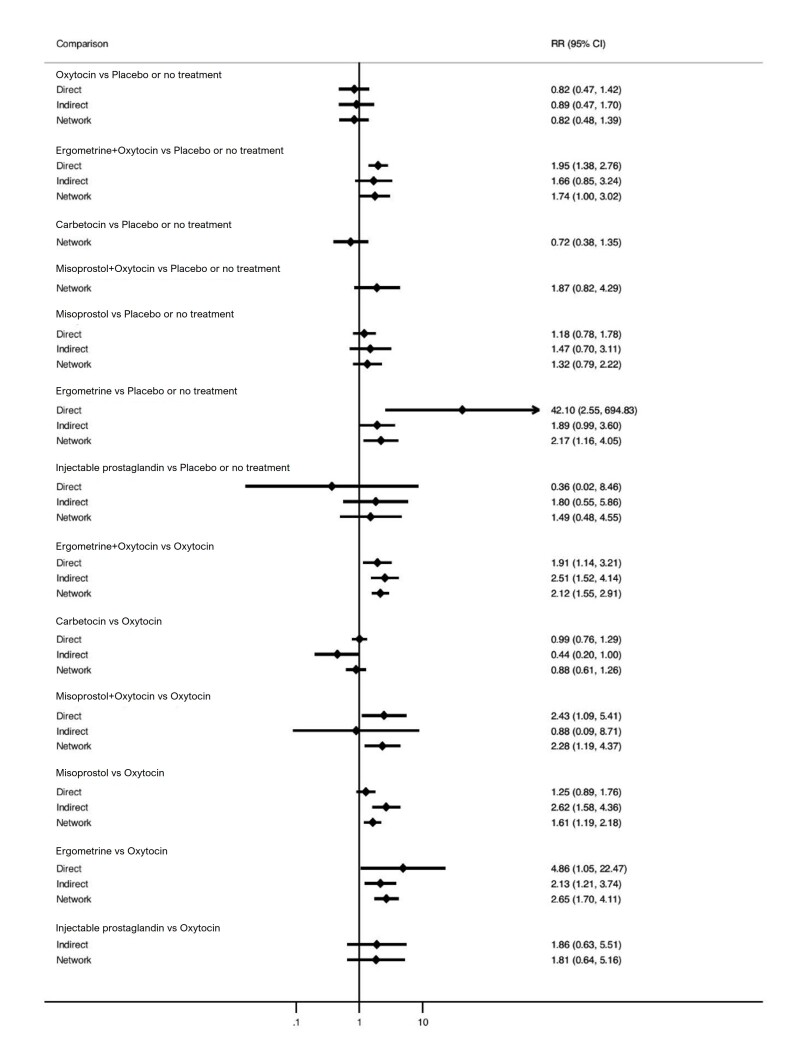
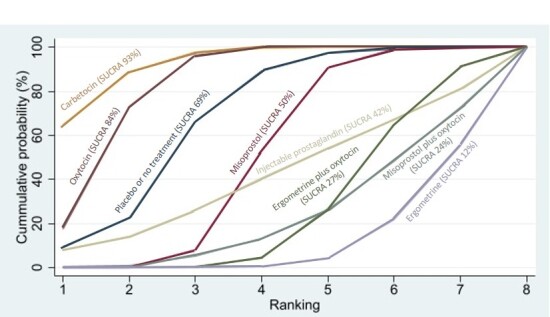
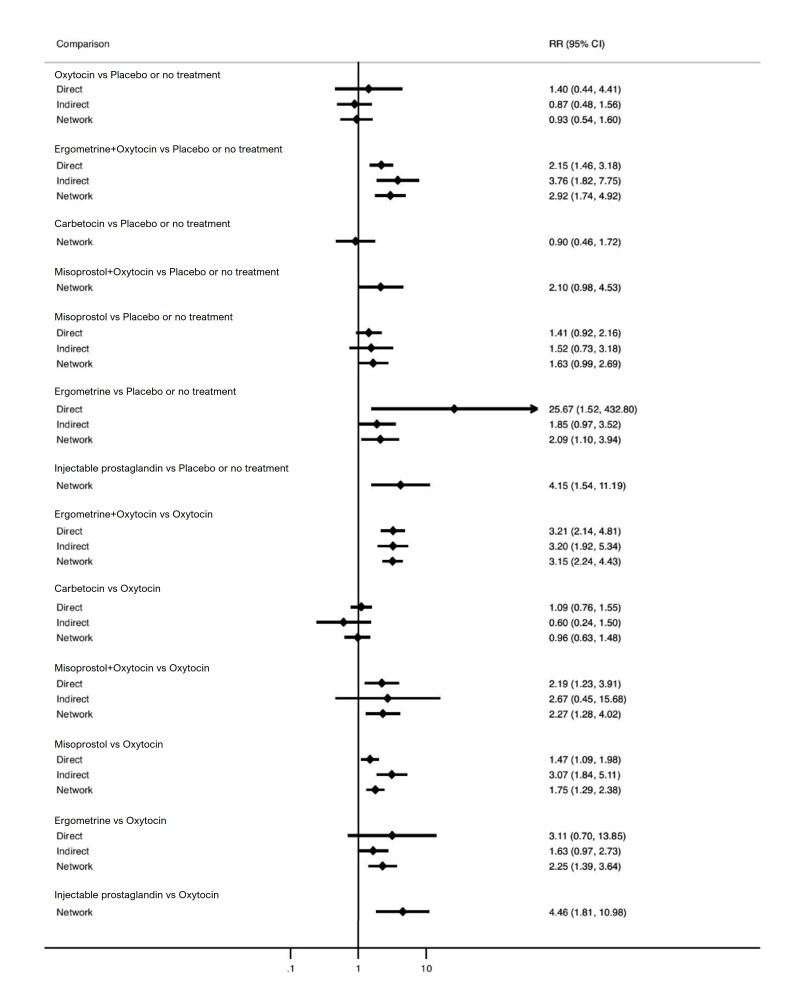
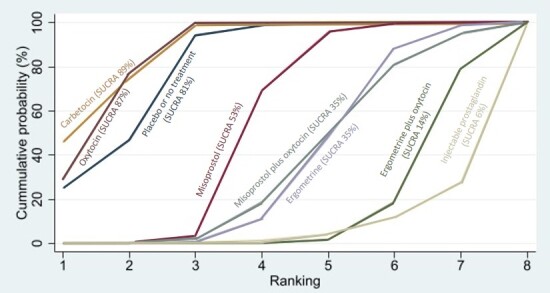
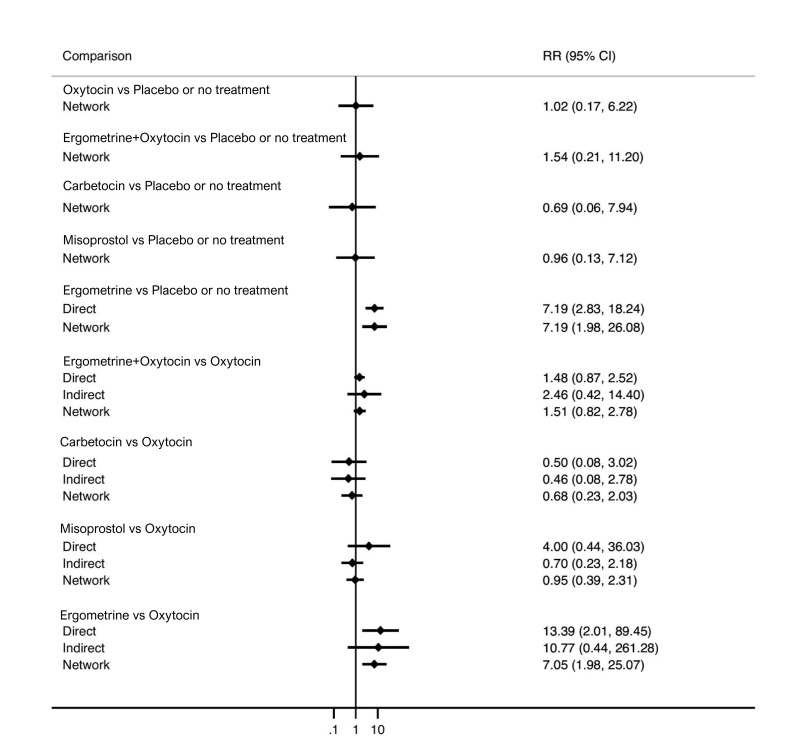
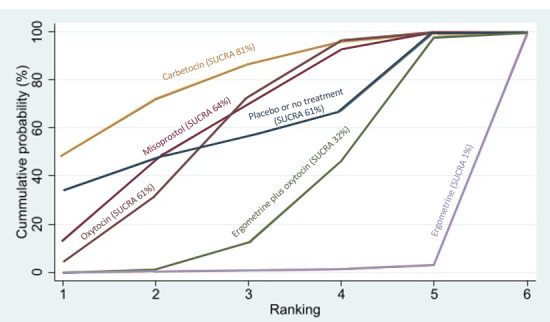
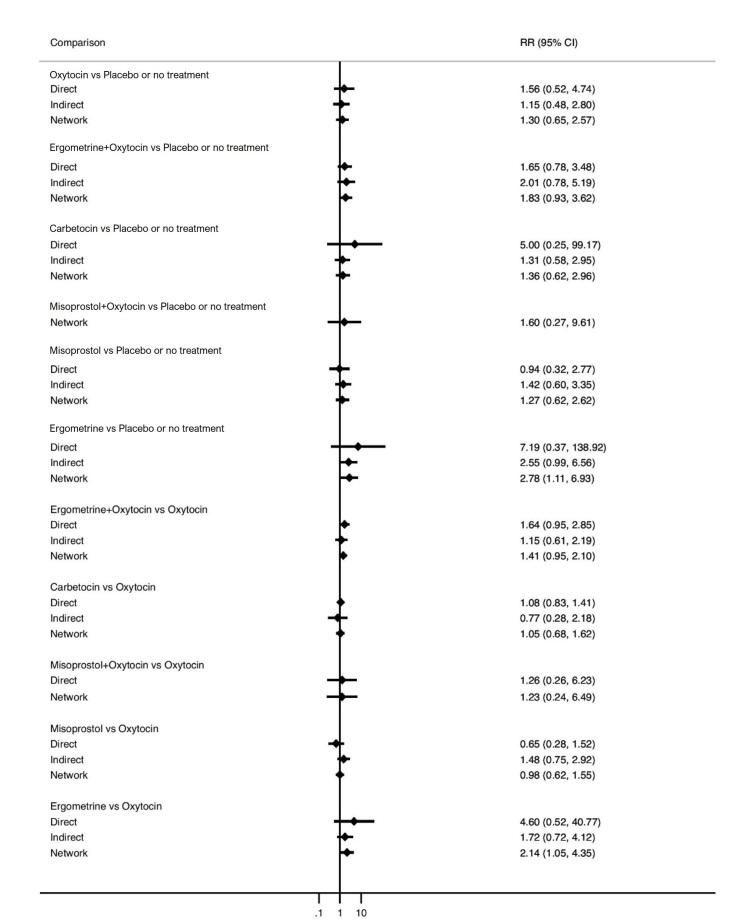
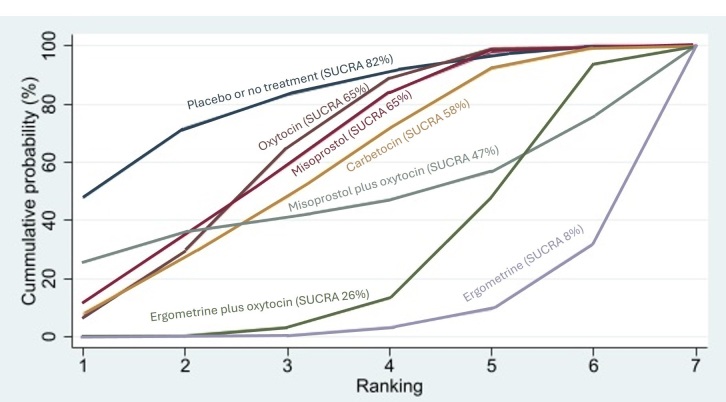
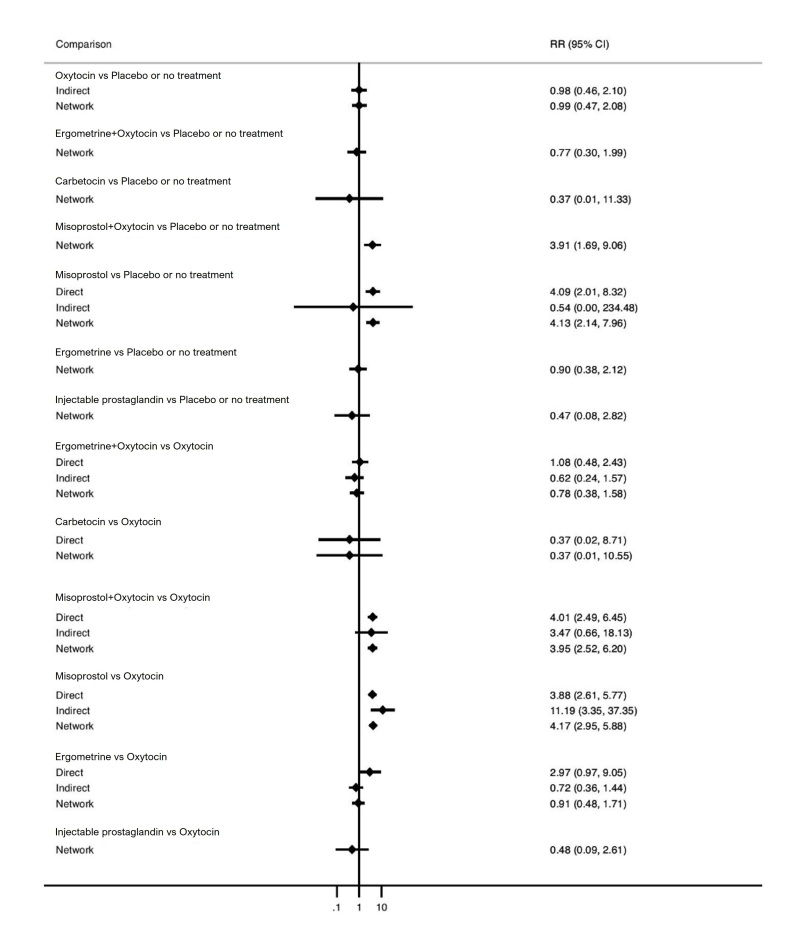
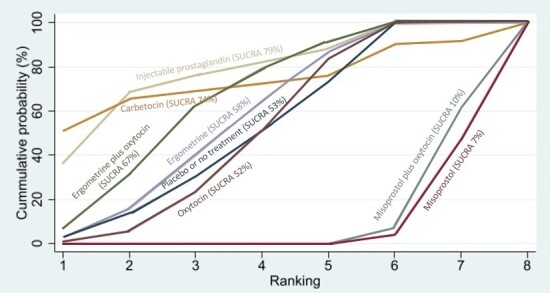
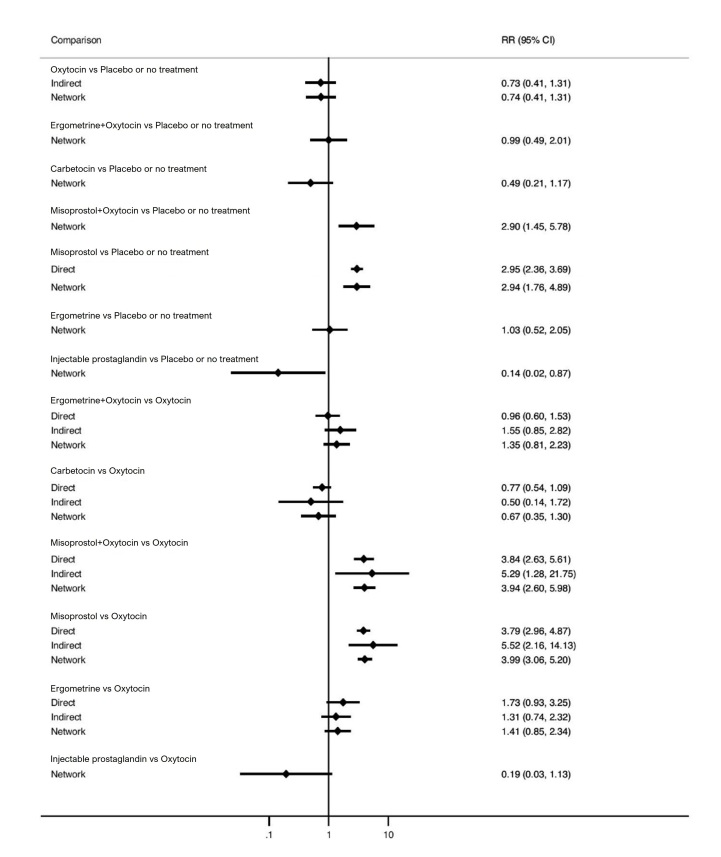
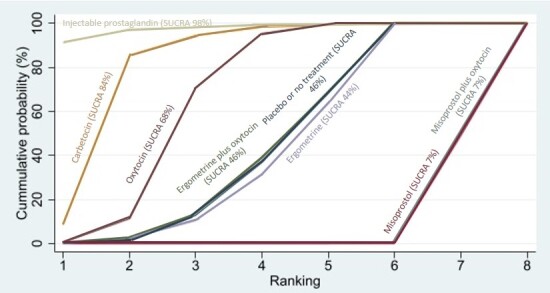
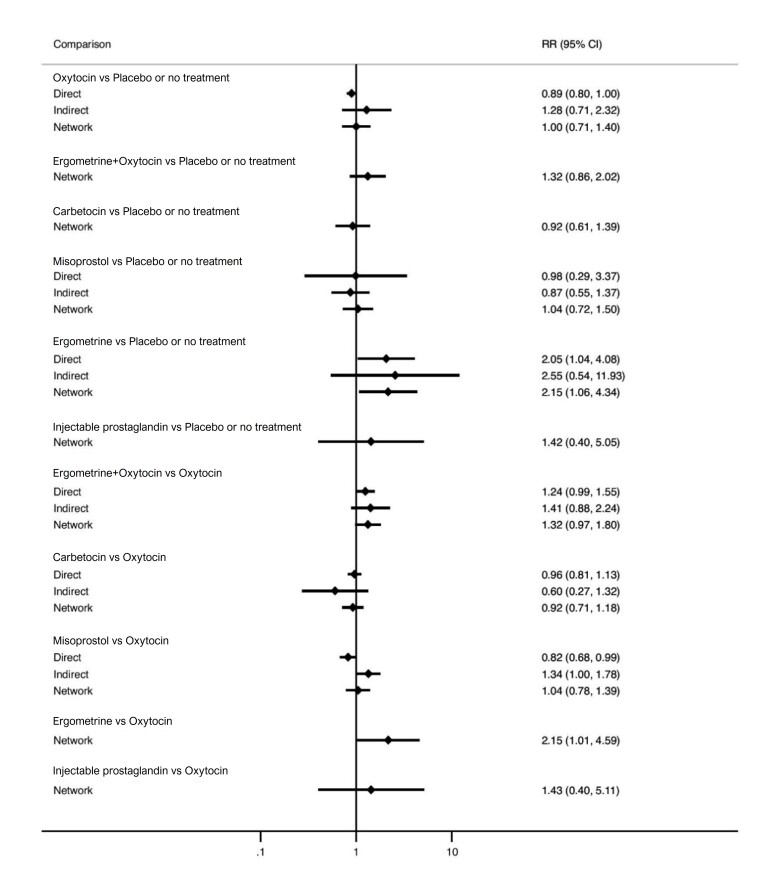
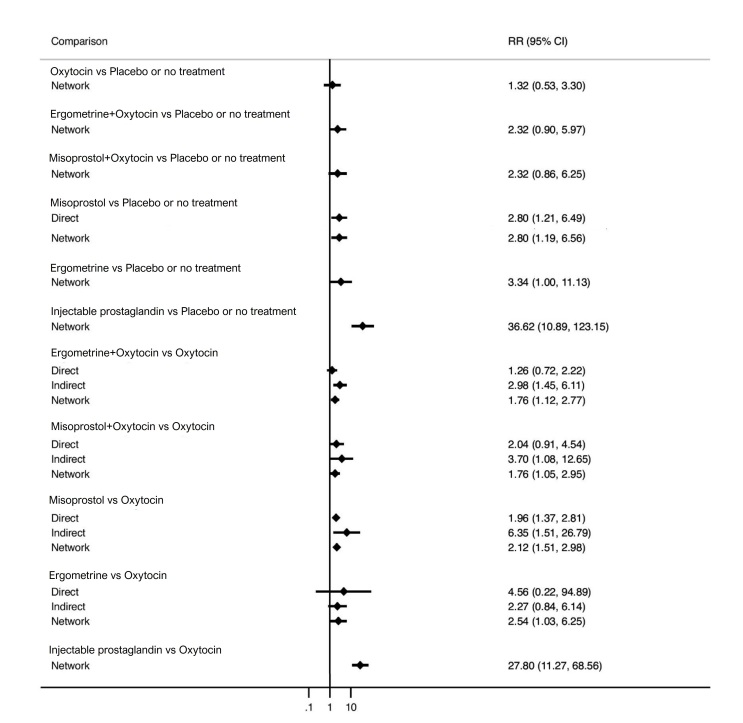
Synthesis of results: Relative effects from the network meta-analysis suggested that all agents, except injectable prostaglandins, for which data were limited, were effective for preventing PPH ≥ 500 mL compared with placebo or no treatment. The two highest-ranked agents were ergometrine plus oxytocin and misoprostol plus oxytocin. Compared with oxytocin, ergometrine plus oxytocin reduces PPH ≥ 500 mL (risk ratio (RR) 0.76, 95% confidence interval (CI) 0.64 to 0.90, high-certainty evidence), and misoprostol plus oxytocin probably reduces PPH ≥ 500 mL (RR 0.70, 95% CI 0.57 to 0.87; moderate-certainty evidence). Carbetocin (high-), injectable prostaglandins (moderate-) and ergometrine (low-certainty evidence) have similar effects compared with oxytocin. The evidence for misoprostol is very low certainty. All agents, except ergometrine and injectable prostaglandins, for which data were limited, were effective for preventing PPH ≥ 1000 mL compared with placebo or no treatment. Ergometrine plus oxytocin, and misoprostol plus oxytocin were the highest-ranked agents. Compared with oxytocin, carbetocin and injectable prostaglandins (both moderate-certainty evidence), and misoprostol plus oxytocin (low-certainty evidence) make little or no difference to PPH ≥ 1000 mL. Misoprostol may be less effective in preventing PPH ≥ 1000 mL compared with oxytocin (RR 1.24, 95% CI 1.06 to 1.46; low-certainty evidence). The certainty of evidence for ergometrine and ergometrine plus oxytocin was very low. Compared with oxytocin, misoprostol plus oxytocin probably reduces the use of additional uterotonics (RR 0.55, 95% CI 0.42 to 0.72, moderate-certainty evidence), and carbetocin (RR 0.74, 95% CI 0.59 to 0.94; low-certainty evidence), and ergometrine plus oxytocin may reduce the use of additional uterotonics (RR 0.68, 95% CI 0.56 to 0.83; low-certainty evidence). Misoprostol (low-certainty evidence) makes little or no difference to this outcome. Misoprostol plus oxytocin probably reduces the risk of needing a blood transfusion (RR 0.40, 95% CI 0.28 to 0.58; moderate-certainty-evidence), and ergometrine plus oxytocin may reduce the risk of blood transfusion compared with oxytocin (RR 0.73, 95% CI 0.56 to 0.96, low-certainty evidence). Carbetocin (moderate-certainty evidence) and misoprostol (low-certainty evidence) probably make little or no difference to this outcome compared with oxytocin. All uterotonic agents, except for carbetocin, were associated with increased risks of side effects compared with oxytocin. Misoprostol may increase the likelihood of nausea, vomiting and fever, and probably increases the risk of diarrhoea. Injectable prostaglandins may increase the likelihood of diarrhoea. Ergometrine probably increases the likelihood of nausea and vomiting, and may increase the likelihood of hypertension, headache, and diarrhoea. Ergometrine plus oxytocin may increase the likelihood of nausea, vomiting, and diarrhoea. Misoprostol plus oxytocin probably increases the likelihood of nausea, vomiting and diarrhoea, and may increase the likelihood of fever. Analyses of the prespecified subgroups did not reveal important subgroup differences. Evidence for outcomes not presented above but reported in the summary of findings tables was very low certainty.

Authors' conclusions: Most agents are effective for preventing PPH when compared with placebo or no treatment. Ergometrine plus oxytocin, and misoprostol plus oxytocin may be more effective than the current standard oxytocin. All agents, except for carbetocin, are associated with an increased risk of some side effects compared with oxytocin.

Funding: Supported by UNDP/UNFPA/UNICEF/WHO/World Bank Special Programme of Research, Development and Research Training in Human Reproduction (HRP), a cosponsored programme executed by the WHO (Award No. HQHRP2220228-22.1-74309).

Registration: Cochrane Library; Registration number: CD011689 and protocol [and previous versions] available via DOI: 10.1002/14651858.CD011689 [DOI: 10.1002/14651858.CD011689.pub3 and DOI: 10.1002/14651858.CD011689.pub2].


Conflict of interest statement

Ioannis D Gallos (IDG): was a co‐applicant to the UK National Institute for Health Research HTA Project Award 14/139/17 entitled Uterotonic agents for preventing postpartum haemorrhage: a network meta‐analysis and cost‐effectiveness analysis. He has been involved in one or more previous or ongoing trials related to the use of uterotonics for the prevention of PPH that were eligible for inclusion in this review. Ferring Pharmaceuticals and Novartis supplied carbetocin and oxytocin for these trials. IDG did not participate in any decisions regarding these trials (i.e. assessment for inclusion/exclusion, trial quality, data extraction) for the purposes of this review (and will not for future updates) – these tasks were carried out by other members of the team who were not directly involved in the trials.

Idnan Yunas (IY): none known

Adam Devall (AD): none known

Marecelina Podesek (MP): none known

Malcolm J Price (MJP): was a co‐applicant to the UK National Institute for Health Research HTA Project Award 14/139/17 entitled Uterotonic agents for preventing postpartum haemorrhage: a network meta‐analysis and cost‐effectiveness analysis.

Aurelio Tobias: none known

Olufemi T Oladapo (OTO): led the updating of WHO recommendations on uterotonics for the prevention of postpartum haemorrhage based on the findings of this review update.

Arri Coomarasamy (AC): was the Chief Investigator of UK National Institute for Health Research HTA Project Award 14/139/17 entitled Uterotonic agents for preventing postpartum haemorrhage: a network meta‐analysis and cost‐effectiveness analysis. He has been involved in one or more previous or ongoing trials related to the use of uterotonics for the prevention of PPH that were eligible for inclusion in this review. Ferring Pharmaceuticals and Novartis supplied carbetocin and oxytocin for these trials and another trial is supported by WHO/Merck for Mothers. AC did not participate in any decisions regarding these trials (i.e. assessment for inclusion/exclusion, trial quality, data extraction) for the purposes of this review or future updates – these tasks have been carried out by other members of the team who were not directly involved in the trials. AC is a member of the Executive Board of Ammalife (UK registered charity 1120236). He does not receive any payment for this relationship.

Figures

1
1
Diagram showing the flow of trials in the review
2
2
Risk of bias graph: review authors' judgements about each risk of bias item presented as percentages across all included studies
3
3
Risk of bias summary: review authors' judgements about each risk of bias item for each included study
4
4
Network Diagram for PPH ≥ 500 mL. The nodes represent an intervention and their size is proportional to the number of trials comparing this intervention to any other in the network. The lines connecting each pair of interventions represent a direct comparison and are drawn proportional to the number of trials making each direct comparison. Numbers on the lines represent the number of trials for each comparison. [VL] very low‐certainty evidence; [L] low‐certainty evidence; [M] moderate‐certainty evidence. Multi‐arm trials contribute to more than one comparison.
5
5
Cumulative rankograms comparing each of the uterotonic agents for diarrhoea. Ranking indicates the cumulative probability of being the best agent, the second best, the third best, etc. The x axis shows the relative ranking and the y‐axis the cumulative probability of each ranking.We estimate the SUrface underneath this Cumulative RAnking line (SUCRA); the larger the SUCRA the higher its rank among all available agents.
6
6
Forest plot with relative risk ratios and 95% CIs from pairwise, indirect and network (combining direct and indirect) analyses for prevention of PPH ≥ 500 mL
7
7
Cumulative rankograms comparing each of the uterotonic agents for prevention of PPH ≥ 500 mL. Ranking indicates the cumulative probability of being the best agent, the second best, the third best, etc. The x axis shows the relative ranking and the y‐axis the cumulative probability of each ranking.We estimate the SUrface underneath this Cumulative RAnking line (SUCRA); the larger the SUCRA the higher its rank among all available agents.
8
8
Network Diagram for PPH ≥ 1000 mL. The nodes represent an intervention and their size is proportional to the number of trials comparing this intervention to any other in the network. The lines connecting each pair of interventions represent a direct comparison and are drawn proportional to the number of trials making each direct comparison. Numbers on the lines represent the number of trials for each comparison. [VL] very low‐certainty evidence; [L] low‐certainty evidence; [M] moderate‐certainty evidence. Multi‐arm trials contribute to more than one comparison.
9
9
Forest plot with relative risk ratios and 95% CIs from pairwise, indirect and network (combining direct and indirect) analyses for prevention of PPH ≥ 1000 mL.
10
10
Cumulative rankograms comparing each of the uterotonic agents for prevention of PPH ≥ 1000 mL. Ranking indicates the cumulative probability of being the best agent, the second best, the third best, etc. The x axis shows the relative ranking and the y‐axis the cumulative probability of each ranking.We estimate the SUrface underneath this Cumulative RAnking line (SUCRA); the larger the SUCRA the higher its rank among all available agents.
11
11
Network Diagram for maternal death. The nodes represent an intervention and their size is proportional to the number of trials comparing this intervention to any other in the network. The lines connecting each pair of interventions represent a direct comparison and are drawn proportional to the number of trials making each direct comparison. Numbers on the lines represent the number of trials for each comparison. [VL] very low‐certainty evidence. Multi‐arm trials contribute to more than one comparison.
12
12
Forest plot with relative risk ratios and 95% CIs from pairwise, indirect and network (combining direct and indirect) analyses for prevention of maternal death.
13
13
Cumulative rankograms comparing each of the uterotonic agents for prevention of maternal death. Ranking indicates the cumulative probability of being the best agent, the second best, the third best, etc. The x axis shows the relative ranking and the y‐axis the cumulative probability of each ranking.We estimate the SUrface underneath this Cumulative RAnking line (SUCRA); the larger the SUCRA the higher its rank among all available agents.
14
14
Network Diagram for severe maternal morbidity: intensive care admissions. The nodes represent an intervention and their size is proportional to the number of trials comparing this intervention to any other in the network. The lines connecting each pair of interventions represent a direct comparison and are drawn proportional to the number of trials making each direct comparison. Numbers on the lines represent the number of trials for each comparison. [VL] very low‐certainty evidence; [L] low‐certainty evidence. Multi‐arm trials contribute to more than one comparison.
15
15
Forest plot with relative risk ratios and 95% CIs from pairwise, indirect and network (combining direct and indirect) analyses for prevention of severe maternal morbidity: intensive care admissions.
16
16
Cumulative rankograms comparing each of the uterotonic agents for prevention of severe maternal morbidity: intensive care admissions. Ranking indicates the cumulative probability of being the best agent, the second best, the third best, etc. The x axis shows the relative ranking and the y‐axis the cumulative probability of each ranking. We estimate the SUrface underneath this Cumulative RAnking line (SUCRA); the larger the SUCRA the higher its rank among all available agents.
17
17
Network Diagram for additional uterotonics. The nodes represent an intervention and their size is proportional to the number of trials comparing this intervention to any other in the network. The lines connecting each pair of interventions represent a direct comparison and are drawn proportional to the number of trials making each direct comparison. Numbers on the lines represent the number of trials for each comparison. [VL] very low‐certainty evidence; [L] low‐certainty evidence; [M] moderate‐certainty evidence. Multi‐arm trials contribute to more than one comparison.
18
18
Forest plot with relative risk ratios and 95% CIs from pairwise, indirect and network (combining direct and indirect) analyses for additional uterotonics.
19
19
Cumulative rankograms comparing each of the uterotonic agents for additional uterotonics. Ranking indicates the cumulative probability of being the best agent, the second best, the third best, etc. The x axis shows the relative ranking and the y‐axis the cumulative probability of each ranking.We estimate the SUrface underneath this Cumulative RAnking line (SUCRA); the larger the SUCRA the higher its rank among all available agents.
20
20
Network Diagram for blood transfusion. The nodes represent an intervention and their size is proportional to the number of trials comparing this intervention to any other in the network. The lines connecting each pair of interventions represent a direct comparison and are drawn proportional to the number of trials making each direct comparison. Numbers on the lines represent the number of trials for each comparison. [VL] very low‐certainty evidence; [L] low‐certainty evidence; [M] moderate‐certainty evidence. Multi‐arm trials contribute to more than one comparison.
21
21
Forest plot with relative risk ratios and 95% CIs from pairwise, indirect and network (combining direct and indirect) analyses for blood transfusion.
22
22
Cumulative rankograms comparing each of the uterotonic agents for blood transfusion. Ranking indicates the cumulative probability of being the best agent, the second best, the third best, etc. The x axis shows the relative ranking and the y‐axis the cumulative probability of each ranking.We estimate the SUrface underneath this Cumulative RAnking line (SUCRA); the larger the SUCRA the higher its rank among all available agents.
23
23
Network Diagram for mean blood loss (mL). The nodes represent an intervention and their size is proportional to the number of trials comparing this intervention to any other in the network. The lines connecting each pair of interventions represent a direct comparison and are drawn proportional to the number of trials making each direct comparison. Numbers on the lines represent the number of trials for each comparison. [VL] very low‐certainty evidence; [L] low‐certainty evidence; [M] moderate‐certainty evidence. Multi‐arm trials contribute to more than one comparison.
24
24
Forest plot with relative risk ratios and 95% CIs from pairwise, indirect and network (combining direct and indirect) analyses for mean blood loss (mL).
25
25
Cumulative rankograms comparing each of the uterotonic agents for mean blood loss (mL). Ranking indicates the cumulative probability of being the best, the second best, the third best, etc. The x axis shows the relative ranking and the y‐axis the cumulative probability of each ranking.We estimate the SUrface underneath this Cumulative RAnking line (SUCRA); the larger the SUCRA the higher its rank among all available agents.
26
26
Network Diagram for change in haemoglobin measurements before and after birth (g/L). The nodes represent an intervention and their size is proportional to the number of trials comparing this intervention to any other in the network. The lines connecting each pair of interventions represent a direct comparison and are drawn proportional to the number of trials making each direct comparison. Numbers on the lines represent the number of trials for each comparison. [VL] very low‐certainty evidence; [L] low‐certainty evidence; [M] moderate‐certainty evidence. Multi‐arm trials contribute to more than one comparison.
27
27
Forest plot with relative risk ratios and 95% CIs from pairwise, indirect and network (combining direct and indirect) analyses for change in haemoglobin measurements before and after birth (g/L).
28
28
Cumulative rankograms comparing each of the uterotonic s for change in haemoglobin measurements before and after birth (g/L). Ranking indicates the cumulative probability of being the best, the second best, the third best, etc. The x axis shows the relative ranking and the y‐axis the cumulative probability of each ranking.We estimate the SUrface underneath this Cumulative RAnking line (SUCRA); the larger the SUCRA the higher its rank among all available agents.
29
29
Network Diagram for breastfeeding at discharge. The nodes represent an intervention and their size is proportional to the number of trials comparing this intervention to any other in the network. The lines connecting each pair of interventions represent a direct comparison and are drawn proportional to the number of trials making each direct comparison. Numbers on the lines represent the number of trials for each comparison. [VL] very low‐certainty evidence; [L] low‐certainty evidence; [M] moderate‐certainty evidence. Multi‐arm trials contribute to more than one comparison.
30
30
Forest plot with relative risk ratios and 95% CIs from pairwise, indirect and network (combining direct and indirect) analyses for breastfeeding at discharge.
31
31
Cumulative rankograms comparing each of the uterotonic agents for breastfeeding at discharge. Ranking indicates the cumulative probability of being the best agent, the second best, the third best, etc. The x axis shows the relative ranking and the y‐axis the cumulative probability of each ranking.We estimate the SUrface underneath this Cumulative RAnking line (SUCRA); the larger the SUCRA the higher its rank among all available agents.
32
32
Network Diagram for nausea. The nodes represent an intervention and their size is proportional to the number of trials comparing this intervention to any other in the network. The lines connecting each pair of interventions represent a direct comparison and are drawn proportional to the number of trials making each direct comparison. Numbers on the lines represent the number of trials for each comparison. [VL] very low‐certainty evidence; [L] low‐certainty evidence; [M] moderate‐certainty evidence. Multi‐arm trials contribute to more than one comparison.
33
33
Forest plot with relative risk ratios and 95% CIs from pairwise, indirect and network (combining direct and indirect) analyses for nausea.
34
34
Cumulative rankograms comparing each of the uterotonic agents for nausea. Ranking indicates the cumulative probability of being the best agent, the second best, the third best, etc. The x axis shows the relative ranking and the y‐axis the cumulative probability of each ranking.We estimate the SUrface underneath this Cumulative RAnking line (SUCRA); the larger the SUCRA the higher its rank among all available agents.
35
35
Network Diagram for vomiting. The nodes represent an intervention and their size is proportional to the number of trials comparing this intervention to any other in the network. The lines connecting each pair of interventions represent a direct comparison and are drawn proportional to the number of trials making each direct comparison. Numbers on the lines represent the number of trials for each comparison. [VL] very low‐certainty evidence; [M] moderate‐certainty evidence. Multi‐arm trials contribute to more than one comparison.
36
36
Forest plot with relative risk ratios and 95% CIs from pairwise, indirect and network (combining direct and indirect) analyses for vomiting.
37
37
Cumulative rankograms comparing each of the uterotonic agents for vomiting. Ranking indicates the cumulative probability of being the best agent, the second best, the third best, etc. The x axis shows the relative ranking and the y‐axis the cumulative probability of each ranking.We estimate the SUrface underneath this Cumulative RAnking line (SUCRA); the larger the SUCRA the higher its rank among all available agents.
38
38
Network Diagram for hypertension. The nodes represent an intervention and their size is proportional to the number of trials comparing this intervention to any other in the network. The lines connecting each pair of interventions represent a direct comparison and are drawn proportional to the number of trials making each direct comparison. Numbers on the lines represent the number of trials for each comparison. [VL] very low‐certainty evidence; [M] moderate‐certainty evidence. Multi‐arm trials contribute to more than one comparison.
39
39
Forest plot with relative risk ratios and 95% CIs from pairwise, indirect and network (combining direct and indirect) analyses for hypertension.
40
40
Cumulative rankograms comparing each of the uterotonic agents for hypertension. Ranking indicates the cumulative probability of being the best agent, the second best, the third best, etc. The x axis shows the relative ranking and the y‐axis the cumulative probability of each ranking.We estimate the SUrface underneath this Cumulative RAnking line (SUCRA); the larger the SUCRA the higher its rank among all available agents.
41
41
Network Diagram for headache. The nodes represent an intervention and their size is proportional to the number of trials comparing this intervention to any other in the network. The lines connecting each pair of interventions represent a direct comparison and are drawn proportional to the number of trials making each direct comparison. Numbers on the lines represent the number of trials for each comparison. [VL] very low‐certainty evidence; [L] low‐certainty evidence; [M] moderate‐certainty evidence. Multi‐arm trials contribute to more than one comparison.
42
42
Forest plot with relative risk ratios and 95% CIs from pairwise, indirect and network (combining direct and indirect) analyses for headache.
43
43
Cumulative rankograms comparing each of the uterotonic agents for headache. Ranking indicates the cumulative probability of being the best agent, the second best, the third best, etc. The x axis shows the relative ranking and the y‐axis the cumulative probability of each ranking.We estimate the SUrface underneath this Cumulative RAnking line (SUCRA); the larger the SUCRA the higher its rank among all available agents.
44
44
Network Diagram for fever. The nodes represent an intervention and their size is proportional to the number of trials comparing this intervention to any other in the network. The lines connecting each pair of interventions represent a direct comparison and are drawn proportional to the number of trials making each direct comparison. Numbers on the lines represent the number of trials for each comparison. [VL] very low‐certainty evidence; [L] low‐certainty evidence; [M] moderate‐certainty evidence. Multi‐arm trials contribute to more than one comparison.
45
45
Forest plot with relative risk ratios and 95% CIs from pairwise, indirect and network (combining direct and indirect) analyses for fever.
46
46
Cumulative rankograms comparing each of the uterotonic agents for fever. Ranking indicates the cumulative probability of being the best agent, the second best, the third best, etc. The x axis shows the relative ranking and the y‐axis the cumulative probability of each ranking.We estimate the SUrface underneath this Cumulative RAnking line (SUCRA); the larger the SUCRA the higher its rank among all available agents.
47
47
Network Diagram for shivering. The nodes represent an intervention and their size is proportional to the number of trials comparing this intervention to any other in the network. The lines connecting each pair of interventions represent a direct comparison and are drawn proportional to the number of trials making each direct comparison. Numbers on the lines represent the number of trials for each comparison. [VL] very low‐certainty evidence; [L] low‐certainty evidence; [M] moderate‐certainty evidence. Multi‐arm trials contribute to more than one comparison.
48
48
Forest plot with relative risk ratios and 95% CIs from pairwise, indirect and network (combining direct and indirect) analyses for shivering.
49
49
Cumulative rankograms comparing each of the uterotonic agents for shivering. Ranking indicates the cumulative probability of being the best agent, the second best, the third best, etc. The x axis shows the relative ranking and the y‐axis the cumulative probability of each ranking.We estimate the SUrface underneath this Cumulative RAnking line (SUCRA); the larger the SUCRA the higher its rank among all available agents.
50
50
Network Diagram for abdominal pain. The nodes represent an intervention and their size is proportional to the number of trials comparing this intervention to any other in the network. The lines connecting each pair of interventions represent a direct comparison and are drawn proportional to the number of trials making each direct comparison. Numbers on the lines represent the number of trials for each comparison. [VL] very low‐certainty evidence; [L] low‐certainty evidence; [M] moderate‐certainty evidence. Multi‐arm trials contribute to more than one comparison.
51
51
Forest plot with relative risk ratios and 95% CIs from pairwise, indirect and network (combining direct and indirect) analyses for abdominal pain.
52
52
Cumulative rankograms comparing each of the uterotonic agents for abdominal pain. Ranking indicates the cumulative probability of being the best agent, the second best, the third best, etc. The x axis shows the relative ranking and the y‐axis the cumulative probability of each ranking.We estimate the SUrface underneath this Cumulative RAnking line (SUCRA); the larger the SUCRA the higher its rank among all available agents.
53
53
Network Diagram for diarrhoea. The nodes represent an intervention and their size is proportional to the number of trials comparing this intervention to any other in the network. The lines connecting each pair of interventions represent a direct comparison and are drawn proportional to the number of trials making each direct comparison. Numbers on the lines represent the number of trials for each comparison. [VL] very low‐certainty evidence; [L] low‐certainty evidence; [M] moderate‐certainty evidence. Multi‐arm trials contribute to more than one comparison.
54
54
Forest plot with relative risk ratios and 95% CIs from pairwise, indirect and network (combining direct and indirect) analyses for diarrhoea.

Update of

Similar articles

References

    1. Say L, Chou D, Gemmill A, Tunçalp O, Moller A, Daniels J, et al. Global causes of maternal death: a WHO systematic analysis. Lancet Global Health 2014;2(6):e323-e333. - PubMed
    1. Cresswell J. Trends in Maternal Mortality 2000 to 2020 : Estimates by WHO, UNICEF, UNFPA, World Bank Group and UNDESA/Population Division. WHO, 2023.
    1. Penney G, Brace V. Near miss audit in obstetrics. Current Opinion in Obstetrics & Gynecology 2007;19:145-50. - PubMed
    1. Souza JP, Gülmezoglu AM, Vogel J, Carroli G, Lumbiganon P, Qureshi Z, et al. Moving beyond essential interventions for reduction of maternal mortality (the WHO Multicountry Survey on Maternal and Newborn Health): a cross-sectional study. Lancet 2013;381:1747-55. - PubMed
    1. WHO. WHO Recommendations: Uterotonics for the Prevention of Postpartum Haemorrhage. Geneva: Department of Reproductive Health, World Health Organization, 2018. - PubMed

Publication types

MeSH terms

LinkOut - more resources