. 2025 Dec;16(1):2493221.
doi: 10.1080/21505594.2025.2493221. Epub 2025 May 8.

Interplay of Mycobacterium abscessus and Pseudomonas aeruginosa in experimental models of coinfection: Biofilm dynamics and host immune response

Affiliations

Interplay of Mycobacterium abscessus and Pseudomonas aeruginosa in experimental models of coinfection: Biofilm dynamics and host immune response

Víctor Campo-Pérez et al. Virulence. 2025 Dec.

Abstract

The incidence of infection by nontuberculous mycobacteria, mainly Mycobacterium abscessus, is increasing in patients with cystic fibrosis and other chronic pulmonary diseases, leading to an accelerated lung function decline. In most cases, M. abscessus coinfects Pseudomonas aeruginosa, the most common pathogen in these conditions. However, how these two bacterial species interact during infection remains poorly understood. This study explored their behaviour in three relevant pathogenic settings: dual-species biofilm development using a recently developed method to monitor individual species in dual-species biofilms, coinfection in bronchial epithelial cells, and in vivo coinfection in the Galleria mellonella model. The results demonstrated that both species form stable mixed biofilms and reciprocally inhibit single-biofilm progression. Coinfections in bronchial epithelial cells significantly decreased cell viability, whereas in G. mellonella, coinfections induced lower survival rates than individual infections. Analysis of the immune response triggered by each bacterium in bronchial epithelial cell assays and G. mellonella larvae revealed that P. aeruginosa induces the overexpression of proinflammatory and melanization cascade responses, respectively. In contrast, M. abscessus and P. aeruginosa coinfection significantly inhibited the immune response in both models, resulting in worse consequences for the host than those generated by a single P. aeruginosa infection. Overall, this study highlights the novel role of M. abscessus in suppressing immune responses during coinfection with P. aeruginosa, emphasizing the clinical implications for the management of cystic fibrosis and other pulmonary diseases. Understanding these interactions could inform the development of new therapeutic strategies to mitigate the severity of coinfections in vulnerable patients.

Keywords: Dual-species biofilm; Galleria mellonella; immunosuppression; nontuberculous mycobacteria; pulmonary epithelia.


Conflict of interest statement

No potential conflict of interest was reported by the author(s).

Figures

Figure 1.
Figure 1.
Coculture of P. aeruginosa PAO1 and PAET1 biofilms with different bacteria. (a) Growth of well-developed mature P. aeruginosa biofilm when different bacterial cultures (live and heat-killed) or bacterial culture supernatants were added. (b) Growth of P. aeruginosa in coculture biofilms. In both a) and b) the values correspond to the luciferase expression (lux) of the P. aeruginosa strains generated in each condition, normalized based on the average expression reported in control wells (marked with a dashed line as 100% P. aeruginosa growth). The effects of M. abscessus R (rough) and S (smooth) morphotypes, E. coli MG1655 and B. thuringiensis (104 /105 CFUs/well) on both P. aeruginosa strains were tested as well as the supernatant (SN) and heat-killed (HK) form of these bacterial cultures. Data are presented as the mean values ± SDs of at least three independent experiments including six replicates in each experimental condition; significant differences were determined using one-way ANOVA and Tukey’s multiple comparisons tests; ****, p < 0.0001; ***, p < 0.001; *, p < 0.05. Comparison of cocultures with individual PAO1/PAET1 biofilms: ####, p < 0.0001; ###, p < 0.001; ##, p < 0.01; #, p < 0.05. (c) Representative confocal microscopy images of coculture biofilms and pixel color quantification of the images. P. aeruginosa PAO1 and PAET1 biofilms were grown for 72 h, and M. abscessus R and S were inoculated for an additional 24 h. Z-stack compositions of 96 h-old P. aeruginosa PAO1 and PAET1 biofilms in combination with M. abscessus R and S morphotypes. DAPI stained all cells blue, and green fluorescent protein (GFP) of plasmid pETS218 allowed mycobacterial cells to be detected in green. Scale bars correspond to 20 µm. Pixel quantifications are represented as the mean values ± SDs from three representative images of each condition.
Figure 2.
Figure 2.
Effect of the P. aeruginosa PAO1 and PAET1 strains on M. abscessus R (rough) and S (smooth) biofilm development. (a) Graph represents the inhibition of M. abscessus biofilms when cocultured for 72 h with P. aeruginosa by measuring green fluorescent protein (GFP) expression. The control corresponds to 100% of single M. abscessus biofilm growth by analyzing GFP expression (dotted line). Data are presented as the mean ± SD of three independent experiments including six replicates in each experimental condition, and significant differences were reported using the Mann‒Whitney t test, ****, p < 0.0001. Comparison of cocultures with individual M. abscessus biofilms: ####, p < 0.0001. (b) Confocal microscopy representative coculture biofilm images and pixel color quantification. Z-stack compositions of M. abscessus variant 120 h biofilms in combination with P. aeruginosa strains. DAPI (4′,6-diamidino-2-phenylindole) stained all cells blue, and GFP of plasmid pETS218 allowed mycobacterial cells to be detected in green. Scale bars correspond to 20 µm. Pixel quantifications are represented as the mean values ± SDs from three representative images of each condition.
Figure 3.
Figure 3.
Bronchial epithelial cell viability and proinflammatory cytokine production after P. aeruginosa PAO1/PAET1, M. abscessus R (rough)/S (smooth) and B. thuringiensis infections. (a) Viability of CFBE41o- and 16HBE14o- cell lines after bacterial infections. Presto blue cell viability assay results in which data are expressed with respect to uninfected wells (considered as 100% cell viability). Data are represented as the mean ± SD from three independent experiments. Significance was analyzed using one-way ANOVA and Tukey’s multiple comparisons test. *, p < 0.05; **, p < 0.01; ***, p < 0.001; ****, p < 0.0001. Comparison of cocultures with individual PAO1/PAET1 infections: ##, p < 0.01; ###, p < 0.001. (b) Interleukins 6 and 8 (IL-6 and IL-8) production detected in culture supernatants from bronchial epithelial cell infections. Statistical differences were determined using one-way ANOVA and Dunnett’s test, which compares each column with the control (uninfected cells). Data are represented as the mean ± SD from three independent experiments; *, p < 0.05; **, p < 0.01; ***, p < 0.001; ****, p < 0.0001. Comparison of results obtained in PAO1/PAET1 individually infected cells with coinfections were determined using one-way ANOVA, Dunnett’s test comparisons test: ns, non-significant; ##, p < 0.01; ###, p < 0.001; ####, p < 0.0001.
Figure 4.
Figure 4.
B. thuringiensis and M. abscessus coinfecting with P. aeruginosa in G. mellonella Kaplan – Meier survival curves. Thirty larvae (n = 30) of each condition were monitored from 12 h post-infection every 2 hours to verify their survival rates when M. abscessus rough (R) and smooth (S) morphotypes (104 CFU/larva) or B. thuringiensis (105 CFU/larva) was coinfected with P. aeruginosa PAO1 and PAET1 at different concentrations. Phosphate buffered saline (PBS) was used as safe survival control. Data were analyzed by comparing the curves of individual P. aeruginosa infections with coinfection of M. abscessus plus P. aeruginosa at the same concentration using the Mantel‒Cox survival test; *, p < 0.05; **, p < 0.005.
Figure 5.
Figure 5.
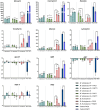
Expression of G. mellonella immune-relevant genes under different infection conditions. The fold changes indicate the number of times above or below the gene expression compared with the control (larvae infected with PBS) obtained by RT‒PCR analysis. Data are presented as the mean ± SD of the fold changes for each condition. Significant differences of individual B. thuringiensis and M. abscessus (R/S) infection vs coinfections were established using one-way ANOVA Tukey’s multiple comparisons test. *, p < 0.05; **, p < 0.01; **, p < 0.001; ****, p < 0.0001. Significant differences of individual P. aeruginosa (PAO1/PAET1) vs coinfections were established using one-way ANOVA Tukey’s multiple comparisons test. #, p < 0.05; ##, p < 0.01; ###, p < 0.001; ####, p < 0.0001. Apo III: Apolipophorin III, IMPI: insect metalloproteinase inhibitor, GST: glutathione S-transferase, NOX 4: NADPH oxidase, NOS: nitric oxide synthase.

References

    1. O’Sullivan BP, Freedman SD.. Cystic fibrosis. Lancet. 2009;373(9678):1891–20. doi: 10.1016/S0140-6736(09)60327-5 - DOI - PubMed
    1. Linsdell P. Cystic fibrosis transmembrane conductance regulator (CFTR): making an ion channel out of an active transporter structure. Channels (Austin). 2018;12(1):284–290. doi: 10.1080/19336950.2018.1502585 - DOI - PMC - PubMed
    1. Kreda SM, Davis CW, Rose MCC. Mucins, and mucus obstruction in cystic fibrosis. Cold Spring Harb Perspect Med. 2012;2(9):a009589–a009589. doi: 10.1101/CSHPERSPECT.A009589 - DOI - PMC - PubMed
    1. Bustamante-Marin XM, Ostrowski LE. Cilia and mucociliary clearance. Cold Spring Harb Perspect Biol. 2017;9(4):a028241. doi: 10.1101/CSHPERSPECT.A028241 - DOI - PMC - PubMed
    1. Coutinho H, Falcão-Silva VS, Gonçalves G. Pulmonary bacterial pathogens in cystic fibrosis patients and antibiotic therapy: a tool for the health workers. Int Arch Med. 2008;1(1):24. doi: 10.1186/1755-7682-1-24 - DOI - PMC - PubMed

Publication types

MeSH terms