. 2025 Apr 16;16(1):536.
doi: 10.1007/s12672-025-02148-4.

Use of consensus clustering to identify subtypes of clinical early-stage non-small cell lung cancer and its association with lymph node metastasis

Affiliations

Use of consensus clustering to identify subtypes of clinical early-stage non-small cell lung cancer and its association with lymph node metastasis

Yi Qin et al. Discov Oncol. .

Abstract

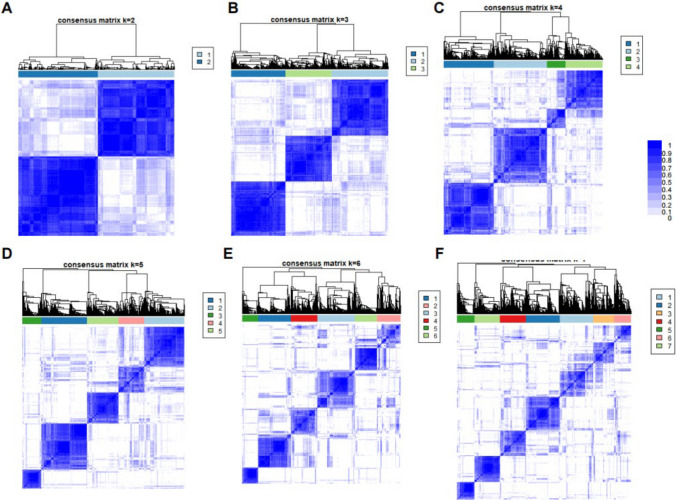
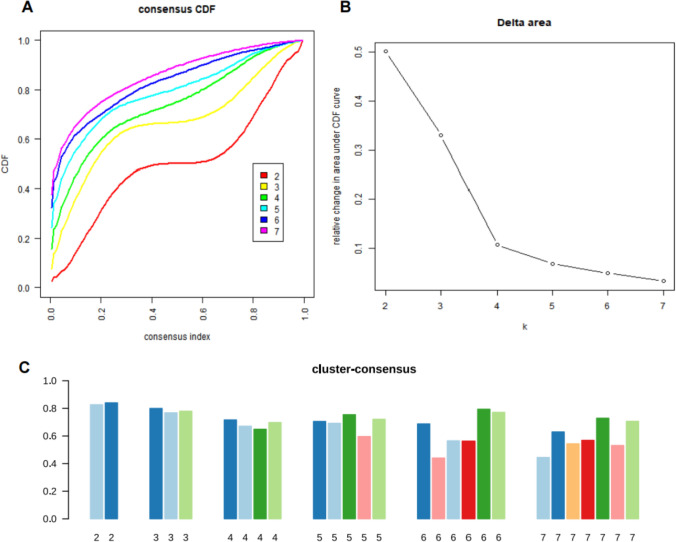
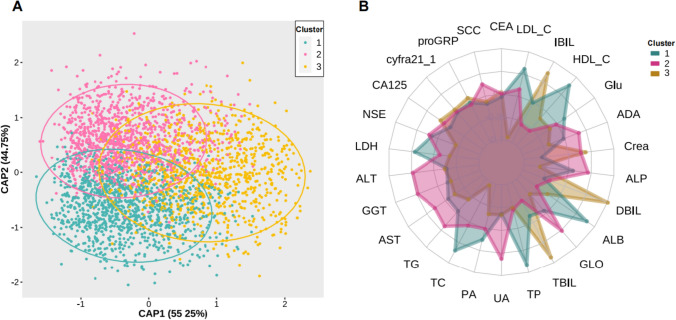
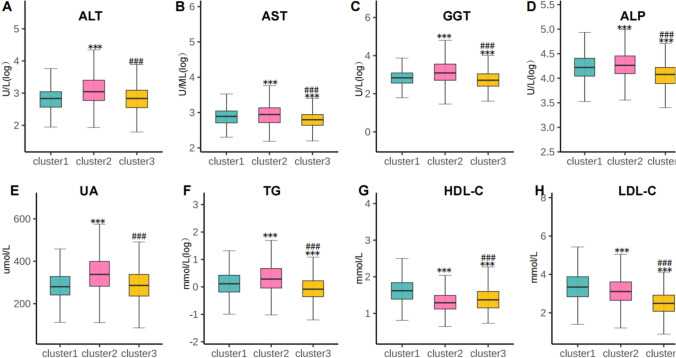
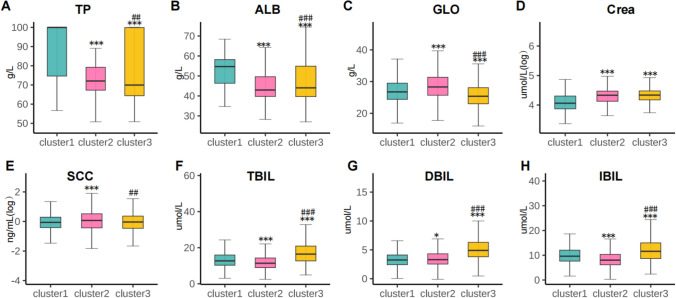
Limited studies have investigated the metabolic heterogeneity of patients with clinical early-stage non-small cell lung cancer (NSCLC). Consensus clustering analysis has the potential to reveal distinct metabolic subgroups within clinical early-stage NSCLC patients. A total of 3324 clinical early-stage NSCLC patients who underwent surgery were included in this comprehensive evaluation. The evaluation encompassed 26 serum assessments related to metabolism and histopathological examination of the lymph nodes. By utilizing consensus clustering analysis, three clusters were identified based on various measurements, including blood glucose levels, blood uric acid, blood lipids, renal and liver function, and tumor markers. The differences in characteristics and lymph node metastasis (LNM) prevalence between the clusters were investigated and compared. The patients were classified into three distinct clusters that exhibited different patterns defined by the highest or lowest levels of metabolic feature variables. NSCLC cluster 1 had the lowest rates of LNM, while cluster 3 showed a significantly higher prevalence of LNM (1.6-fold increase, 95% CI: 1.21, 2.13) compared to cluster 1. Moreover, cluster 2 had the highest odds ratio (OR) of 1.78 (95% CI: 1.37, 2.33) for LNM prevalence. In subsequent sensitivity analysis, metabolic heterogeneity was observed among patients with a tumor measuring less than 2 cm in the long axis, along with similar differences in the prevalence of lymph node metastasis. This present study successfully categorized clinical early-stage NSCLC into three distinct subgroups, each with unique characteristics that reflect metabolic heterogeneity and significant disparities in the prevalence of LNM. Such an approach holds potential implications for clinical early-stage interventions targeting risk factors.

Keywords: Consensus clustering analysis; LNM; Metabolic heterogeneity; NSCLC.


Conflict of interest statement

Declarations. Ethics approval and consent to participate: This study was approved by the ethics committee of the Affiliated Hospital of Qingdao University. Informed consent was obtained from all patients, and the reported investigations were carried out in accordance with the principles of the Declaration of Helsinki as revised in 2008. Competing interests: The authors declare no competing interests.

Figures

Fig. 1
Fig. 1
Consensus matrix heatmaps using serum metabolic-related measurements. A K = 2. B K = 3. C K = 4. D K = 5. E K = 6. F K = 7. The consensus matrix heat maps of K = 2 to K = 7 using 26 serum metabolic-related measurements, including glucose, uric acid, triglycerides, total cholesterol, high-density lipoprotein cholesterol, low-density lipoprotein cholesterol, creatinine, adenosine deaminase, lactate dehydrogenase, alanine aminotransferase, aspartate aminotransferase, gamma-glutamyl-transferase, alkaline phosphatase, prealbumin, globulin, albumin, total protein, total bilirubin level, direct bilirubin, indirect bilirubin, carcinoembryonic antigen, cancer antigen, squamous cell carcinoma antigen, progastrin-releasing peptide, the soluble fragment of cytokeratin 19, neuron-specific enolase. (n = 3324). The blue color represents perfect consensus where two individuals always group together, the white color represents perfect consensus where two individuals always group separately, and the blue color scales in between represent ambiguous consensus where two individuals are grouped together in some runs but separately in others
Fig. 2
Fig. 2
Consensus cumulative distribution function and cluster consensus score. A The lines by colors indicate the cumulative distribution functions (CDF) of the consensus matrix for each K, determined by a histogram of 100 bins. If the CDF reaches an approximate maximum, consensus and cluster confidence are at a maximum at this K B The relative change in area under the CDF curve estimated by comparing K and K − 1. For K = 2, there is no K − 1, so the total area under the curve rather than the relative increase is plotted. The relative increases in consensus are used to determine K at which there is an appreciable increase. C The bar plot denotes the mean consensus score for different numbers of clusters (K ranges from two to seven) on the basis of 100 repeated re-samplings of 80% of the 3324 patients with clinical early-stage NSCLC. The bars are grouped by K, which is marked on the horizontal axis. For K = 3, the mean consensus score was 0.80 for cluster 1, 0.76 for cluster 2, 0.78 for cluster 3
Fig. 3
Fig. 3
The Difference of the three clusters. A Canonical analysis of principal coordinates analysis (CAP) plot based on Bray–Curtis distance of the serum metabolic-related measurements among the three clusters. B Distribution of the cluster feature variables by clusters.All the values of cluster features were centered to a mean value of 0 and an SD of 1. Glu, glucose; UA, uric acid; TG, triglycerides; TC, total cholesterol; HDL-C, high-density lipoprotein cholesterol; LDL-C, low-density lipoprotein cholesterol; Crea, creatinine; ADA, adenosine deaminase; LDH, lactate dehydrogenase; ALT, alanine aminotransferase; AST, aspartate aminotransferase; GGT, gamma-glutamyl-transferase; ALP, alkaline phosphatase; PA, prealbumin; GLO, globulin; ALB, albumin; TP,total protein; TBIL, total bilirubin level; DBIL, direct bilirubin; IBIL, indirect bilirubin; CEA, carcinoembryonic antigen; CA125, cancer antigen 125; SCC, squamous cell carcinoma antigen; proGRP, progastrin-releasing peptide;cyfra21-1, the soluble fragment of cytokeratin 19; NSE, neuron-specific enolase
Fig. 4
Fig. 4
The differences of the cluster feature variables between clusters. Distributions of A Alanine aminotransferase (ALT), B Aspartate aminotransferase (AST), C Gamma-glutamyl-transferase (GGT), D Alkaline phosphatase (ALP), E Uric acid (UA), F Triglycerides (TG), G High-density lipoprotein cholesterol (HDL-C), H Low-density lipoprotein cholesterol (LDL-C). ***, q < 0.001 relative to Cluster 1, ###, q < 0.001 relative to Cluster 2, The differences of the cluster feature variables between clusters were assessed by using Kruskal–Wallis (KW) tests, and the post hoc pairwise comparisons between cluster feature variables (within clusters) using Dunn’s method
Fig. 5
Fig. 5
The differences of the cluster feature variables between clusters. Distributions of A Total protein (TP), B Albumin (ALB), C Globulin (GLO), D 8 Creatinine (Crea), E Squamous cell carcinoma antigen (SCC), F Total bilirubin level (TBIL), G Direct bilirubin (DBIL), H Indirect bilirubin (IBIL).*,q < 0.05 and ***, q < 0.001 relative to Cluster 1, ###, q < 0.001 and ##, q < 0.01 relative to Cluster 2, The differences of the cluster feature variables between clusters were assessed by using Kruskal–Wallis (KW) tests, and the post hoc pairwise comparisons between cluster feature variables (within clusters) using Dunn’s method

Similar articles

References

    1. Sung H, Ferlay J, Siegel RL, Laversanne M, Soerjomataram I, Jemal A, Bray F. Global cancer statistics 2020: GLOBOCAN estimates of incidence and mortality worldwide for 36 cancers in 185 countries. CA Cancer J Clin. 2021;71(3):209–49. - PubMed
    1. Rami-Porta R, Nishimura KK, Giroux DJ, Detterbeck F, Cardillo G, Edwards JG, Fong KM, Giuliani M, Huang J, Kernstine KH Sr, et al. The international association for the study of lung cancer lung cancer staging project: proposals for revision of the TNM stage groups in the forthcoming (ninth) edition of the TNM classification for lung cancer. J Thorac Oncol. 2024;19(7):1007–27. - PubMed
    1. Dowling CM, Zhang H, Chonghaile TN, Wong KK. Shining a light on metabolic vulnerabilities in non-small cell lung cancer. Biochim Biophys Acta Rev Cancer. 2021;1875(1):188462. - PMC - PubMed
    1. Schuurbiers OC, Meijer TW, Kaanders JH, Looijen-Salamon MG, de Geus-Oei LF, van der Drift MA, van der Heijden EH, Oyen WJ, Visser EP, Span PN, et al. Glucose metabolism in NSCLC is histology-specific and diverges the prognostic potential of 18FDG-PET for adenocarcinoma and squamous cell carcinoma. J Thorac Oncol. 2014;9(10):1485–93. - PubMed
    1. Hensley CT, Faubert B, Yuan Q, Lev-Cohain N, Jin E, Kim J, Jiang L, Ko B, Skelton R, Loudat L, et al. Metabolic heterogeneity in human lung tumors. Cell. 2016;164(4):681–94. - PMC - PubMed

LinkOut - more resources