Meta-Analysis
. 2025 Apr 1;66(4):42.
doi: 10.1167/iovs.66.4.42.

Transcriptome Meta-Analysis Uncovers Cell-Specific Regulatory Relationships in Embryonic, Juvenile, Adult, and Aged Mouse Lens Epithelium and Fibers

Affiliations
Meta-Analysis

Transcriptome Meta-Analysis Uncovers Cell-Specific Regulatory Relationships in Embryonic, Juvenile, Adult, and Aged Mouse Lens Epithelium and Fibers

Matthieu Duot et al. Invest Ophthalmol Vis Sci. .

Abstract

Purpose: The lens transcriptome has been examined using microarrays and RNA-sequencing (RNA-seq). These omics data are the basis of the bioinformatics web-resource iSyTE that has identified new genes involved in lens development and cataract. The lens predominantly contains epithelial and fiber cells, and yet, presently, iSyTE is based on whole lens data. To gain cell-specific regulatory insights, we meta-analyzed isolated epithelium and fiber transcriptomes from embryonic/postnatal, adult and aged lenses.

Methods: Mouse lens epithelium and fiber transcriptome public datasets at embryonic (E) and postnatal (P) stages E12.5, E14.5, E16.5, E18.5, P0.5, P0, P5, P13, and age one month, three months, six months, and two years were analyzed. Microarray or RNA-seq data were analyzed by appropriate methods and compared to other resources (e.g., Cat-Map, CompBio).

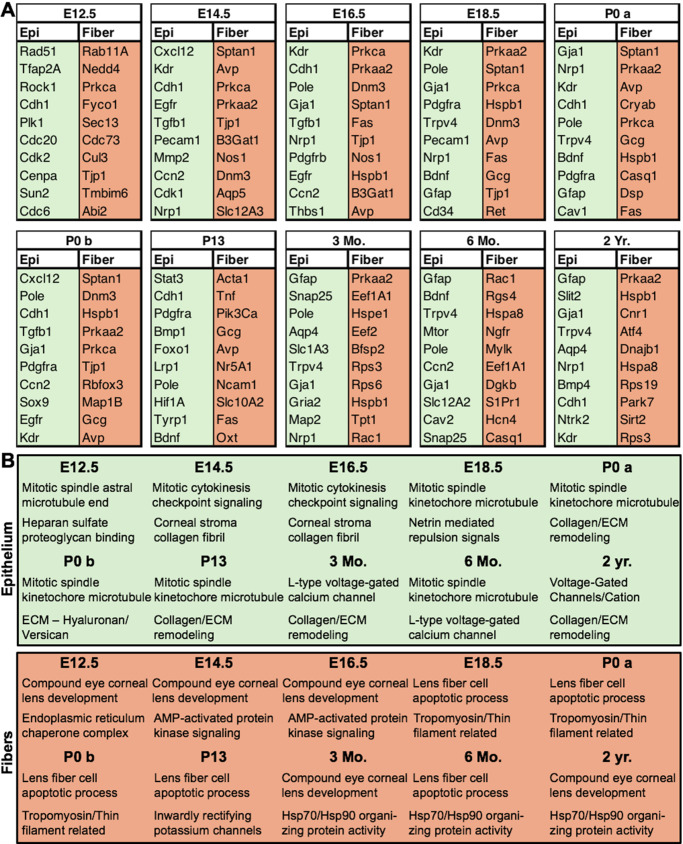
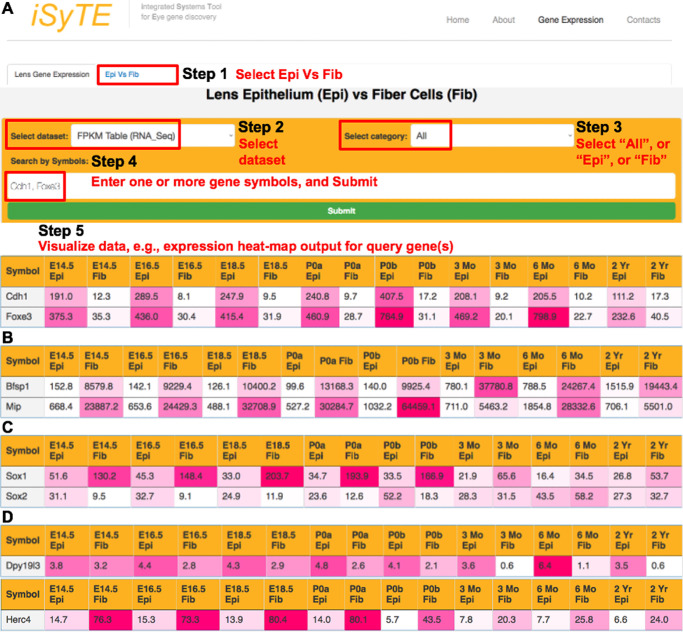
Results: Across all RNA-seq datasets examined, 2466 genes are differentially expressed between epithelium and fibers, of which 106 are cataract-linked. Gene ontology enrichment validates epithelial and fiber expression, corroborating the meta-analysis. Whole embryonic-body-in silico subtraction and other analyses identify several new high-priority epithelial- and/or fiber-enriched genes (e.g., Casz1, Ell2). Furthermore, new insights into cell-specific regulatory processes at distinct stages are identified (e.g., ribonucleoprotein regulation in E12.5 epithelium). Finally, this data is made accessible at iSyTE (https://research.bioinformatics.udel.edu/iSyTE/).

Conclusions: This spatiotemporal transcriptome meta-analysis comprehensively informs on epithelium- and fiber-specific regulatory processes in developing, adult and aged lenses. Notably, it includes the first description of an embryonic stage (i.e., E12.5) representing early primary fiber differentiation, thus informing on the initial transcriptome changes as lens cell-types are readily distinguishable.


Conflict of interest statement

Disclosure: M. Duot, None; S.Y. Coomson, None; S.K. Shrestha, None; M.V.M.K. Nagulla, None; Y. Audic, None; R.A. Barve, None; H. Huang, None; C. Gautier-Courteille, None; L. Paillard, None; S.A. Lachke, None

Figures

Figure 1.
Figure 1.
Experimental design for meta-analysis of isolated lens epithelium and fibers datasets. The flowchart outlines the experimental approach and pipeline for analysis of RNA-seq data from isolated mouse lens epithelium and fibers.
Figure 2.
Figure 2.
Meta-analysis of lens-isolated epithelium and fiber RNA-seq datasets. (A) RNA-seq meta-analysis identifies 2841 robustly expressed genes (log2CPM > 1, FDR < 0.05), which are differentially expressed between lens epithelium and fibers. Expression of significant genes (n = 2841) between lens epithelium and fibers across all the stages. This figure illustrates the distribution of the 2841 significantly DEGs between mouse lens epithelium and fiber cells across all developmental stages: (i) 1145 genes are consistently upregulated in epithelium, (ii) 1427 genes are consistently upregulated in fibers, (iii) 97 genes show dynamic differential expression between the two cell-types at different stages, and (iv) 172 genes did not meet the stringent fold-change threshold we set (i.e., they were differentially expressed to a lower extent), but these genes are still significant in terms of statistical power for differential expression. (B) Heat-map based on significant DEGs (n = 2841) in the lens epithelium or fibers across all developmental stages. P0a and P0b represent data from Cvekl and Robinson laboratories, respectively. (C) Examples of expression—across the different stages—of genes that are abundant in epithelium compared to fibers (e.g., Aqp1, Gja1), abundant in fibers compared to epithelium (e.g., Dnase2b, Gja3, Mip), initially abundant in epithelium and later in fibers (e.g., Gcnt2), initially abundant in fibers and later in epithelium (e.g., Gja8), and similarly abundant in epithelium and fibers (e.g., Yap1).
Figure 3.
Figure 3.
GO analysis of significant differentially expressed genes in isolated lens epithelium and fibers. (A) Top enriched GO terms for genes with higher expression (n = 1145) in lens epithelium. (B) Top enriched GO terms for 1427 genes with higher expression (n = 1427) in lens fibers.
Figure 4.
Figure 4.
Validation of meta-analysis by in situ hybridization. The gene expression predictions derived from the meta-analysis were independently validated through in situ hybridization. (A) In situ hybridization confirms the spatiotemporal expression of candidate genes as predicted by the meta-analysis. For instance, Igfp5 is expressed in the lens epithelium, Btg1 shows higher expression levels in the lens epithelium compared to lens fiber cells, Cpeb2 is more abundant in the transition zone and early differentiating fiber cells, Id2 is prominently expressed in the early differentiating fiber cells and Pgam2 is expressed in both lens epithelium and lens fiber cells. (B) Expression of these genes in epithelium or fibers based on RNA-seq meta-analysis at embryonic, adult and aged postnatal stages is shown. Intensity of heat-map indicates gene expression levels at different stages. e, epithelium; fc, fiber cells; tz, transition zone.
Figure 5.
Figure 5.
In silico-subtraction identifies genes with enriched-expression in isolated lens epithelium and fibers. In silico-subtraction allowed analysis of genes with respect to their enriched-expression compared to WB in lens-isolated epithelium and fibers (log2 fold-change (expression in lens cell-type/expression in WB) >1) across the different stages. (A) Heatmap representing enriched-expression of genes in both lens-isolated epithelium and fibers compared to WB across all the stages. (B) Isolated lens epithelium-specific enriched expression of genes calculated by negative delta values and indicated by heatmap color gradients (left column: maximum enrichment score in fibers, right column: maximum enrichment score in lens-isolated epithelium, delta values indicated by separate heat-map). (C) Isolated lens fiber-specific enriched expression of genes as denoted by positive delta values.
Figure 6.
Figure 6.
Analysis of microarray transcriptomic dataset of isolated-lens epithelium and fibers at E12.5 and P13. (A) Schematic of LCM of mouse lens epithelium and fibers at E12.5. Area marked by broken lines denote the tissue region that was isolated as epithelium (Epi) or fibers. (B) MA plot demonstrates relative expression of genes in lens-isolated epithelium (1618 higher in epi) versus fibers (1548 higher in fibers). (C) Gene ontology (GO) analysis for the 1618 genes elevated in E12.5 lens-isolated epithelium. (D) GO term analysis for the 1548 genes elevated in E12.5 lens-isolated fibers. (E) GO analysis for the 1532 genes elevated in P13 lens-isolated epithelium. (F) GO term analysis for the 1793 genes elevated in P13 lens-isolated fibers.
Figure 7.
Figure 7.
Comparative transcriptomic analysis of isolated epithelium, outer cortical fibers and inner cortical fibers from 1-month old mouse lens. (A) Schematic representation of lens outer cortical fibers (green) and inner cortical fibers (red) cell populations captured by of LCM from one-month-old mouse lenses in a study published from the Bassnett laboratory. The epithelium (asterisk) from the one-month old mouse lenses was isolated by manual dissection. (B) Heat-map of significant DEGs (n = 1422) between isolated epithelium, outer cortical fibers, and inner cortical fiber datasets. (C) Venn diagram shows 248 common genes between the three datasets. (D) Comparison of DEGs from the one-month-old lens isolated epithelium, outer cortical fibers, and inner cortical fibers datasets and the meta-analyzed RNA-seq data on isolated epithelium and fibers. The pie-charts inform on the respective proportions that data from the Bassnett study (e.g., the epithelium (i.e., “Bassnett Epithelium”), outer cortical fibers (i.e., Outer Fibers), inner cortical fibers (i.e., Inner Fibers) falls into, as per the meta-analyzed RNA-seq data on isolated epithelium and fibers (given in the inset key).
Figure 8.
Figure 8.
The bioinformatics tool CompBio identifies biological themes enriched in isolated lens epithelium and fibers. CompBio-derived map of distinct biological themes enriched for genes with higher expression in isolated lens epithelium or fibers at different stages, namely, embryonic day (E) 14.5, postnatal day (P) 0, three months, and two years. Note that P0 represents data from the Cvekl laboratory. Similar colors for related themes are shown across the different stages.
Figure 9.
Figure 9.
CompBio-based analysis of isolated lens epithelium and fibers using Normalized Enrichment Score (NEScore). The top ten enriched biological themes based on NEScore rank in isolated lens epithelium (Epi) and fibers at different stages, namely, embryonic day (E) 14.5, postnatal day (P) 0, three months, and two years. Note that P0 represents data from the Cvekl laboratory.
Figure 10.
Figure 10.
CompBio-based identification of key genes and central biological ideas in isolated lens epithelium and fibers across embryonic, postnatal, adult and aged stages. (A) The top 10 genes based on their contribution to the prediction of distinct themes in isolated lens epithelium and fibers at different stages, namely, embryonic day (E) 12.5, E14.5, E16.5, E18.5, postnatal day (P) 0a, P0b, P13, three months, six months, and two years. P0a and P0b represent data from Cvekl and Robinson laboratories, respectively. (B) Central ideas highlighting key biological processes in isolated lens epithelium and fibers at the different stages stated above.
Figure 11.
Figure 11.
Access of isolated lens epithelium and fiber gene expression in iSyTE. (A) The meta-analyzed data on isolated lens epithelium and fibers is made freely accessible in a new user-friendly web portal on the iSyTE webpage at http://research.bioinformatics.udel.edu/iSyTE. This provides effective visualization of single or multiple genes at the different stages by following Steps 1 through 5. Examples are provided of genes with higher expression as per the meta-analyzed RNA-seq-based FPKM data in the lens epithelium (Cdh1, Foxe3), (B) lens fibers (Bfsp2, Mip), (C) transcription factors with role in the lens (Sox2, Sox1), and (D) candidates linked to cataract from genetic association studies (Dpy19l3, Herc4).

Similar articles

References

    1. Anand D, Lachke SA.. Systems biology of lens development: a paradigm for disease gene discovery in the eye. Exp Eye Res. 2017; 156: 22–33. - PMC - PubMed
    1. Chauhan BK, Reed NA, Zhang W, Duncan MK, Kilimann MW, Cvekl A.. Identification of genes downstream of Pax6 in the mouse lens using cDNA microarrays. J Biol Chem. 2002; 277: 11539–11548. - PubMed
    1. Chauhan BK, Reed NA, Yang Y, et al. .. A comparative cDNA microarray analysis reveals a spectrum of genes regulated by Pax6 in mouse lens. Genes Cells. 2002; 7: 1267–1283. - PMC - PubMed
    1. Hawse JR, Hejtmancik JF, Huang Q, et al. .. Identification and functional clustering of global gene expression differences between human age-related cataract and clear lenses. Mol Vis. 2003; 9: 515–537. - PMC - PubMed
    1. Hawse JR, Hejtmancik JF, Horwitz J, Kantorow M.. Identification and functional clustering of global gene expression differences between age-related cataract and clear human lenses and aged human lenses. Exp Eye Res. 2004; 79: 935–940. - PMC - PubMed

Publication types