

Short-Term Effects of Extreme Heat, Cold, and Air Pollution Episodes on Excess Mortality in Luxembourg
- PMID: 40238412
- PMCID: PMC11941813
- DOI: 10.3390/ijerph22030376
Short-Term Effects of Extreme Heat, Cold, and Air Pollution Episodes on Excess Mortality in Luxembourg
Abstract
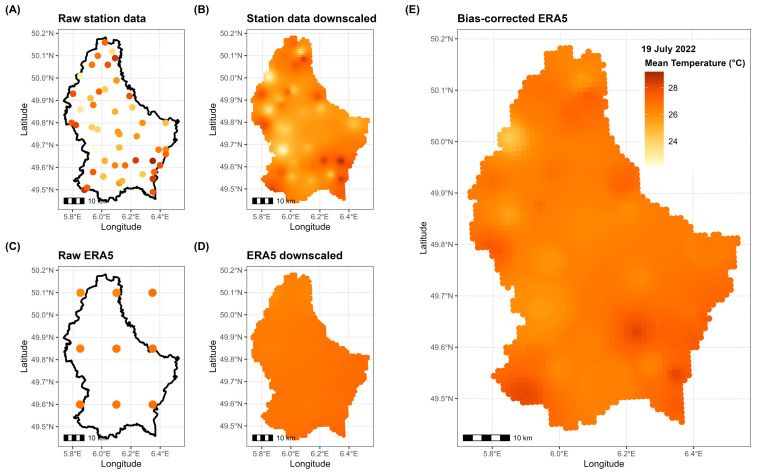
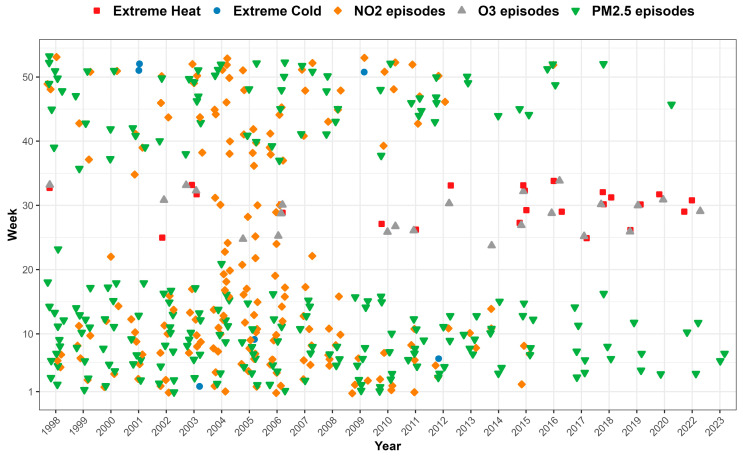
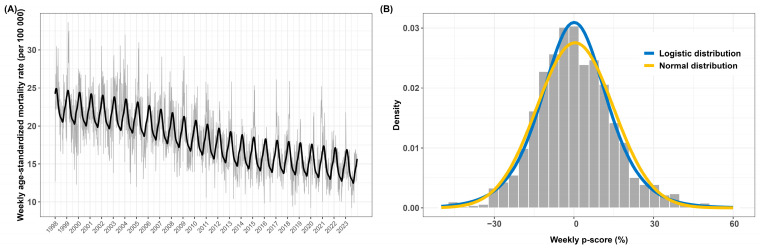
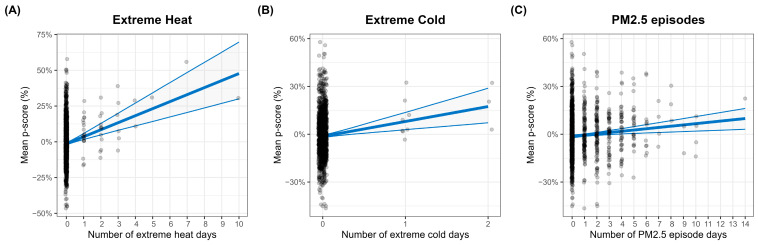
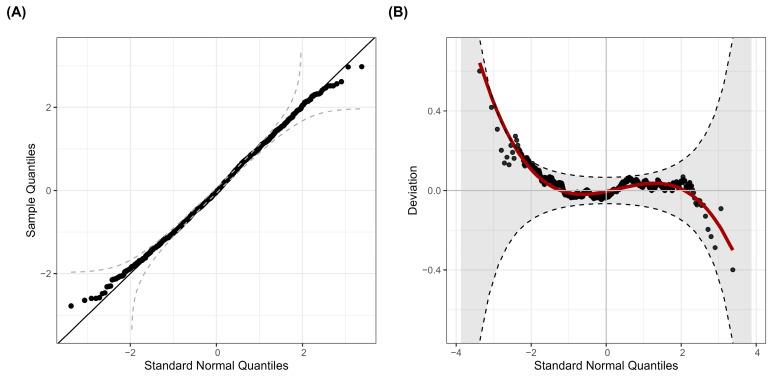
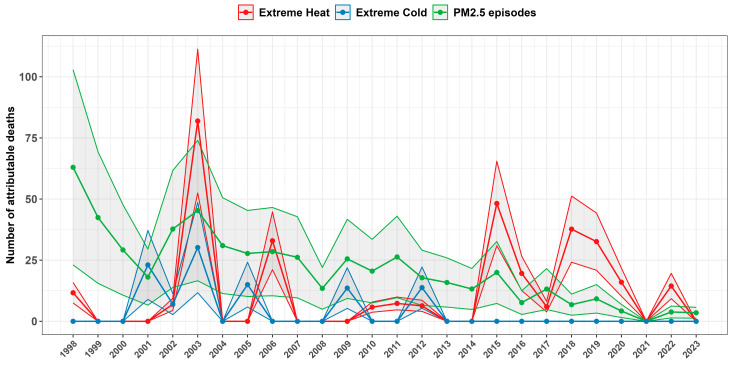
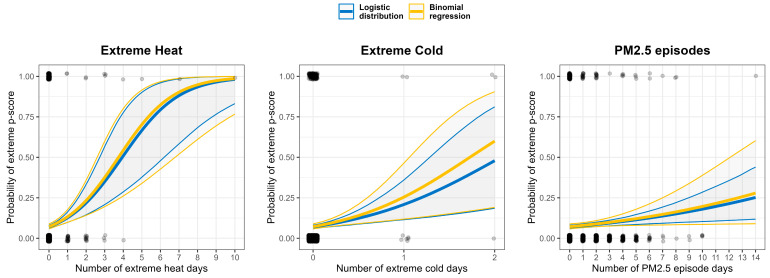
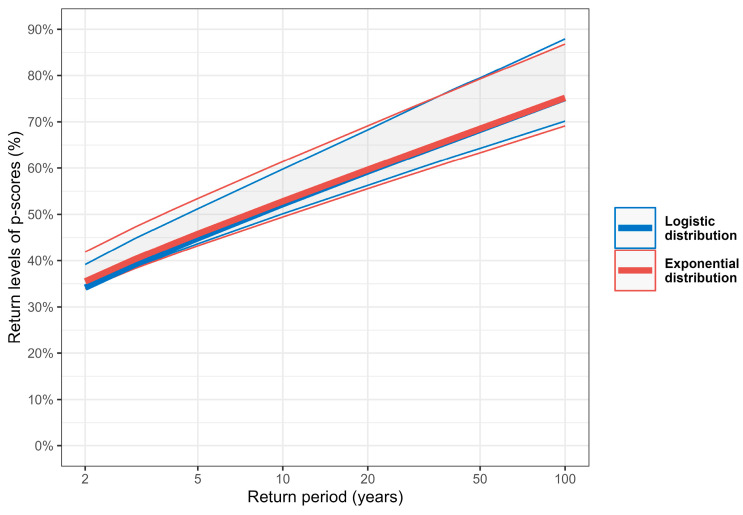
This study aims to assess the short-term effects of extreme heat, cold, and air pollution episodes on excess mortality from natural causes in Luxembourg over 1998-2023. Using a high-resolution dataset from downscaled and bias-corrected temperature (ERA5) and air pollutant concentrations (EMEP MSC-W), weekly mortality p-scores were linked to environmental episodes. A distributional regression approach using a logistic distribution was applied to model the influence of environmental risks, capturing both central trends and extreme values of excess mortality. Results indicate that extreme heat, cold, and fine particulate matter (PM2.5) episodes significantly drive excess mortality. The estimated attributable age-standardized mortality rates are 2.8 deaths per 100,000/year for extreme heat (95% CI: [1.8, 3.8]), 1.1 for extreme cold (95% CI: [0.4, 1.8]), and 6.3 for PM2.5 episodes (95% CI: [2.3, 10.3]). PM2.5-related deaths have declined over time due to the reduced frequency of pollution episodes. The odds of extreme excess mortality increase by 1.93 times (95% CI: [1.52, 2.66]) per extreme heat day, 3.49 times (95% CI: [1.77, 7.56]) per extreme cold day, and 1.11 times (95% CI: [1.04, 1.19]) per PM2.5 episode day. Indicators such as return levels and periods contextualize extreme mortality events, such as the p-scores observed during the 2003 heatwave and COVID-19 pandemic. These findings can guide public health emergency preparedness and underscore the potential of distributional modeling in assessing mortality risks associated with environmental exposures.
Keywords: attributable mortality; distributional regression; environmental risks; excess mortality; extreme events.
Conflict of interest statement
The author declares no conflicts of interest.
Figures
References
-
- Watts N., Amann M., Ayeb-Karlsson S., Belesova K., Bouley T., Boykoff M., Byass P., Cai W., Campbell-Lendrum D., Chambers J., et al. The Lancet Countdown on Health and Climate Change: From 25 Years of Inaction to a Global Transformation for Public Health. Lancet. 2018;391:581–630. doi: 10.1016/S0140-6736(17)32464-9. - DOI - PubMed
-
- Gasparrini A., Guo Y., Hashizume M., Lavigne E., Zanobetti A., Schwartz J., Tobias A., Tong S., Rocklöv J., Forsberg B., et al. Mortality Risk Attributable to High and Low Ambient Temperature: A Multicountry Observational Study. Lancet. 2015;386:369–375. doi: 10.1016/S0140-6736(14)62114-0. - DOI - PMC - PubMed
-
- Arsad F.S., Hod R., Ahmad N., Ismail R., Mohamed N., Baharom M., Osman Y., Radi M.F.M., Tangang F. The Impact of Heatwaves on Mortality and Morbidity and the Associated Vulnerability Factors: A Systematic Review. Int. J. Environ. Res. Public Health. 2022;19:16356. doi: 10.3390/ijerph192316356. - DOI - PMC - PubMed
MeSH terms
Substances
LinkOut - more resources
Full Text Sources
Medical
