. 2025 Apr 18;11(16):eads1532.
doi: 10.1126/sciadv.ads1532. Epub 2025 Apr 16.

Dietary methionine restriction started late in life promotes healthy aging in a sex-specific manner

Affiliations

Dietary methionine restriction started late in life promotes healthy aging in a sex-specific manner

Ulalume Hernández-Arciga et al. Sci Adv. .

Abstract

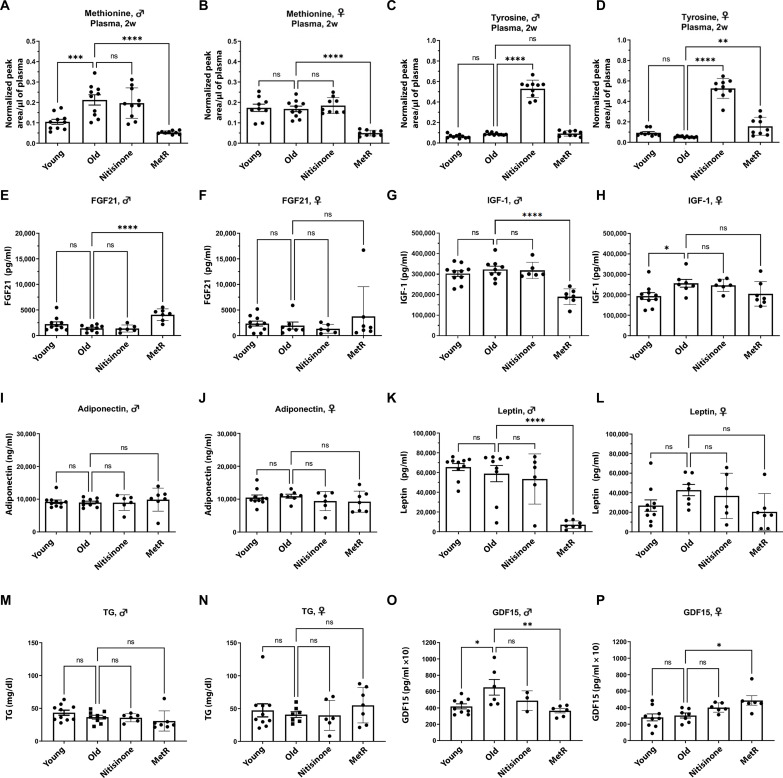
Aging is associated with dysregulated methionine metabolism and increased levels of enzymes in the tyrosine degradation pathway (TDP). To investigate the efficacy of targeting either methionine metabolism or the TDP for healthspan improvement in advanced age, we initiated dietary MetR or TDP inhibition in 18-month-old C57BL/6J mice. MetR significantly improved neuromuscular function, metabolic health, lung function, and frailty. In addition, we confirmed improved neuromuscular function from dietary MetR in 5XFAD mice, whose weight was not affected by MetR. We did not observe benefits with TDP inhibition. Single-nucleus RNA and ATAC sequencing of muscle revealed cell type-specific responses to MetR, although MetR did not significantly affect mouse aging epigenetic clock markers. Similarly, an 8-week MetR intervention in a human trial (NCT04701346) showed no significant impact on epigenetic clocks. The observed benefits from late-life MetR provide translational rationale to develop MetR mimetics as an antiaging intervention.


Figures

Fig. 1.
Fig. 1.. Dietary MetR significantly decreases weight with relative increase of lean mass when started late in life.
Male and female C57BL/6J mice fed with control (0.86% methionine as proportion of protein, cysteine free) or MetR diet (0.17% methionine as proportion of protein, cysteine free) or nitisinone for 6 months beginning at 18 months of age. Young (4 months) male and female C57BL/6J mice fed with control (0.86% methionine as proportion of protein, cysteine free) diet were given an oral gavage with a mock solution and used in parallel as a control. On the graphs: Young, control young group after 6 months (10 months old); “Old,” control group of aged mice after 6 months (24 months old); “Nitisinone,” control group of aged mice after 6 months treatment with nitisinone (24 months old); “MetR,” control group of aged mice after 6 months treatment with MetR (24 months old). Means ± SD. n = 8 to 10 mice per group. Analysis of variance (ANOVA) test with posthoc correction for multiple hypothesis testing. *P < 0.05; **P < 0.01; ***P < 0.001; ****P < 0.0001; ns, not significant. (A) Male and (B) female weekly [week (w)] weights after beginning of treatments. (C) Male and (D) female final weights. (E) Male and (F) female weight differences between the end and the beginning of treatment. (G) Male and (H) female % of fat mass normalized to body weight of male. (I) Male and (J) female differences in the total amount of fat between the end and the beginning of treatment. (K) Male and (L) female % of lean mass normalized to body weight. (M) Male and (N) female differences in the total amount of lean mass between the end and the beginning of treatment. (O) Male and (P) female EE (per mouse). (Q) Male and (R) female EE (per kilogram of lean mass).
Fig. 2.
Fig. 2.. Dietary MetR improves plasma metabolic markers and returns methionine levels to youthful levels.
LC-MS analysis of plasma samples (after 2 weeks of treatment) and analysis of plasma metabolic markers (after 6 months of treatment) from male and female C57BL/6J mice fed with either control (0.86% methionine as proportion of protein, cysteine free) or MetR diet (0.17% methionine as proportion of protein, cysteine free) or treated with nitisinone for 6 months beginning at 18 months of age. Young (4 month aged) male and female C57BL/6J mice fed with control (0.86% methionine as proportion of protein, cysteine free) diet were given an oral gavage with a mock solution and used in parallel as a control. Means ± SD. n = 8 to 10 mice per group. ANOVA test with posthoc correction for multiple hypothesis testing. *P < 0.05; **P < 0.01; ***P < 0.001; ****P < 0.0001. Methionine levels in (A) male and (B) female plasma samples after 2 weeks (2w) of treatment. Tyrosine levels in (C) male and (D) female plasma samples after 2w of treatment. FGF21 levels in (E) male and (F) female plasma samples after 6 months of treatment. IGF-1 levels in (G) male and (H) female plasma samples after 6 months of treatment. Adiponectin levels in (I) male and (J) female plasma samples after 6 months of treatment. Leptin levels in (K) male and (L) female plasma samples after 6 months of treatment. Triglyceride levels (TG) in (M) male and (N) female plasma samples after 6 months of treatment. GDF15 levels in (O) male and (P) female plasma samples after 6 months of treatment.
Fig. 3.
Fig. 3.. Dietary MetR improves neuromuscular function in aged mice.
Male and female C57BL/6J mice were fed a control diet (0.86% methionine, cysteine free), a MetR diet (0.17% methionine, cysteine free), or treated with nitisinone for 6 months starting at 18 months of age. Young male and female C57BL/6J mice (4 months old) fed the control diet and gavaged with a mock solution served as a young control group. On the graphs: Young, control group of young mice after 6 months (10 months old); Old, control group of aged mice after 6 months (24 months old); Nitisinone, control group of aged mice after 6 months of treatment with nitisinone (24 months old); MetR, control group of aged mice after 6 months of treatment with MetR (24 months old). Means ± SD. n = 8 to 10 mice per group. ANOVA test with posthoc correction for multiple hypothesis testing.*P < 0.05; **P < 0.01; ***P < 0.001. Rotarod latency to fall: Male (A) and female (B) mice after 6 months of treatment; differences between treatment start and end (C and D). Forepaw grip strength (normalized to body weight): Male (E) and female (F) mice after 6 months of treatment; differences from baseline (G and H). All-paw grip strength (normalized to body weight): Male (I) and female (J) mice after 6 months of treatment; differences from baseline (K and L). Open field cumulative distance traveled: Male (M) and female (N) mice after 6 months of treatment; differences from baseline (O and P).
Fig. 4.
Fig. 4.. Dietary MetR causes heterogeneous cell type–specific responses in the gastrocnemius muscle.
(A) UMAP plot of annotated clusters identified from snRNA-seq data from the gastrocnemius muscle tissues from the control aged and dietary MetR–treated muscle samples. (B) Muscle cell types distribution in the gastrocnemius muscle tissues between control aged and dietary MetR–treated muscle samples. (C) Top 5 Gene Ontology pathways differentially enriched in the gastrocnemius muscle tissues from the control aged and dietary MetR–treated muscle samples across cell types. (D to F) Up-regulated motifs in the gastrocnemius muscle tissues from the control aged and dietary MetR–treated muscle samples for type I myonuclei (D), FAPs (E), and type IIa myonuclei (F) conducted on the snATAC-seq data.
Fig. 5.
Fig. 5.. Dietary MetR decreases frailty in aged mice without an effect on epigenetic clocks.
Male and female C57BL/6J mice fed with either control (0.86% methionine as proportion of protein, cysteine free) or MetR diet (0.17% methionine as proportion of protein, cysteine free) or treated with nitisinone for 6 months beginning at 18 months of age. Young (4 month aged) male and female C57BL/6J mice fed with control (0.86% methionine as proportion of protein, cysteine free) diet were given an oral gavage with a mock solution and used in parallel as a control. On the graphs: Young, control group of young mice after 6 months (10 months old); Old, control group of aged mice after 6 months (24 months old); Nitisinone, control group of aged mice after 6 months of treatment with nitisinone for 6 months (24 months old); MetR, control group of aged mice after 6 months of treatment with MetR for 6 months (24 months old). Means ± SD. n = 8 to 10 mice per group. ANOVA test with posthoc correction for multiple hypothesis testing; and paired t test *P < 0.05; **P < 0.01; ***P < 0.001; ****P < 0.0001. Frailty index in male (A) and female (B) mice after 6 months of treatment. Body temperature in male (C) and female (D) mice after 6 months of treatment. Biological age based on different versions of epigenetic clocks from the blood samples in male (E, G, I, and K) and female (F, H, J, and L) mice after 6 months of treatment. Correlation between leptin DNA methylation and plasma levels of Leptin from human samples used to build epigenetic clocks (M). Biological age from human blood samples (STAY clinical trial) from MetR arm before and after 16 weeks of treatment (N). Disease burden in male (O) and female (P) mice after 6 months of treatment.
Fig. 6.
Fig. 6.. Dietary MetR improves lungs function without an effect on visual acuity, short-term spatial working memory, cardiovascular function, age-related hearing loss, and benign prostatic hyperplasia.
Male and female C57BL/6J mice were fed either a control diet (0.86% methionine, cysteine-free), a MetR diet (0.17% methionine, cysteine-free), or treated with nitisinone for 6 months starting at 18 months of age. Young male and female C57BL/6J mice (4 months old) fed the control diet and gavaged with a mock solution served as a young control group. On the graphs: Young, control group of young mice after 6 months (10 months old); Old, control group of aged mice after 6 months (24 months old); Nitisinone, control group of aged mice after 6 months of treatment with nitisinone for 6 months (24 months old); MetR, control group of aged mice after 6 months of treatment with MetR for 6 months (24 months old). Means ± SD. n = 8 to 10 mice per group. ANOVA test with posthoc correction for multiple hypothesis testing. *P < 0.05; **P < 0.01. Visual acuity in male (A) and female (B) mice after 6 months of treatment. Percent of spontaneous alteration in male (C) and female (D) mice after 6 months of treatment. Number of total entries in the spontaneous alternation test in male (E) and female (F) mice after 6 months of treatment. Tissue damping in male (G) and female (H) mice after 6 months of treatment. Urine albumine/creatinine ratio in male (I) and female (J) mice after 6 months of treatment. Left ventricular mass in male (K) and female (L) mice after 6 months of treatment. Ejection fraction in male (M) and female (N) mice after 6 months of treatment. Acoustic startle response in male (O) and female (P) mice after 6 months of treatment.
Fig. 7.
Fig. 7.. Dietary MetR improves renal and neuromuscular function without altering plasma amyloid in 5XFAD mice.
Data presented as means ± SD, n = 8 to 10 mice per group. ANOVA test with posthoc correction for multiple hypothesis testing. *P < 0.05; **P < 0.01; ***P < 0.001; ****P < 0.0001. (A) Weekly weights of WT and 5XFAD mice after beginning of dietary MetR. (B) Final weights of WT and 5XFAD mice after 6 months of dietary MetR. Plasma (C), brain (D), and muscle (E) methionine levels in WT and 5XFAD mice after 6 months of dietary MetR. Plasma FGF21 (F), IGF-1 (G), adiponectin (H), leptin (I), and GDF15 (J) levels in WT and 5XFAD mice after 6 months of dietary MetR. Plasma Ab42/40 levels in WT and 5XFAD mice before beginning dietary MetR (baseline) (K) and after 6 months of dietary MetR (L). (M) Plasma Ab42/40 differences between the end and the beginning of treatment. Grip strength of forepaws (N) and all paws (O) normalized to body weight after 6 months of dietary MetR. Immunoblot analysis (P) and quantification (Q) of ACC, phosphor-ACC (Ser79), 53BP, and Tubulin in the gastrocnemius muscle tissue after 6 months of dietary MetR.

References

    1. Lopez-Otin C., Blasco M. A., Partridge L., Serrano M., Kroemer G., Hallmarks of aging: An expanding universe. Cell 186, 243–278 (2023). - PubMed
    1. Parkhitko A. A., Filine E., Mohr S. E., Moskalev A., Perrimon N., Targeting metabolic pathways for extension of lifespan and healthspan across multiple species. Ageing Res. Rev. 64, 101188 (2020). - PMC - PubMed
    1. Parkhitko A. A., Binari R., Zhang N., Asara J. M., Demontis F., Perrimon N., Tissue-specific down-regulation of S-adenosyl-homocysteine via suppression of dAhcyL1/dAhcyL2 extends health span and life span in Drosophila. Genes Dev. 30, 1409–1422 (2016). - PMC - PubMed
    1. Parkhitko A. A., Wang L., Filine E., Jouandin P., Leshchiner D., Binari R., Asara J. M., Rabinowitz J. D., Perrimon N., A genetic model of methionine restriction extends Drosophila health- and lifespan. Proc. Natl. Acad. Sci. U.S.A. 118, e2110387118 (2021). - PMC - PubMed
    1. Obata F., Miura M., Enhancing S-adenosyl-methionine catabolism extends Drosophila lifespan. Nat. Commun. 6, 8332 (2015). - PMC - PubMed

LinkOut - more resources