. 2025 Apr 18;11(16):eadq5396.
doi: 10.1126/sciadv.adq5396. Epub 2025 Apr 16.

Aggregation of α-synuclein splice isoforms through a phase separation pathway

Affiliations

Aggregation of α-synuclein splice isoforms through a phase separation pathway

Alexander Röntgen et al. Sci Adv. .

Abstract

The aggregation of α-synuclein (αSyn) is associated with Parkinson's disease and other related synucleinopathies. Considerable efforts have thus been directed at understanding this process. However, the recently discovered condensation pathway, which involves the formation of phase-separated liquid intermediate states, has added further complexity. In parallel, it has been reported that different αSyn splice isoforms may be implicated in aggregate formation in disease. In this study, we compare the phase behavior of four αSyn isoforms (αSyn-140, αSyn-126, αSyn-112, and αSyn-98). Using different biophysical tools including confocal microscopy, kinetic assays and microfluidic-based approaches, we find stark differences between the four systems in their propensities to undergo phase separation and aggregation. Furthermore, we show that even small amounts of αSyn-112, one of the predominant isoforms after αSyn-140, can affect the phase separation of αSyn-140. These results highlight the importance of conducting further investigations to elucidate the role of alternative splicing in synucleinopathies.


Figures
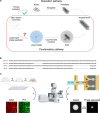
Fig. 1.
Fig. 1.. Schematic overview of the condensation of αSyn splice isoforms studied in this work.
(A) αSyn isoforms can assemble into amyloid aggregates following the deposition and condensation pathways. While the deposition pathway of these splice isoforms has been recently described (29), the condensation pathway was investigated in this study. (B) Comparison of the amino acid sequences of the αSyn splice isoforms. αSyn-140 contains the full amino acid sequence, and αSyn-126 and αSyn-98 lack residues 41 to 54 located in the amphipathic N terminus, whereas αSyn-112 and αSyn-98 lack residues 103 to 130 located in the negatively charged, flexible C terminus. (C) Experimental approaches used in this study. Drop-casting assay (left): A mixture of αSyn splice isoform (1% fluorescent label) and polyethylene glycol (PEG) is spotted on a glass dish and monitored over time by confocal microscopy. Amyloid aggregation is visualized by the addition of the amyloid-binding dye thioflavin T (ThT) (30). A deposited drop evaporates over time, increasing the concentrations of its components and inducing condensation and subsequent aggregation. Microfluidics (right): Water-in-oil droplets of αSyn and PEG are generated in an oil phase and trapped in the device. Through water-in-oil droplet shrinkage, we can observe condensation and obtain biophysical parameters such as the critical concentration needed to induce condensation or aggregation. Elements of this figure have been adapted using BioRender.com.
Fig. 2.
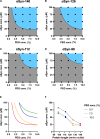
Fig. 2.. Phase diagrams of condensation of the four αSyn splice isoforms.
(A to D) Phase diagrams of condensation of (A) αSyn-140, (B) αSyn-126, (C) αSyn-112, and (D) αSyn-98 were constructed using the drop-casting method, i.e., by depositing drops containing different αSyn and PEG concentrations for 10 min on a glass slide. The black dots represent the conditions investigated. The mixed and demixed phases are shown in gray and blue, respectively. The black line was added as a visual guidance for the phase boundary. (E) Comparison of the phase boundaries for condensation of αSyn-140 (red), αSyn-126 (orange), αSyn-112 (blue), and αSyn-98 (green), which reveals a shift to higher initial αSyn and PEG concentrations required for condensation. (F) Initial αSyn concentrations required for condensation, which were estimated on the basis of the phase boundaries for condensation at fixed PEG concentrations, reveal a decreasing trend with increasing sequence length.
Fig. 3.
Fig. 3.. Time evolution of the condensates of αSyn splice isoforms.
(A to D) Fluorescence images showing the condensate formation of αSyn splice isoforms. For this, a drop containing 100 μM αSyn and 10% PEG was deposited on a glass surface and monitored using confocal microscopy. αSyn condensates were visualized by addition of 1% fluorophore-labeled αSyn. Scale bars, 20 μm. (E and F) Quantification of (E) the size and (F) number of condensates per 1000 µm2, observed at 20 min. Data are shown as means ± SEM of independent experiments (n = 3). One-way analysis of variance (ANOVA) with Tukey’s post hoc test, ***P < 0.001, **P < 0.01, and *P < 0.05. ns, nonsignificant.
Fig. 4.
Fig. 4.. Determination of the critical concentration for condensation of αSyn splice isoforms using microfluidics.
(A) Schematic of the microfluidic device used. Water-in-oil droplets containing αSyn and PEG are generated using a stream of fluorinated oil and subsequently trapped in the device. The water-in-oil droplets shrink over time in a controlled manner, increasing the αSyn concentration within the water-in-oil droplets. (B to D) Representative images showing the shrinkage of water-in-oil droplets and formation of condensates of αSyn-126 in the microfluidic device. For all splice isoforms, 100 μM αSyn (1% fluorescent label) and 10% PEG were used as initial concentrations. (E) The critical concentration for condensation shows a significant increase for the αSyn splice isoforms with decreasing sequence length. One-way ANOVA with Tukey’s post hoc test, ****P < 0.0001 and ***P < 0.001. (F) Critical concentration of a mixture of αSyn-140 and αSyn-112 increases with the relative content of αSyn-112. Data are shown as means ± SD of different droplets (n = 6). (G and H) When measured in terms of mass concentration, rather than molar concentration [as in (E) and (F)], the critical concentrations for condensation do not depend on the identity of the αSyn splice isoforms.
Fig. 5.
Fig. 5.. Aggregation kinetics of αSyn splice isoforms within condensates.
(A to D) Fluorescent images showing amyloid aggregation within condensates for the four splice isoforms. For this, a drop containing 100 μM αSyn, 10% PEG, and 20 µM ThT was deposited on a glass surface and monitored using confocal microscopy. Amyloid aggregation was monitored in the same drop as in Fig. 3. Merged images of Alexa Fluor channels (condensates) and ThT channels (amyloid aggregates) at 25 min are shown as the right panels. Merged images at all time points are shown in fig. S3. Scale bars, 20 μm. (E) ThT fluorescence intensity over time (left) and plateau value (right). Data are shown as means ± SEM (n = 3). One-way ANOVA with Dunnett’s post hoc test, *P < 0.05. a.u., arbitrary units. (F) Normalized aggregation traces in the deposition pathway using plate reader–based time-resolved fluorescence measurements (left) and the corresponding aggregation half-times (right). Data are shown as means ± SD. One-way ANOVA with Tukey’s post hoc test, **P < 0.01 and *P < 0.05. ns, nonsignificant.
Fig. 6.
Fig. 6.. Determination of the critical concentration for aggregation of αSyn splice isoforms using microfluidics.
(A to C) Representative images showing the shrinkage of water-in-oil droplets and the formation of ThT-positive aggregates of αSyn-126. For all splice isoforms, 100 μM αSyn, 10% PEG, and 20 μM ThT were used as starting concentrations. (D) Critical concentration of αSyn for aggregate formation within condensates. Data are shown as means ± SD of different water-in-oil droplets (n = 6). One-way ANOVA with Tukey’s post hoc test, ****P < 0.0001. (E) Comparison of the critical concentrations for condensation and for aggregation of the splice isoforms of αSyn (red, αSyn-140; orange, αSyn-126; blue, αSyn-112; green, αSyn-98).

References

    1. Spillantini M. G., Schmidt M. L., Lee V. M.-Y., Trojanowski J. Q., Jakes R., Goedert M., α-Synuclein in Lewy bodies. Nature 388, 839–840 (1997). - PubMed
    1. Poewe W., Seppi K., Tanner C. M., Halliday G. M., Brundin P., Volkmann J., Schrag A.-E., Lang A. E., Parkinson disease. Nat. Rev. Dis. Primers 3, 1–21 (2017). - PubMed
    1. Goedert M., Jakes R., Spillantini M. G., The synucleinopathies: Twenty years on. J. Parkinsons Dis. 7, S51–S69 (2017). - PMC - PubMed
    1. Balestrino R., Schapira A., Parkinson disease. Eur. J. Neurol. 27, 27–42 (2020). - PubMed
    1. Aarsland D., Batzu L., Halliday G. M., Geurtsen G. J., Ballard C., Ray Chaudhuri K., Weintraub D., Parkinson disease-associated cognitive impairment. Nat. Rev. Dis. Primers. 7, 1–21 (2021). - PubMed

LinkOut - more resources