. 2025 Apr 18;11(16):eadt7366.
doi: 10.1126/sciadv.adt7366. Epub 2025 Apr 16.

A direct effect of the hematocrit on blood glucose: Evidence from hypoxia- and erythropoietin-treated mice

Affiliations

A direct effect of the hematocrit on blood glucose: Evidence from hypoxia- and erythropoietin-treated mice

Thomas Scherer et al. Sci Adv. .

Abstract

Blood glucose is lower in mountain dwellers living under low partial oxygen pressure. We show that obese mice maintained under hypoxia exhibit a delayed but distinct decrease in blood glucose with improved insulin sensitivity, which is independent of changes in body weight. This effect of hypoxia is mediated by erythropoiesis and is a direct result of the rising hematocrit, which could be due to erythrocytes acting as carriers of glucose units in the blood. Glucose lowering by the red cell mass is evidenced by a prompt decrease in glycemia in mice receiving a blood transfusion. Furthermore, life under hypoxia as well as treatment with erythropoietin reduce glycemia also in mice expressing the erythropoietin receptor exclusively in hematopoietic cells, which contrasts with previous assumptions attributing metabolic actions of erythropoietin to direct action on nonhematopoietic tissues. Our results provide a rationale for associations between hematocrit and blood glucose in humans under anti-anemic therapy, polycythemia, smoking, and high-altitude exposure.


Figures

Fig. 1.
Fig. 1.. Life under hypoxia lowers blood glucose and improves insulin sensitivity.
Metabolic characteristics of male obese mice, which, after 3 months on HFD, were exposed to hypoxia for another 3 months (10% O2, red). They were compared to control groups at normal air with free access to food (gray) or with restricted access to food (blue) so to maintain a weight curve mimicking that of the hypoxia-exposed mice. Graphs depict (A) experimental protocol; (B) weight curves; (C) food intake (cage-wise); (D) plasma EPO (#, not detectable in 3 of 13 controls); (E) hemoglobin/hematocrit, blood oxygen saturation, and blood lactate; (F) basal blood glucose and glucose excursion during a glucose tolerance test with the corresponding area under the curve (AUC) [1.5 g/kg intraperitoneally (ip)]; (G) basal rate of disappearance [Rd = equal to basal rate of appearance (Ra)], glucose infusion rate, insulin-stimulated Rd, and insulin-stimulated Ra from a euglycemic-hyperinsulinemic clamp test; (H) basal plasma insulin and HOMA index; (I) plasma adiponectin, leptin, and FGF-21; and (J) plasma triglycerides, free fatty acids, glycerol and ketones, and ectopic triglycerides in the muscle and liver. mo, months; ad lib, ad libitum. Means ± SEM; *P < 0.05; **P < 0.01; ***P < 0.001; ****P < 0.0001, Student’s t test.
Fig. 2.
Fig. 2.. EPO treatment mimics the glucose lowering effect of hypoxia.
Metabolic characteristics of male obese mice, which, after 2 months on HFD, were treated for another 2 months with three intraperitoneal doses per week of epoetin theta (rhEPO; 300 U/kg; red) or the vehicle (blue). Graphs depict (A) experimental protocol; (B) weight curves; (C) food intake (cage-wise); (D) body composition; (E) hemoglobin/hematocrit and blood oxygen saturation; (F) basal blood glucose and glucose excursion during a glucose tolerance test with the corresponding AUC (1.5 g/kg ip); (G) basal plasma insulin and HOMA index; (H) plasma adiponectin; and (I) plasma triglycerides, free fatty acids, glycerol, and ectopic triglycerides in the liver. Means ± SEM; *P < 0.05; **P < 0.01; ****P < 0.0001, Student’s t test.
Fig. 3.
Fig. 3.. Glucose lowering does not require EPO signaling in nonhematopoietic tissues.
Metabolic characteristics of male obese EpoR-KO/Tg mice, which, after 3 months of high-fat feeding, were exposed to hypoxia (10% O2) for another 3 months (A to E) or, after 2 months of high-fat feeding, were treated with three intraperitoneal doses per week of epoetin theta (rhEPO; 300 U/kg) for another 2 months (F to K). Treated groups are shown in red. Corresponding controls were maintained at normal air or treated with the vehicle (blue), and were fed restrictedly so to maintain a weight curve mimicking that of their respective treated counterparts. Graphs depict [(A) and (F)] weight curves, [(B) and (G)] body composition, [(C) and (H)] hemoglobin/hematocrit and blood oxygen saturation, [(D) and (I)] basal blood glucose and glucose excursion during a glucose tolerance test with the corresponding AUC (1.5 g/kg ip), [(E) and (J)] basal plasma insulin and HOMA index, and (K) plasma adiponectin (for rhEPO-treated mice). Means ± SEM; *P < 0.05; **P < 0.01; ***P < 0.001; ****P < 0.0001, Student’s t test.
Fig. 4.
Fig. 4.. Hematocrit-induced glucose lowering: Time dependence and anemic mice.
(A) Time-dependent changes in blood glucose (blue) and hematocrit (red) of male obese mice, which, after 2 months of high-fat feeding, were treated with three intraperitoneal doses per week of epoetin theta (300 U/kg). Blood glucose values are the average of three measurements within the indicated 10-day time interval. Hematocrit was measured once per 10 days. (B to F) Metabolic characteristics of lean male mice fed carbohydrate-rich diet (Chow) and receiving repeated injections of PHZ so to induce anemia with a hematocrit around 25% (red). Controls were injected with the vehicle and were fed restrictedly so to maintain a weight curve mimicking that of the PHZ-treated mice (blue). Graphs depict (B) experimental protocol, (C) hemoglobin/hematocrit and dosing of PHZ, (D) weight curves, (E) plasma EPO, and (F) basal blood glucose and glucose excursion during a glucose tolerance test with the corresponding AUC (1.5 g/kg ip). Means ± SEM; *P < 0.05; **P < 0.01; ****P < 0.0001, Student’s t test.
Fig. 5.
Fig. 5.. Erythrocyte infusion and glucose handling by isolated erythrocytes.
(A to F) Metabolic characteristics of male obese mice, which, after 3 months of high-fat feeding (HFD), were infused with erythrocytes from donor mice (red). Controls were infused with the vehicle (blue). Graphs depict (A) experimental protocol; (B) body weight at surgery and at day of the experiment; (C) hemoglobin/hematocrit and blood oxygen saturation 4 hours after the infusion; (D) basal blood glucose on the morning before, during, and after the 80-min infusion period, as well as on the next day in the fed and 4-hour fasted state; (E) glucose tolerance test with the corresponding AUC (1.5 g/kg ip) performed 2 hours after the infusion; and (F) shear viscosity of blood 24 hours after the infusion. (G) Association between the means of basal blood glucose and hematocrit in all groups of male HFD-obese mice from the present study, including both WT and EpoR-KO/Tg mice. The graph includes data from mice treated with hypoxia (blue circles), epoetin theta (rhEPO; blue triangles), ARA290 (blue quadruple), or acutely infused with donor erythrocytes (red circle). Black circles are data from the various control groups; r and P inside the graph by Pearson’s correlation analysis. (H) Net release of glucose and lactate from isolated mouse erythrocytes exposed to glucose-free incubation medium after preincubation for 1 hour with high glucose (16.5 mM, red; “pre-load”) or low glucose (0.55 mM, blue). (I) Net release of glucose and lactate from erythrocytes isolated from 200 μl of blood from mice treated with the vehicle (blue) or with three weekly intraperitoneal doses of epoetin theta (rhEPO; 300 U/kg; red). Erythrocytes were incubated with low or high glucose immediately after collection (1.1 mM, left; 22 mM, right). Means ± SEM; *P < 0.05; **P < 0.01; ***P < 0.001; ****P < 0.0001, Student’s t test.
Fig. 6.
Fig. 6.. Hematocrit and blood glucose in nonsmokers and smokers.
Hematocrit, BMI, and blood glucose in male adolescent nonsmokers (blue; n = 302,829) versus smokers (red; n = 194,605). Note that scaling of the y axes does not start at 0. Means ± SEM; ****P < 0.0001, Student’s t test.
Fig. 7.
Fig. 7.. Evidence that a high hematocrit lowers blood glucose in mice and humans.
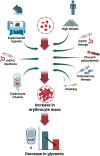
Graphical summary of evidence indicating that a high hematocrit lowers blood glucose. (Left) Experimental interventions in rodents as applied in the present study, which caused an increase in the hematocrit accompanied by a decrease in blood glucose: maintenance under hypoxia, treatment with rhEPO, and infusion of donor erythrocytes. (Right) Conditions under which an increase in the hematocrit is associated with reduced glycemia in humans: a stay at high altitude, anti-anemic therapy with rhEPO, Chuvash polycythemia, testosterone therapy, and smoking.

References

    1. Woolcott O. O., Gutierrez C., Castillo O. A., Elashoff R. M., Stefanovski D., Bergman R. N., Inverse association between altitude and obesity: A prevalence study among andean and low-altitude adult individuals of Peru. Obesity 24, 929–937 (2016). - PMC - PubMed
    1. Woolcott O. O., Castillo O. A., Gutierrez C., Elashoff R. M., Stefanovski D., Bergman R. N., Inverse association between diabetes and altitude: A cross-sectional study in the adult population of the United States. Obesity 22, 2080–2090 (2014). - PMC - PubMed
    1. Lindgarde F., Ercilla M. B., Correa L. R., Ahren B., Body adiposity, insulin, and leptin in subgroups of Peruvian Amerindians. High Alt. Med. Biol. 5, 27–31 (2004). - PubMed
    1. Wang L., Gao P., Zhang M., Huang Z., Zhang D., Deng Q., Li Y., Zhao Z., Qin X., Jin D., Zhou M., Tang X., Hu Y., Wang L., Prevalence and ethnic pattern of diabetes and prediabetes in China in 2013. JAMA 317, 2515–2523 (2017). - PMC - PubMed
    1. Woolcott O. O., Ader M., Bergman R. N., Glucose homeostasis during short-term and prolonged exposure to high altitudes. Endocr. Rev. 36, 149–173 (2015). - PMC - PubMed