. 2025 Apr 18;11(16):eadr9986.
doi: 10.1126/sciadv.adr9986. Epub 2025 Apr 16.

Permissive central tolerance plus defective peripheral checkpoints license pathogenic memory B cells in CASPR2-antibody encephalitis

Affiliations

Permissive central tolerance plus defective peripheral checkpoints license pathogenic memory B cells in CASPR2-antibody encephalitis

Bo Sun et al. Sci Adv. .

Abstract

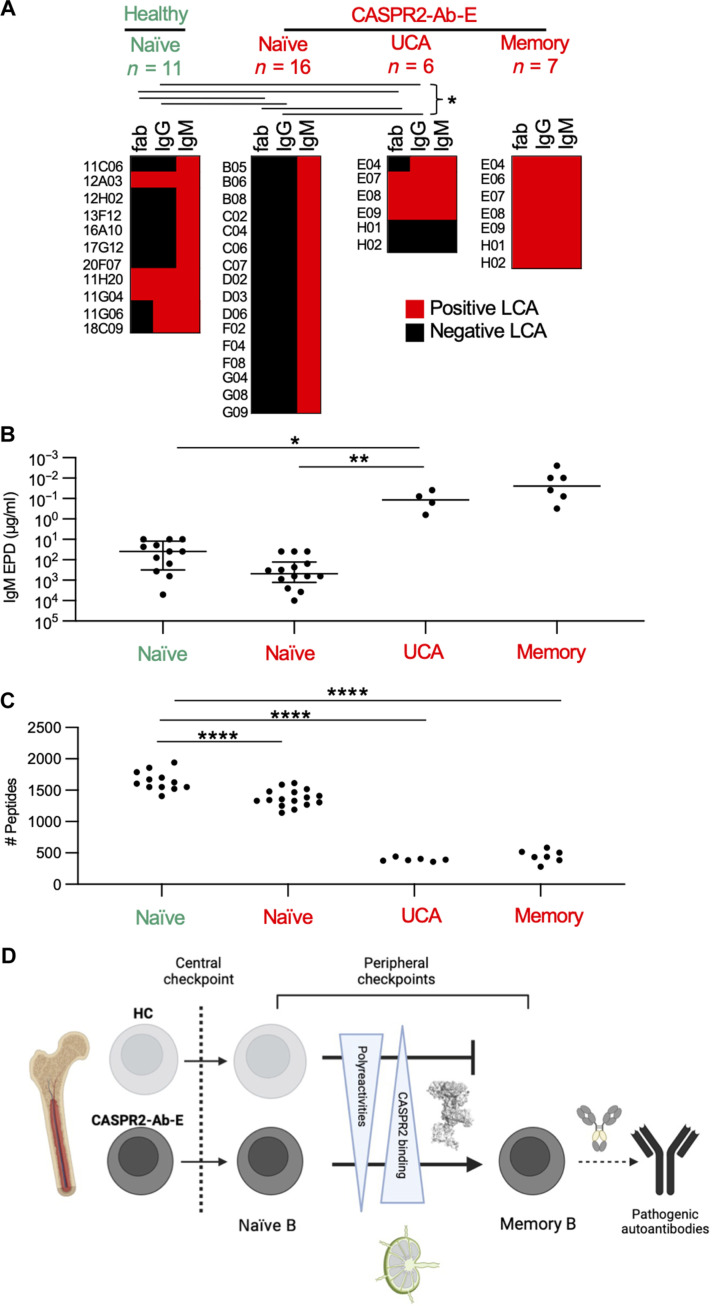
Autoantibody-mediated diseases targeting one autoantigen provide a unique opportunity to comprehensively understand the development of disease-causing B cells and autoantibodies. Convention suggests that such autoreactivities are generated during germinal center reactions. Here, we explore earlier immune checkpoints, focusing on patients with contactin-associated protein-like 2 (CASPR2)-autoantibody encephalitis. In both disease and health, high (~0.5%) frequencies of unmutated CASPR2-reactive naïve B cells were identified. By contrast, CASPR2-reactive memory B cells were exclusive to patients, and their B cell receptors demonstrated affinity-enhancing somatic mutations with pathogenic effects in neuronal cultures and mice. The unmutated, precursor memory B cell receptors showed a distinctive balance between strong CASPR2 reactivity and very limited binding across the remaining human proteome. Our results identify permissive central tolerance, defective peripheral tolerance, and autoantigen-specific tolerance thresholds in humans as sequential steps that license CASPR2-directed pathology. By leveraging the basic immunobiology, we rationally direct tolerance-restoring approaches, with an experimental paradigm applicable across autoimmunity.


Figures

Fig. 1.
Fig. 1.. Central and peripheral immune tolerance in CASPR2-antibody encephalitis and HCs.
(A) Left: Representative flow cytometry cell gating strategy to isolate MBCs (red) and NBCs (blue) for bulk (top) and single (bottom, dotted line) B cell cultures. Representative fluorescence microscopy images of culture supernatant detection of secreted CASPR2-reactive IgG or IgM using a live cell–based assay with CASPR2–enhanced green fluorescent protein (EGFP) expressing HEK293T cells. 4′,6-Diamidino-2-phenylindole (DAPI), nuclear stain. Scale bar, 10 μm. Right: mRNA was extracted from CASPR2-reactive single B cell cultures to amplify and clone paired heavy- and light-chain BCR sequences. These were expressed in HEK293S cells to secrete CASPR2-reactive IgG (blue) or IgM (pink). (B) The proportion of bulk B cell culture wells containing CASPR2-reactive IgM or IgG from patients (CASPR2-Ab-E, n = 6; LGI1-Ab-E, n = 4; NMDAR-Ab-E, n = 4) and HCs (n = 5). Black bars depict the median value. (C) Donut plots visualizing the frequency and clonality of CASPR2-reactive BCRs in single-cell cultures. Numerator, total number of CASPR2-reactive BCRs; denominator, total number of cells screened. The absolute percentage of CASPR2-reactive BCRs is then shown for two patients (P1 and P2) and two HCs (H5 and H6).
Fig. 2.
Fig. 2.. CASPR2 autoreactivity is enhanced by somatic hypermutation.
(A) Ig heavy- and light-chain variable region mutation counts across B cell subsets in both patients (CASPR2-Ab-E) and HCs. (B) Raw surface plasmon resonance (SPR) traces representing the soluble extracellular domain of human CASPR2 binding to immobilized CASPR2 memory mAbs (top row) and their corresponding UCAs (middle row). E06 UCA mAb did not express. UCA binding as an IgM was tested via a live cell–based assay with “+” indicating CASPR2 reactivity (bottom row). NA, not applicable. (C) KD (M) quantification of mAbs via SPR (left). Nonsignificant KD Pearson’s correlations with heavy (middle)– and light (right)–chain mutation count.
Fig. 3.
Fig. 3.. CASPR2 mAbs bind distinct conformational epitopes in native tissues.
(A) No differences in the number of CASPR2 peptides after immunoprecipitation (IP) by peptide phage display versus isotype control mAb. (B) Representative immunohistochemistry staining (all inlays = isotype control mAb) of CASPR2 mAbs on fixed murine hippocampal brain tissue with hippocampus visualized (top left; mAb, E07) in wild-type (WT) and CASPR2 knockout (−/−; top middle) tissue. Representative immunofluorescent staining using E08 on live hippocampal neurons (top right) fixed rat cerebellum (lower left; DAPI, nuclear counterstain), live human iPSC–derived sensory neurons (bottom middle; mAb, E08), and live mouse dorsal root ganglia (bottom right; mAb, E08). Costaining markers to identify cell types include microtubule-associated protein 2 (MAP2) and β-tubulin III. Scale bars, 500 μm (brain tissue) and 10 μm (all others). (C) Endpoint titrations (1:dilutions) of binding across human and mouse CASPR2 live cell–based assays. mAbs are colored as in (F). (D) Cartoon representation of CASPR4 single domains knocked into full-length human CASPR2-EGFP (top). Heatmap depicts CASPR4 knock-in domains that abrogated mAb binding (bottom). FibC, Fibrinogen C. (E) Discoidin (Disc) and laminin3 (L3) domain amino acid sequences from human and mouse, showing nonconserved amino acids in green. The tan and pink highlight Disc and L3 domains throughout the figure, respectively. Predicted CASPR2 protein structure (right; AlphaFold ID 5Y4M) showing nonconserved amino acids (green), Disc, and L3 domains. (F) Binding competition map (left) demonstrating the displacement of a prebound mAb (x axis) by a competing mAb preconjugated with Alexa Fluor 594 (AF594; y axis). Percentage inhibition is defined as percentage reduction of fluorescence intensity of the respective mAb compared to isotype control and represented by a forced directed network of epitope binning (right). Arrowhead indicates the direction of binding competition and line thickness, and intensity denotes percentage inhibition. Shapes denote patient sample.
Fig. 4.
Fig. 4.. Diverse pathogenic potentials of CASPR2 mAbs.
(A) Representative images used to calculate colocalization of pHrodo-conjugated IgG4 mAbs and CASPR2-EGFP, reflecting receptor internalization by CASPR2-expressing HEK293T cells (left). Internalization quantified by mean pHrodo fluorescence intensity mAbs in the presence and absence of dynamin inhibition (dynasore; right). (B) Pearson’s correlation of receptor internalization to mAb binding parameters; bottom x-axis label denotes internalization. Background colors indicate the three epitope pockets as presented in Fig. 3; top x-axis label annotates epitope. (C) Representative images of CASPR2 and MAP2 expression after a 4-hour application of IgG1 (open circles, left) or IgG4 mAbs (closed circles). Scale bars, 5μm. CASPR2 puncta intensity summarized on the right with *P < 0.05, **P < 0.01, nonparametric Kruskal-Wallis with Dunn’s multiple comparisons post hoc test. mAbs colored as in (A). (D) Representative images (left) and quantification (right) of synaptic AMPAR and PSD95 expression similar to (C). (E) Representative tracings (top), single average event and cumulative probability (middle), and amplitude quantifications (bottom) of AMPAR-mediated mEPSC recordings of pyramidal neuronal cultures. *P < 0.05, ***P < 0.001, Kruskal-Wallis test with Dunn’s multiple comparisons post hoc test. (F) Cartoon depiction of intracerebral mAb injection into bilateral hippocampal CA3 regions (left). Open-field (middle) and light-dark box (right) behavioral test performance was assessed at 6 and 9 hours postinjection, respectively. *P < 0.05, t test. (G) Summary model cartoon.
Fig. 5.
Fig. 5.. Distinct CASPR2-reactive BCRs mature in affected patients.
(A) Pie charts depicting the percentage of VH family usage in each labeled population. (B) Heavy-chain germline VH and JH usage (top) and light-chain germline VL and JL (bottom) usage within the indicated B cell populations. Circle size corresponds to frequency. Venn diagrams (right) depict the absolute number of unique V-J pairs by population; P < 0.0001, 2 × 2 contingency analysis comparing naïve groups. (C and D) Heavy-chain CDR3 amino acid length (C) and CDR3 net charge (D) did not statistically differ (ANOVA, P > 0.05). (E) Pie charts demonstrating similar ratios of kappa and lambda light-chain usage by population.
Fig. 6.
Fig. 6.. High CASPR2 avidity and otherwise low self-autoreactivity facilitate clonal escape.
(A) Heatmaps depicting binding by CASPR2-reactive fab segments, -IgG or -IgM; red, positive binding by live cell based assay (LCA). *P < 0.05 for fab and IgG frequency distributions. Populations labeled in green depict HC, and populations labeled in red depict CASPR2-Ab-E throughout the figure. (B) CASPR2-IgM mAb endpoint dilution (EPD) in a live cell–based assay. All mAbs expressed as class IgM to prevent class confound; *P < 0.05 and **P < 0.005. (C) Quantification of the number of peptides enriched in phage immunoprecipitation; ****P < 0.0001, Wilcoxon unpaired. (D) Summary cartoon model.

Update of

References

    1. Theofilopoulos A. N., Kono D. H., Baccala R., The multiple pathways to autoimmunity. Nat. Immunol. 18, 716–724 (2017). - PMC - PubMed
    1. Sun B., Ramberger M., O’Connor K. C., Bashford-Rogers R. J. M., Irani S. R., The B cell immunobiology that underlies CNS autoantibody-mediated diseases. Nat. Rev. Neurol. 16, 481–492 (2020). - PMC - PubMed
    1. Ramanathan S., Brilot F., Irani S. R., Dale R. C., Origins and immunopathogenesis of autoimmune central nervous system disorders. Nat. Rev. Neurol. 19, 172–190 (2023). - PubMed
    1. Dalmau J., Graus F., Antibody-mediated encephalitis. N. Engl. J. Med. 378, 840–851 (2018). - PubMed
    1. Irani S. R., Alexander S., Waters P., Kleopa K. A., Pettingill P., Zuliani L., Peles E., Buckley C., Lang B., Vincent A., Antibodies to Kv1 potassium channel-complex proteins leucine-rich, glioma inactivated 1 protein and contactin-associated protein-2 in limbic encephalitis, Morvan’s syndrome and acquired neuromyotonia. Brain 133, 2734–2748 (2010). - PMC - PubMed

MeSH terms

LinkOut - more resources