. 2025 Sep 3;148(9):3252-3265.
doi: 10.1093/brain/awaf134.

Intronic FGF14 GAA repeat expansions impact progression and survival in multiple system atrophy

Affiliations

Intronic FGF14 GAA repeat expansions impact progression and survival in multiple system atrophy

Viorica Chelban et al. Brain. .

Abstract

Partial phenotypic overlap has been suggested between multiple system atrophy and spinocerebellar ataxia 27B, the autosomal dominant ataxia caused by an intronic GAA•TTC repeat expansion in FGF14. In this study, we investigated the frequency of FGF14 GAA•TTC repeat expansion in clinically diagnosed and pathologically confirmed multiple system atrophy cases. We screened 657 multiple system atrophy cases (193 clinically diagnosed and 464 pathologically confirmed) and 1003 controls. The FGF14 repeat locus was genotyped using long-range PCR and bidirectional repeat-primed PCRs, and expansions were confirmed with targeted long-read Oxford Nanopore Technologies sequencing. We identified 19 multiple system atrophy cases carrying an FGF14 GAA≥250 expansion (2.89%, n = 19/657), a significantly higher frequency than in controls (1.40%, n = 12/1003) (P = 0.04). Long-read Oxford Nanopore Technologies sequencing confirmed repeat sizes and polymorphisms detected by PCR, with high concordance (Pearson's r = 0.99, P < 0.0001). Seven multiple system atrophy patients had a pathogenic FGF14 GAA≥300 expansion (five pathologically confirmed and two clinically diagnosed), and 12 had intermediate GAA250-299 expansion (six pathologically confirmed and six clinically diagnosed). A similar proportion of cerebellar-predominant and parkinsonism-predominant multiple system atrophy cases had FGF14 expansions. Multiple system atrophy patients carrying an FGF14 GAA≥250 expansion exhibited severe gait ataxia, autonomic dysfunction and parkinsonism, in keeping with a multiple system atrophy phenotype, with a faster progression to falls (P = 0.03) and regular wheelchair use (P = 0.02) in comparison to the multiple system atrophy cases without FGF14 GAA expansion. The length of the GAA•TTC repeat expansion lengths was inversely correlated with survival in multiple system atrophy patients (r = -0.67; P = 0.02) but not with age of onset. Therefore, screening for FGF14 GAA•TTC repeat expansion should be considered for multiple system atrophy patients with rapid loss of mobility and for complete diagnostic accuracy at inclusion in disease-modifying multiple system atrophy drug trials.

Keywords: FGF14 GAA ataxia; multiple system atrophy; spinocerebellar ataxia 27B.


Conflict of interest statement

J.B.R. has undertaken remunerated consultancy or advisory board roles for Astronautx, Astex, Asceneuron, Alector, CumulusNeuro, Curasen, Eisai, Prevail and SV Health and has received academic grant income from AstraZeneca, Lilly, GSJ and Janssen as partners in Dementias Platform UK. M.S. has received consultancy honoraria from Ionis, UCB, Prevail, Orphazyme, Biogen, Servier, Reata, GenOrph, AviadoBio, Biohaven, Zevra, Lilly and Solaxa, all unrelated to the present manuscript. W.G.M. has received consultancy fees from Lundbeck, Takeda, Inhibikase, GE and Koneksa. H.R.M. is employed by UCL; in the last 12 months he reports paid consultancy from Roche, Aprinoia, AI Therapeutics and Amylyx; lecture fees/honoraria from BMJ, Kyowa Kirin and the Movement Disorders Society; and research grants from Parkinson's UK, Cure Parkinson's Trust, PSP Association, Medical Research Council and Michael J. Fox Foundation. Dr Morris is a co-applicant on a patent application related to C9ORF72-Method for diagnosing a neurodegenerative disease (PCT/GB2012/052140). T.F. has served on Advisory Boards for Peptron, Voyager Therapeutics, Handl therapeutics, Gain therapeutics, Living Cell Technologies, Abbvie, Bluerock, Bayer and Bial. He has received honoraria for talks sponsored by Bayer, Bial, Profile Pharma, Boston Scientific and Novo Nordisk. All other authors report no competing interests.

Figures
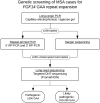
Figure 1
Figure 1
Study flowchart diagram. MSA = multiple system atrophy; ONT = Oxford Nanopore Technologies; RP-PCR = repeat-primed PCR.
Figure 2
Figure 2
Flowchart diagram of genetic tests performed in this study for confirmation and validation of FGF14 GAA•TTC repeat expansions. MSA-C = multiple system atrophy cerebellar subtype; MSA-P = multiple system atrophy parkinsonian subtype; OPCA = olivopontocerebellar atrophy; SND = striatonigral degeneration.
Figure 3
Figure 3
FGF14 allelic distribution in MSA patients and correlation with survival. (A) FGF14 allelic distribution in all MSA patients included in this study. Allele distribution of the FGF14 repeat locus in 657 MSA cases (1314 chromosomes). Among the patients with GAA-FGF14-positive MSA, seven were heterozygous for a GAA≥300 expansions, and 12 were heterozygous for a GAA250–299 expansion. The density plot shows allele-size frequencies, with higher densities indicating greater frequencies. The box-and-whisker plot shows the allelic distribution in patients. The box indicates the 25th percentile (first quartile), the median and the 75th percentile (third quartile), and the whiskers indicate the 2.5th and 97.5th percentiles. Outliers are represented by black dots. Expanded alleles consisting of non-GAA-pure repeats are represented by red triangles, and the red line marks the threshold of GAA300 repeat units. (B) Nanopore repeat size estimates concur with PCR estimates. Comparison of repeat size estimates by LR-PCR and ONT adaptive sequencing targeting for 14 individuals carrying a repeat expansion. (C) Correlation of repeat size in DNA from brain and blood matched samples. Correlation between size of the FGF14 GAA•TTC repeat measured in matched samples from individuals with blood-extracted DNA and brain-extracted DNA (Pearson's r = 0.9, P < 0.0001). (D) Correlation between allele size and survival. Statistically significant negative correlation between size of the FGF14 GAA•TTC repeat expansion and survival (calculated from disease onset until death) in patients with MSA (Pearson's r = −0.67; P = 0.02). LR-PCR = long-range PCR; ONT = Oxford Nanopore Technologies; MSA = multiple system atrophy.
Figure 4
Figure 4
MRI features in FGF14 GAA≥300 patients with MSA.  Top panels show MRI features in case C1 at age 59, 1 year from onset of symptoms, and bottom panels show MRI features in P3 at age 55, 5 years from onset of symptoms. (A and C) Axial T2-weighted images. (B and F) Sagittal T1-weighted images. (E and G) axial proton-density images. (D and H) Axial susceptibility-weighted images. Case C1 had a clinically established diagnosis of multiple system atrophy parkinsonian subtype and FGF14 GAA353 repeat expansion. Case P3 had a neuropathologically established diagnosis of mixed type of multiple system atrophy and FGF14 GAA326 repeat expansion. ‘Hot-cross-bun’ signs (A and E) and cerebellar atrophy (B and F) are present in both cases, more pronounced in Case P3. Hypointensity of the putamen in Case C1 is seen in is seen in C and D.
Figure 5
Figure 5
Pathological findings in MSA cases with FGF14 GAA repeat expansions. Findings in FGF14 GAA≥300 and FGF14 GAA250–299 patients with MSA. (AE) Case P7 (281 GAA repeats). (A) Severe putaminal atrophy, typical of MSA, is seen on the coronal section (red arrow). (B) Substantia nigra in the midbrain shows prominent pallor (red arrow). (C) The height of the pontine base is preserved (blue arrow). (D) The inferior olivary nucleus is clearly visible (blue arrow). (E) In the cerebellum at the level of the dentate nucleus, there is no evidence of significant white matter atrophy (blue arrow), the cerebellar cortex shows no apparent atrophy (blue asterisk), and the dentate nucleus is unremarkable. The macroscopic appearances are typical of MSA-SND. (FR) Case P10 (277 GAA repeats). (F) Hippocampus shows no atrophy. (G) In the tail of the caudate nucleus (blue rectangle in F), there are glial cytoplasmic inclusions in the grey matter and within striato-pallidal fibres (red arrow), in addition to neuronal cytoplasmic inclusions in the grey matter (magenta arrow). (H) In the white matter of the parahippocampal gyrus (red rectangle in F) and adjacent gyri, there are occasional glial cytoplasmic inclusions. (I) In the substantia nigra, there is prominent depletion of pigmented neurons, with neuromelanin deposition freely in the neuropil (black arrow); occasional residual pigmented neurons contain diffuse cytoplasmic α-synuclein aggregates, and there are occasional glial cytoplasmic inclusions across the midbrain (red arrow). (J) In the pontine base, there is a prominent atrophy of the transverse fibres and pontine base nuclei (red rectangle in J). (K) There are numerous neuronal cytoplasmic and intranuclear inclusions (magenta arrow) in the pontine nuclei, and glial cytoplasmic inclusions (red arrow) in the nuclei and transverse fibres. (LN) In the medulla, there are frequent diffuse neuronal cytoplasmic inclusions in the inferior olivary nucleus (blue rectangle in L and magenta arrow in M) and glial cytoplasmic inclusions in the white matter (red rectangle in L and red arrow in N). In the cerebellum (O, P and R), there is a moderate depletion of Purkinje cells, but good preservation of the granule cells, with occasional glial cytoplasmic inclusions (red arrow in P) in the cortex (magenta rectangle in O), and numerous glial cytoplasmic inclusions (red arrow in R) in the cerebellar white matter (magenta rectangle in O). The histological appearances are typical of MSA with equal SND and OPCA involvement. (S and T) α-Synuclein immunohistochemistry in findings in FGF14 GAA≥300-positive patients with MSA show numerous intra-oligodendroglial inclusions in the cerebellum (S) and medulla oblongata (T). Scale bars: 3 mm in F and O; 50 µm in GI, K, M, N, P and R; 400 µm in J; 0.7 mm in L; 40 µm in S and T. MSA = multiple system atrophy; MSA-C = multiple system atrophy cerebellar subtype; MSA-P = multiple system atrophy parkinsonian subtype; OPCA = olivopontocerebellar atrophy; SND = striatonigral degeneration.

Similar articles

  • FGF14 GAA Intronic Expansion in Unsolved Adult-Onset Ataxia in the Care4Rare Canada Consortium.
    Cuillerier A, Del Gobbo GF, Mackay L, Wall E, Couse M, McDonell LM, Cloutier M, Danzi MC, Warman-Chardon J, Bourque PR, Suchowersky O, Mears A, Seldenthuis L, Mears W, Larrigan L, White-Brown A, Pfeffer G, Bulman DE, Dyment D; Care4Rare Canada Consortium; Boycott KM. Cuillerier A, et al. Ann Clin Transl Neurol. 2025 Jun;12(6):1118-1125. doi: 10.1002/acn3.70016. Epub 2025 Apr 7. Ann Clin Transl Neurol. 2025. PMID: 40191983 Free PMC article.
  • Spinocerebellar Ataxia Type 27B can be Suspected Based on Clinical Phenotype: The Massachusetts General Hospital Ataxia Center Experience.
    Rettenmaier LA, Chen JYH, MacMore J, Gupta AS, Lin CC, Stephen CD, Pellerin D, Brais B, Schmahmann JD. Rettenmaier LA, et al. Cerebellum. 2025 Jul 18;24(5):133. doi: 10.1007/s12311-025-01882-3. Cerebellum. 2025. PMID: 40679574
  • FGF14 (GAA∙TTC) repeat expansion-related ataxia SCA27B is common in Northern Finland.
    Kytövuori L, Pellerin D, Kärppä M, Sipilä JOT, Dicaire MJ, Iruzubieta P, Brais B, Majamaa K. Kytövuori L, et al. Parkinsonism Relat Disord. 2025 Aug;137:107943. doi: 10.1016/j.parkreldis.2025.107943. Epub 2025 Jul 3. Parkinsonism Relat Disord. 2025. PMID: 40623333
  • Friedreich Ataxia.
    Bidichandani SI, Delatycki MB, Napierala M, Duquette A. Bidichandani SI, et al. 1998 Dec 18 [updated 2025 Jun 26]. In: Adam MP, Feldman J, Mirzaa GM, Pagon RA, Wallace SE, Amemiya A, editors. GeneReviews® [Internet]. Seattle (WA): University of Washington, Seattle; 1993–2025. 1998 Dec 18 [updated 2025 Jun 26]. In: Adam MP, Feldman J, Mirzaa GM, Pagon RA, Wallace SE, Amemiya A, editors. GeneReviews® [Internet]. Seattle (WA): University of Washington, Seattle; 1993–2025. PMID: 20301458 Free Books & Documents. Review.
  • GAA-FGF14-Related Ataxia.
    Pellerin D, Danzi M, Renaud M, Houlden H, Synofzik M, Zuchner S, Brais B. Pellerin D, et al. 2024 Jan 25. In: Adam MP, Feldman J, Mirzaa GM, Pagon RA, Wallace SE, Amemiya A, editors. GeneReviews® [Internet]. Seattle (WA): University of Washington, Seattle; 1993–2025. 2024 Jan 25. In: Adam MP, Feldman J, Mirzaa GM, Pagon RA, Wallace SE, Amemiya A, editors. GeneReviews® [Internet]. Seattle (WA): University of Washington, Seattle; 1993–2025. PMID: 38271551 Free Books & Documents. Review.

References

    1. Goh YY, Saunders E, Pavey S, et al. Multiple system atrophy. Pract Neurol. 2023;23:208–221. - PMC - PubMed
    1. Papp MI, Kahn JE, Lantos PL. Glial cytoplasmic inclusions in the CNS of patients with multiple system atrophy (striatonigral degeneration, olivopontocerebellar atrophy and Shy-Drager syndrome). J Neurol Sci. 1989;94:79–100. - PubMed
    1. Spillantini MG, Anthony Crowther R, Jakes R, et al. Filamentous α-synuclein inclusions link multiple system atrophy with Parkinson’s disease and dementia with Lewy bodies. Neurosci Lett. 1998;251:205–208. - PubMed
    1. Gilman S, Wenning GK, Low PA, et al. Second consensus statement on the diagnosis of multiple system atrophy. Neurology. 2008;71:670–676. - PMC - PubMed
    1. Koga S, Aoki N, Uitti RJ, et al. When DLB, PD, and PSP masquerade as MSA: An autopsy study of 134 patients. Neurology. 2015;85:404–412. - PMC - PubMed

Substances