

Evolution of the tumor immune landscape during treatment with tebentafusp, a T cell receptor-CD3 bispecific
- PMID: 40239619
- PMCID: PMC12047528
- DOI: 10.1016/j.xcrm.2025.102076
Evolution of the tumor immune landscape during treatment with tebentafusp, a T cell receptor-CD3 bispecific
Abstract
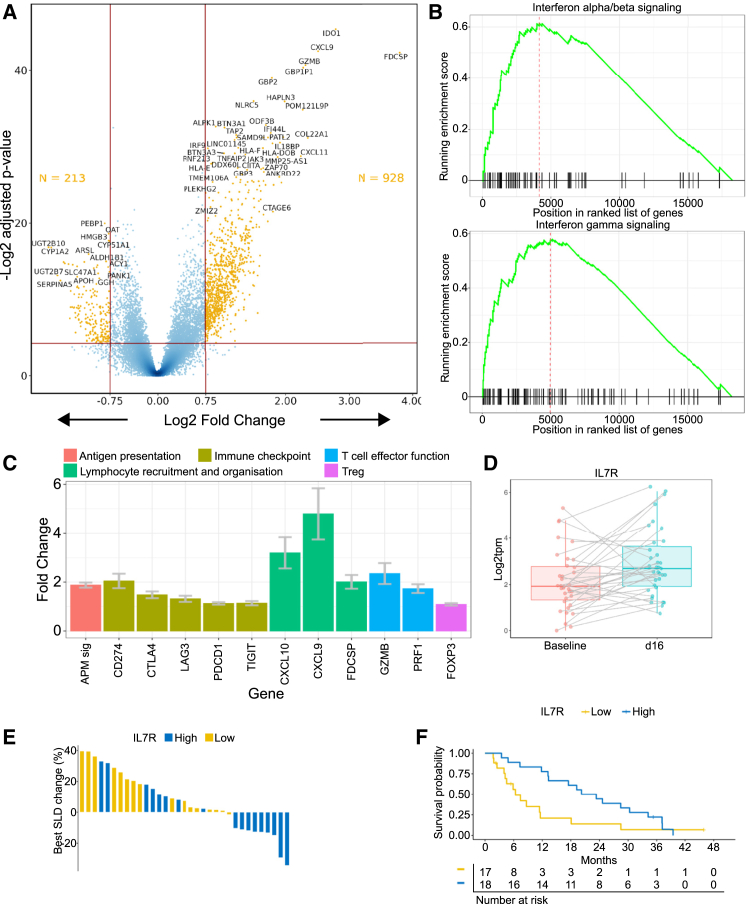
Metastatic uveal melanoma is an aggressive disease with poor outcome, which is refractory to immune checkpoint inhibitors. A T cell receptor (TCR)-based CD3 bispecific, tebentafusp, delivers clinical benefit in patients with metastatic uveal melanoma. Understanding the molecular basis for the anti-tumor activity of tebentafusp in an indication where checkpoint inhibitors are ineffective could aid in identification of other solid tumor indications where CD3 bispecifics may serve an unmet need. By analyzing tumor biopsies taken prior to treatment, early on-treatment, and at progression (NCT02570308), using RNA sequencing (RNA-seq) and immunohistochemistry (IHC), we show that expression of interferon-related genes in the tumor prior to treatment is associated with improved overall survival and tumor reduction on tebentafusp, that T cell recruitment occurs even in tumors with a low baseline level of T cell infiltration, and that durability of changes induced in the tumor microenvironment is key for survival duration.
Keywords: T cell engager; bispecific; gp100; immunotherapy; tumor immunology; tumor microenvironment; uveal melanoma.
Copyright © 2025 The Authors. Published by Elsevier Inc. All rights reserved.
Conflict of interest statement
Declaration of interests A.N.S. discloses grant/contract: Bristol Myers Squibb, Immunocore, Novartis, Targovax, Pfizer, Alkermes, Checkmate Pharmaceuticals, Foghorn Therapeutics, Linnaeus Therapeutics, Prelude Therapeutics, Iovance Biotherapeutics, Bristol Myers Squibb, Polaris, and Xcovery. R.D.C. discloses consultant: Aura Biosciences, Castle Biosciences, Chimeron, Immunocore, InxMed, Iovance, Merck, OncoSec, Pierre Fabre Pharmaceuticals Inc., PureTech Health, Regeneron Pharmaceuticals, Rgenix, Sanofi Genzyme, Sorrento Therapeutics, and TriSalus; stock option: Aura Biosciences, Chimeron, and Rgenix. A.P.I. discloses research funding to institution: Dynavax, GSK/Sarah Cannon, Immunocore, Merck, Neon Therapeutics/Sarah Cannon, and Checkmate Pharmaceuticals. P.N. discloses data and safety monitoring: 4SC and Achilles; consultant/advisory board: 4SC, Bristol Myers Squibb, Immunocore, Merck, Merck Sharp and Dohme, Novartis, and Pfizer; research grant/contract: Immunocore. O.H. discloses contract: Aduro Biotech, Akeso biotech, Amgen Inc., BeiGene Ltd, BioAtla, Bristol Myers Squibb, Genentech USA, Inc., GlaxoSmithKline, Idera Pharmaceuticals, Immunocore, Incyte Corporation, Janssen Global Services, LLC, Merck, Next Cure Inc., Novartis, Pfizer, Regeneron Pharmaceuticals Inc., Sanofi, Seattle Genetics, Tempus, and Zelluna Immunotherapy; contracted research for institution: Aduro Biotech, Akeso biotech, Amgen Inc., Arcus Biosciences, BioAtla, Bristol Myers Squibb, CytomX Therapeutics, Exelixis Inc., Genentech, GlaxoSmithKline, Idera Pharmaceuticals, Immunocore, Incyte Corporation, Iovance Biotherapeutics, Merck, Merck Serono, Moderna, NextCure Inc., Novartis, Pfizer, Regeneron Pharmaceuticals, Sanofi Genzyme, Seattle Genetics, Torque Pharma, and Zelluna Immunotherapy; speakers bureau: Bristol Myers Squibb, Novartis, and Pfizer. M.O.B. discloses consultant/advisory: Adaptimmune, Bristol Myers Squibb Canada, GlaxoSmithKline, Immunocore, Instil Bio, Iovance Biotherapeutics, Merck, Novartis, Pfizer, Sanofi Pasteur Inc., Sun Pharma, IDEAYA Bio, Medison, Regeneron, and Iovance; safety review committee: GlaxoSmithKline and Adaptimmune; research funding: Merck, Takara Bio, and Novartis. T.S. discloses advisory/consulting: Immunocore and Castle Biosciences; research funding to institution (clinical trials): Immunocore, Verastem, IDEAYA, TriSalus, and BMS. L.d.l.C.-M. discloses Consultant/Advisory: MSD-Merck, Bristol Myers Squibb, Pierre-Fabré, Novartis, Gilead, Incyte, Daichii Sankyo, and AstraZeneca; stock ownership: none; research funding: MSD-Merck, Roche Farma, and Celgene; speaking: MSD-Merck, Roche Farma, Bristol Myers Squibb, Amgen, and Gilead; grant support: Bristol Myers Squibb, Roche Farma, and Gilead. J.J.S. discloses PI on clinical trial: Amgen, AstraZeneca, Bristol Myers Squibb, Delcath Systems, Merck, Replimune, and Transgene; research grant/contract: AstraZeneca, Bristol Myers Squibb, and Immunocore; consultant/advisory board: Bristol Myers Squibb, Delcath Systems, Immunocore, Merck, and Replimune; congress attendance: Bristol Myers Squibb, Merck, and Replimune. P.K., E.L., S.K., C.B.-R., L.C., S.S., and K.R. disclose employees and stock owners of Immunocore Ltd.
Figures


Similar articles
-
Tebentafusp elicits on-target cutaneous immune responses driven by cytotoxic T cells in uveal melanoma patients.J Clin Invest. 2025 Apr 29;135(12):e181464. doi: 10.1172/JCI181464. eCollection 2025 Jun 16. J Clin Invest. 2025. PMID: 40311102 Free PMC article. Clinical Trial.
-
Monitoring soluble cMET and ctDNA in metastatic uveal melanoma patients to track early disease progression on immunotherapies.J Exp Clin Cancer Res. 2025 Jul 19;44(1):213. doi: 10.1186/s13046-025-03451-2. J Exp Clin Cancer Res. 2025. PMID: 40682179 Free PMC article.
-
Three-Year Overall Survival with Tebentafusp in Metastatic Uveal Melanoma.N Engl J Med. 2023 Dec 14;389(24):2256-2266. doi: 10.1056/NEJMoa2304753. Epub 2023 Oct 21. N Engl J Med. 2023. PMID: 37870955 Free PMC article. Clinical Trial.
-
State-of-the-art in Metastatic Uveal Melanoma Treatment: A 2025 Update : How to treat Metastatic Uveal Melanoma in 2025.Curr Oncol Rep. 2025 Jul;27(7):803-821. doi: 10.1007/s11912-025-01684-0. Epub 2025 May 17. Curr Oncol Rep. 2025. PMID: 40380030 Free PMC article. Review.
-
Fundus hypopigmentation and choroidal thinning associated with tebentafusp therapy: report of a case and literature review.BMC Ophthalmol. 2025 Aug 15;25(1):464. doi: 10.1186/s12886-025-04274-7. BMC Ophthalmol. 2025. PMID: 40817046 Free PMC article. Review.
Cited by
-
A Consolidated Review of Contemporary Targeted and Immunotherapeutic Options for Melanoma.Biomedicines. 2025 Jun 5;13(6):1388. doi: 10.3390/biomedicines13061388. Biomedicines. 2025. PMID: 40564107 Free PMC article. Review.
-
Artificial intelligence-assisted assessment of metabolic response to tebentafusp in metastatic uveal melanoma: a long axial field-of-view [18F]FDG PET/CT study.Eur J Nucl Med Mol Imaging. 2025 Sep 6. doi: 10.1007/s00259-025-07504-8. Online ahead of print. Eur J Nucl Med Mol Imaging. 2025. PMID: 40913640
References
-
- Figueiredo C.R., Kalirai H., Sacco J.J., Azevedo R.A., Duckworth A., Slupsky J.R., Coulson J.M., Coupland S.E. Loss of BAP1 expression is associated with an immunosuppressive microenvironment in uveal melanoma, with implications for immunotherapy development. J. Pathol. 2020;250:420–439. doi: 10.1002/path.5384. - DOI - PMC - PubMed
Publication types
MeSH terms
Substances
Grants and funding
LinkOut - more resources
Full Text Sources
Medical
