. 2025 Apr 15;6(4):102047.
doi: 10.1016/j.xcrm.2025.102047.

Treatment of IL-18-binding protein biologics suppresses fibrotic progression in metabolic dysfunction-associated steatohepatitis

Affiliations

Treatment of IL-18-binding protein biologics suppresses fibrotic progression in metabolic dysfunction-associated steatohepatitis

Dong-Hyun Kim et al. Cell Rep Med. .

Abstract

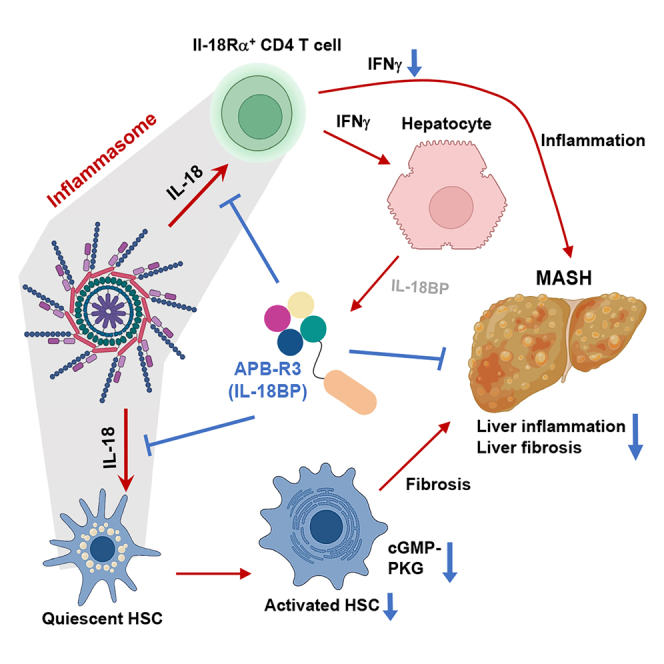
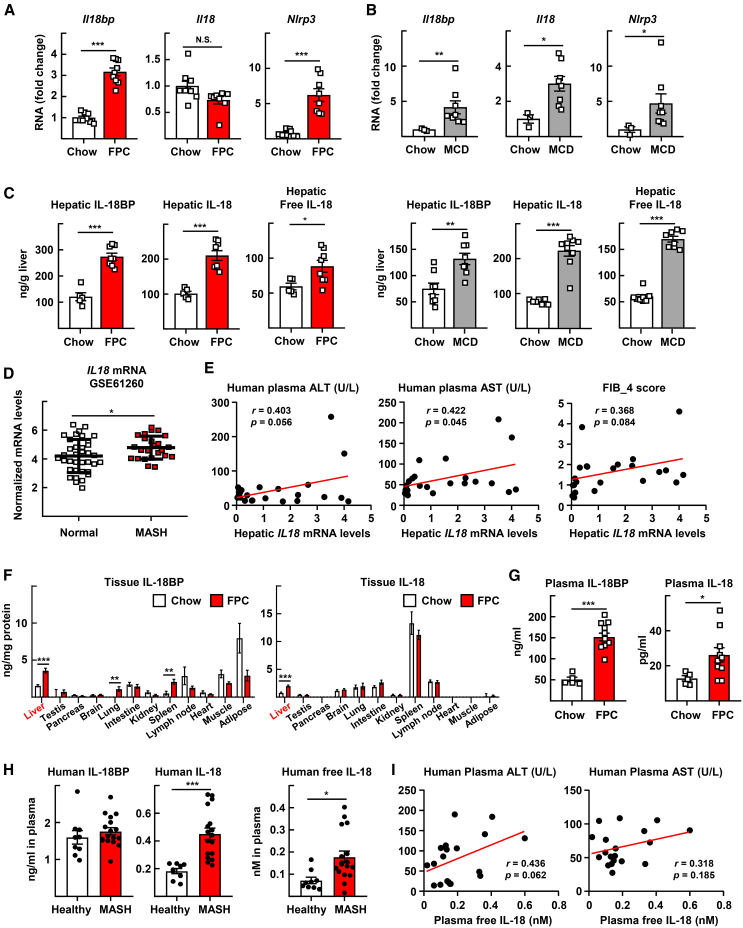
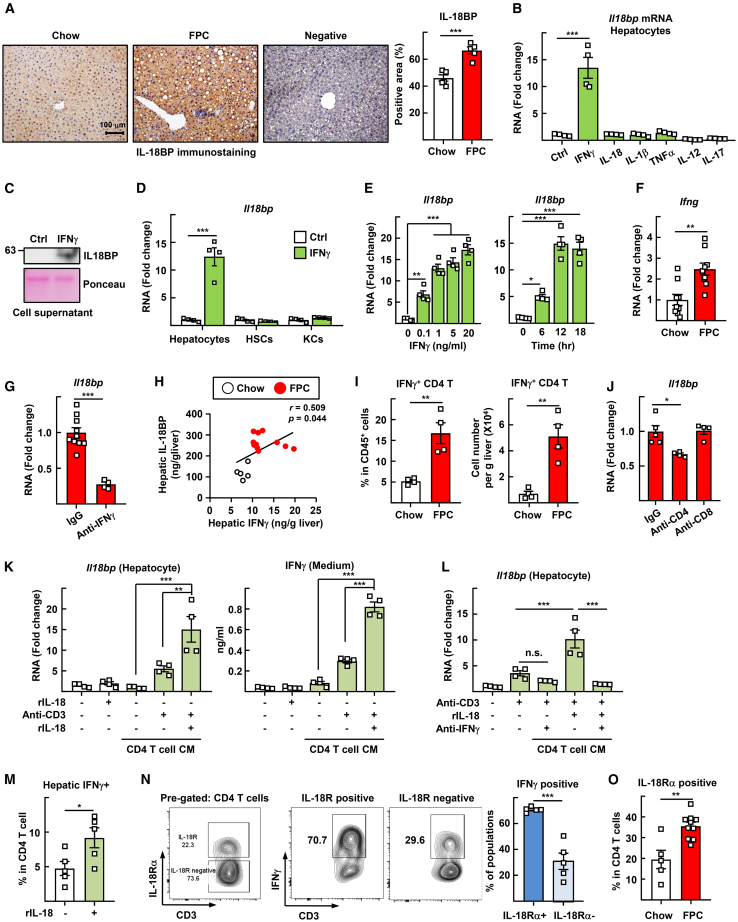
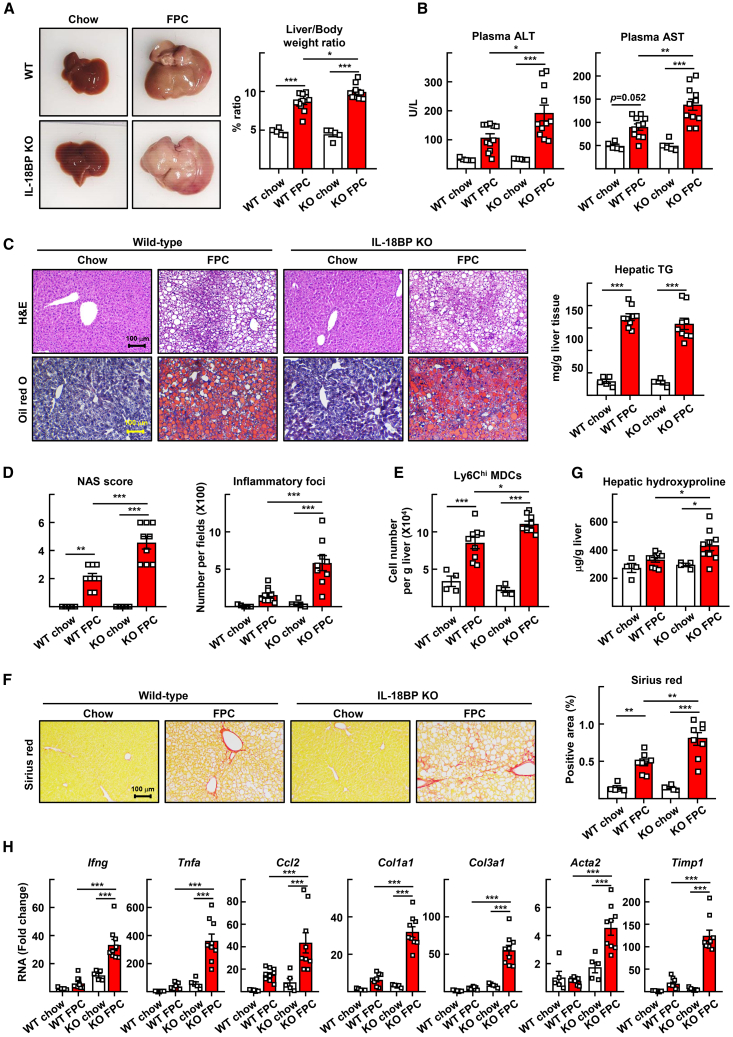
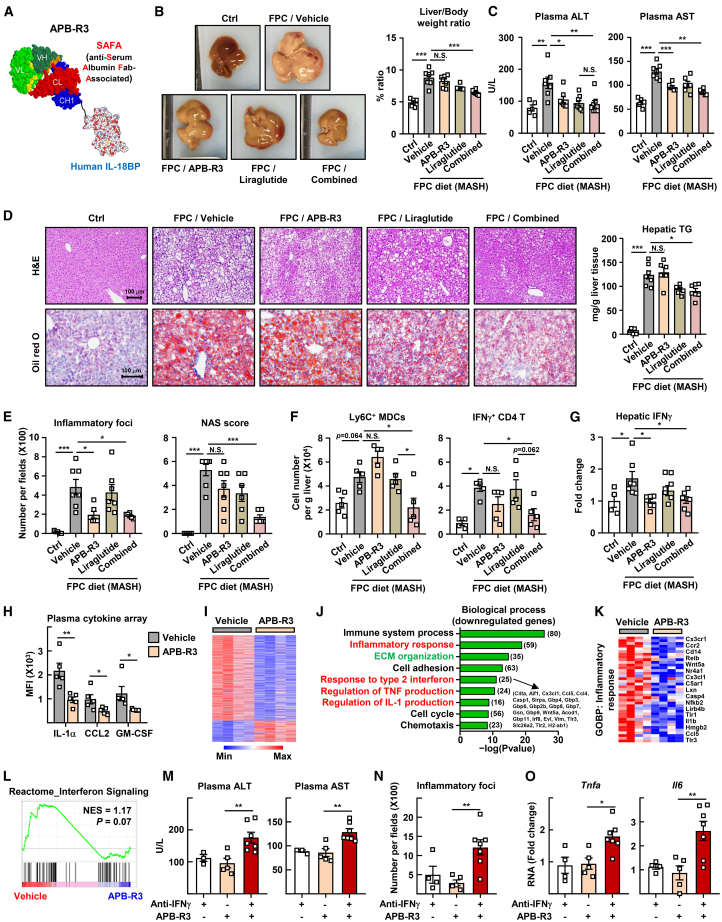
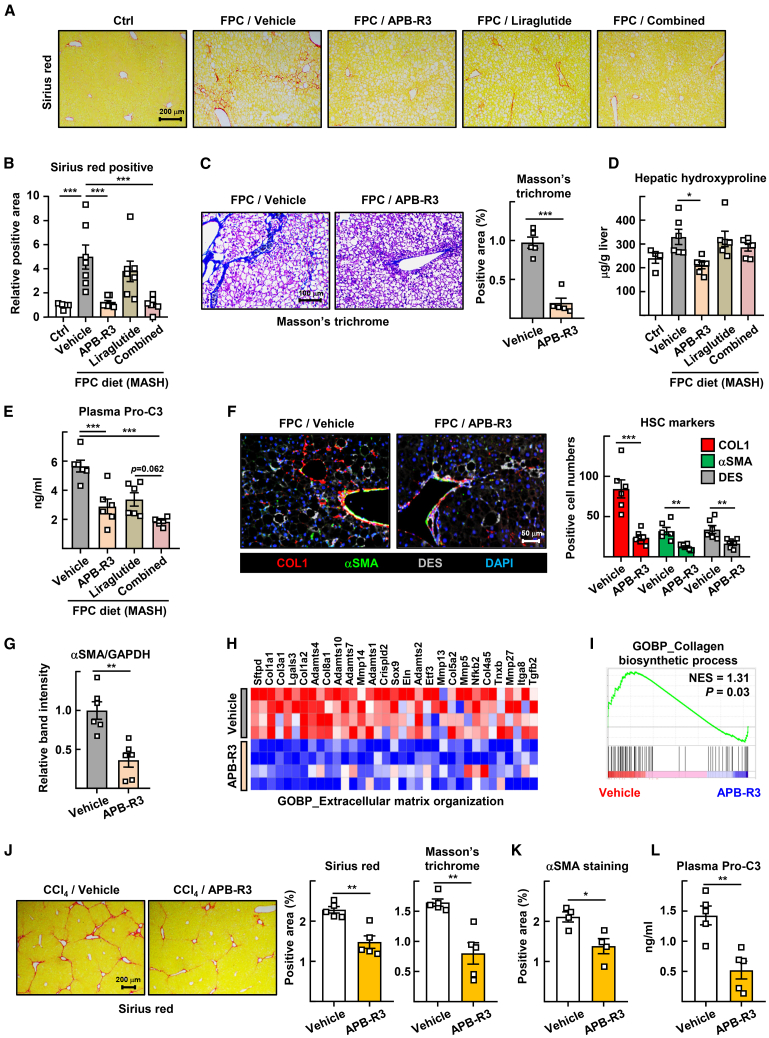
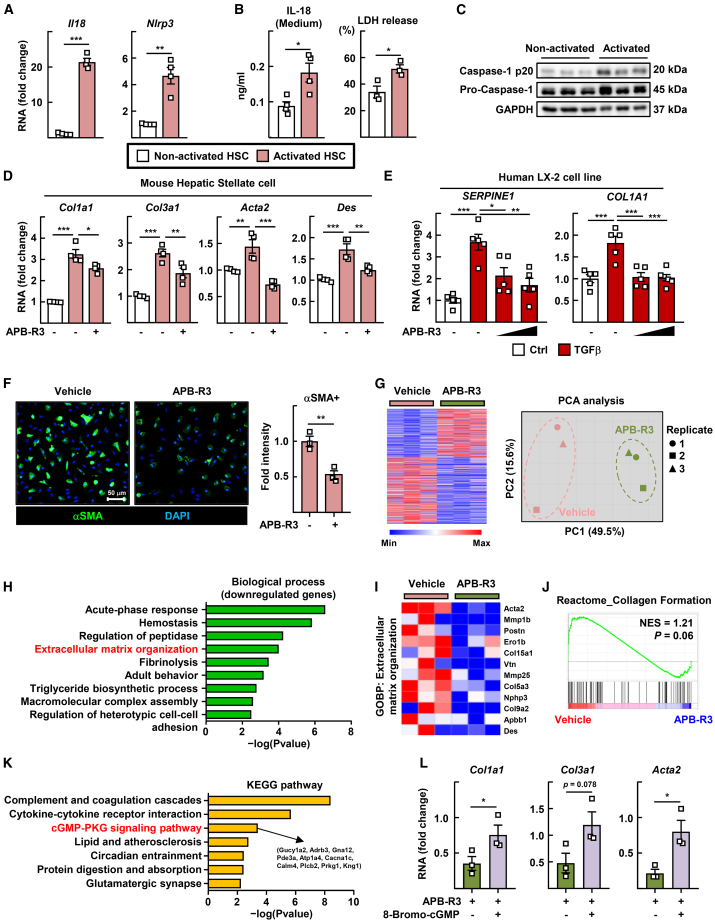
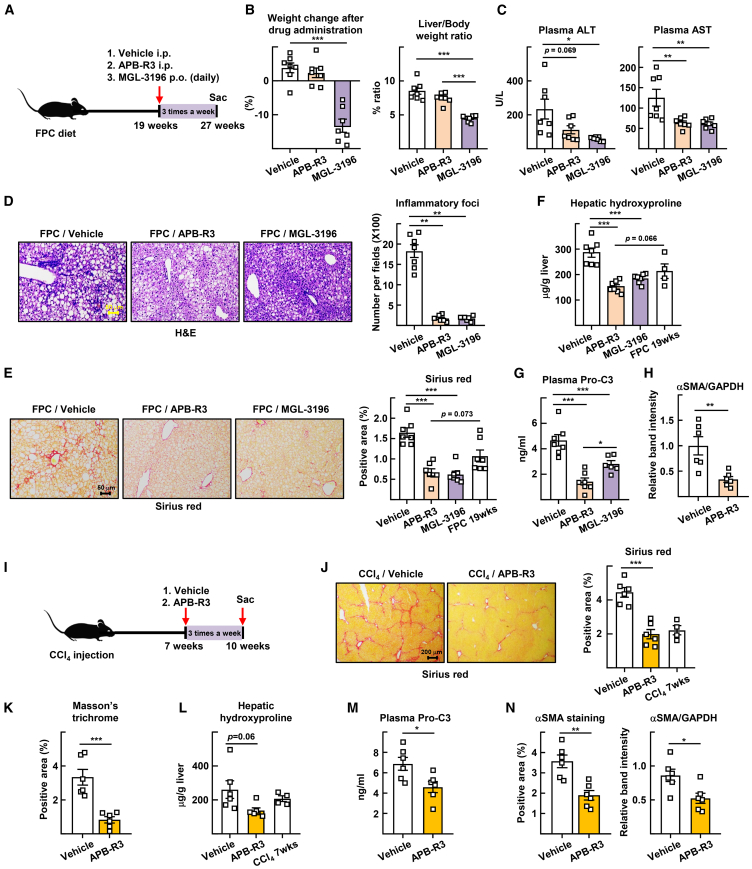
Metabolic dysfunction-associated steatohepatitis (MASH) is a chronic liver disease characterized by inflammation and fibrosis, with enhanced interleukin-18 (IL-18) signaling. IL-18-binding protein (IL-18BP) neutralizes IL-18, but its therapeutic potential in MASH is unclear. We find elevated IL-18BP and IL-18 levels in patients with MASH and mice, with free IL-18 correlating with disease severity. IL-18 stimulates interferon-gamma (IFNγ) production in CD4 T cells, increasing hepatic IL-18BP. IL-18BP-deficient mice show worsened liver inflammation and fibrosis. We develop a human IL-18BP biologics (APB-R3) and inject it to mice to evaluate its pharmacologic efficacy. APB-R3 significantly improves MASH in reducing fibrosis and inflammation and inhibits hepatic stellate cell activation via the cGMP pathway. This study proposes that abrogation of IL-18 signaling by boosting IL-18BP can strongly inhibit the development of MASH-induced fibrosis, and our engineered IL-18BP biologics can become a promising therapeutic candidate for curing MASH.

Keywords: APB-R3; IFNγ; IL-18BP; MASH; fibrosis; hepatic stellate cell.


Conflict of interest statement

Declaration of interests At the time of submission, J.P., S.C., J.H., S.-M.K., and S.-H.C. were employees of AprilBio Co., Ltd (Chuncheon, South Korea).

Figures

None
Graphical abstract
Figure 1
Figure 1
Hepatic IL-18BP and IL-18 are elevated under MASH condition Male C57BL/6J mice were fed with FPC diet for 16 weeks or with MCD diet for 6 weeks. (A) Measurement of Il18bp, Il18, and Nlrp3 mRNA levels in the livers obtained from chow or FPC diet-fed mice by quantitative reverse-transcription PCR (qRT-PCR) (n = 8 or 9). (B) Measurement of Il18bp, Il18, and Nlrp3 mRNA levels in the livers obtained from chow or MCD diet-fed mice by qRT-PCR (n = 3 or 8). (C) ELISA assay was conducted to measure hepatic amounts of IL-18BP, IL-18, and free IL-18 in FPC (left, n = 5 or 8) or MCD (right, n = 8) diet-fed mice. (D) Gene expression analysis was conducted using public datasets obtained from GEO site at the NCBI (GSE61260). Hepatic mRNA levels of IL18 were analyzed. The data processed as quantile normalized intensity value (n = 38 for normal; n = 24 for MASH). (E) Correlation between mRNA levels of hepatic IL18 and parameters of liver injuries including plasma ALT, AST, and FIB_4 score in the livers of human patients with MASH (n = 23). (F) Tissue expression of IL-18BP and IL-18 in chow or FPC diet-fed mice (n = 4). (G) ELISA assay was conducted to measure plasma concentration of IL-18BP and IL-18 in FPC diet-fed mice (n = 5 or 10). (H) ELISA assay was conducted to measure concentrations of IL-18BP, IL-18, and free IL-18 in plasma of human patients with healthy and MASH (n = 9 or 17). (I) Correlation between plasma free IL-18 and parameters of liver injuries including plasma ALT and AST levels obtained from human patients with MASH (n = 19). ∗p < 0.05, ∗∗p < 0.01, and ∗∗∗p < 0.001. The data represent mean ± SEM. The data were analyzed by the unpaired two-sided Student’s t test for simple comparisons or one-way ANOVA with Tukey’s post hoc test for multiple groups.
Figure 2
Figure 2
Augmented IL-18 leads to release of hepatic IL-18BP via T cell-driven IFNγ production (A) Representative images of IL-18BP immunostaining in FPC diet-fed liver sections. Scale bar, 100 μm. Stained area of IL-18BP was measured by ImageJ (n = 5). (B) Measurement of Il18bp mRNA levels treated with pro-inflammatory cytokines in primary hepatocytes (n = 4). (C) Immunoblot for IL-18BP in cell supernatant obtained from IFNγ-treated primary hepatocytes. (D) Measurement of Il18bp mRNA levels treated with IFNγ in primary hepatocytes, hepatic stellate cells (HSCs), and Kupffer cells (KCs) (n = 4). (E) Primary hepatocytes were treated with IFNγ as indicated concentrations (18 h) and time intervals (20 ng/mL), and then Il18bp mRNA levels were measured (n = 4). (F) Measurement of Ifng mRNA levels in the livers obtained from chow or FPC diet-fed mice (n = 9). (G) Neutralizing antibodies against IFNγ were injected in FPC diet-fed mice. Hepatic Il18bp mRNA levels were measured (n = 10 or 4). (H) Correlation between hepatic amounts of IL-18BP and IFNγ in livers obtained from chow and FPC diet-fed mice (n = 15). (I) The percentages and numbers of IFNγ-positive CD4 T cells in the FPC diet-fed livers were analyzed by flow cytometry (n = 4). (J) Neutralizing antibodies against CD4 or CD8 were injected in FPC diet-fed mice. Hepatic Il18bp mRNA levels were measured (n = 5 or 4). (K) Primary hepatocytes were incubated with conditioned medium (CM) from the culture of anti-CD3 or recombinant IL-18 (rIL-18)-pretreated CD4 T cells for 18 h. Measurement of Il18bp mRNA levels was performed by qRT-PCR (left, n = 4). The concentrations of IFNγ (right) in hepatocytes medium were measured (right, n = 4). (L) Primary hepatocytes were incubated with CM from the culture of anti-CD3 or rIL-18-pretreated CD4 T cells for 18 h with anti-IFNγ antibody. Measurement of Il18bp mRNA levels was performed by qRT-PCR (n = 4). (M) Isolated CD4 T cells from MASH-induced liver were treated with rIL-18 ex vivo. The percentage of IFNγ-positive cells was analyzed (n = 5). (N) The hepatic percentage of IFNγ-positive cells within IL-18Rα+ or IL-18Rα CD4 T cells was analyzed by flow cytometry (n = 5). (O) The percentage of IL-18Rα-positive cells within CD4 T cells obtained from livers of chow and FPC diet-fed mice was analyzed (n = 5 or 10). ∗p < 0.05, ∗∗p < 0.01, and ∗∗∗p < 0.001. The data represent mean ± SEM. The data were analyzed by the unpaired two-sided Student’s t test for simple comparisons or one-way ANOVA with Tukey’s post hoc test for multiple groups.
Figure 3
Figure 3
Knockout of IL-18BP worsens liver inflammation and fibrosis in MASH models 8-week-old C57BL/6J wild-type (WT) and IL-18BP knockout (KO) mice were fed chow or FPC diet for 15 weeks. (A) Representative captured livers (left) and the liver/body weight ratio at the end of experiments (right). (B) Measurement of plasma ALT and AST levels. (C) H&E and oil red O-stained liver sections (left). Scale bar, 100 μm. Hepatic TG levels were measured (right). (D) NAS score and numbers of inflammatory foci of liver histology. (E) The numbers of Ly6Chi monocyte-derived cells (MDCs) were analyzed by flow cytometry in the liver. (F) Sirius red-stained liver sections (left). Scale bar, 100 μm. Stained positive area was measured by ImageJ (right). (G) Measurement of hepatic hydroxyproline. (H) Measurement of mRNA levels of pro-inflammatory and fibrosis genes such as Ifng, Tnfa, Ccl2, Col1a1, Col3a1, Acta2, and Timp1 in the liver. ∗p < 0.05, ∗∗p < 0.01, and ∗∗∗p < 0.001. The data represent mean ± SEM. n = 5–11 per mice group. The data were analyzed by one-way ANOVA with Tukey’s post hoc test for multiple groups.
Figure 4
Figure 4
Treatment of APB-R3, a long-acting biologics of IL-18BP, ameliorates MASH symptoms by combination therapy with GLP1R agonist (A–I) C57BL/6J wild-type mice were fed FPC diet for 19 weeks. Drugs were administered from 11 to 19 weeks. 8 mg/kg of APB-R3 (SAFA-hIL-18BP) and/or 100 μg/kg of GLP1 agonist (Liraglutide) were administered three times a week as indicated. (A) Molecular structure of APB-R3. (B) Representative captured livers (left) and the ratio of liver/body weight (right). (C) Plasma ALT and AST levels were measured at the end of experiments. (D) H&E and oil red O-stained liver sections (left). Scale bar, 100 μm. The amount of hepatic triglycerides (TGs) was measured (right). (E) The numbers of inflammatory foci and NAS score of liver histology. (F) The numbers of Ly6Chi MDCs and IFNγ-positive CD4 T cells were analyzed by flow cytometry in the liver. (G) ELISA assay was conducted to measure hepatic amounts of IFNγ. (H) Bead cytokine array was conducted for blood plasma. Representative results for IL-1α, CCL2, and GM-CSF were exhibited. (I) Heatmap analysis of mRNA transcripts of vehicle or APB-R3-treated livers. (J) Representative pathways of Gene Ontology enrichment analysis for downregulated genes in APB-R3-treated livers. (K) Heatmap analysis of the genes related with inflammatory response in vehicle or APB-R3 administration. (L) GSEA analysis for reactome of interferon signaling in vehicle or APB-R3-treated livers. (M–O) C57BL/6J wild-type mice were fed FPC diet for 19 weeks. Drugs were administered from 11 to 19 weeks. 8 mg/kg of APB-R3 and/or 10 mg/kg of anti-IFNγ were administered three times a week as indicated. (M) Plasma ALT and AST levels were measured at the end of experiments. (N) The numbers of inflammatory foci of liver histology. (O) Measurement of mRNA levels of proinflammatory genes such as Tnfa and Il6 in the livers. ∗p < 0.05, ∗∗p < 0.01, and ∗∗∗p < 0.001. The data represent mean ± SEM. n = 4–8 per mice group. The data were analyzed by one-way ANOVA with Tukey’s post hoc test for multiple groups.
Figure 5
Figure 5
APB-R3 prevents the progression of hepatic fibrosis (A–I) C57BL/6J wild-type mice were fed FPC diet for 19 weeks. Drugs were administered from 11 to 19 weeks. 8 mg/kg of APB-R3 (SAFA-hIL-18BP) and/or 100 μg/kg of GLP1 agonist (liraglutide) were administered three times a week as indicated. (A) Sirius red-stained liver sections. Scale bar, 200 μm. (B) Relative Sirius red-positive area of liver histology. (C) Masson’s trichrome-stained area of liver sections was analyzed. Scale bar, 100 μm. (D) Measurement of hepatic hydroxyproline. (E) ELISA assay was conducted to measure plasma procollagen type Ⅲ N-terminal (Pro-C3). (F) Immunostaining of liver section for collagen type 1 (COL1), αSMA, and desmin (DES) proteins. Stained cell numbers were counted. Scale bar, 50 μm. (G) Relative band intensity of αSMA protein in the liver was measured. (H) Heatmap analysis of the genes related with extracellular matrix organization in vehicle or APB-R3 administration. (I) GSEA analysis for Gene Ontology of collagen biosynthetic process in vehicle or APB-R3-treated livers. (J–L) C57BL/6J wild-type mice were administered with carbon tetrachloride (CCl4) for 5 weeks. 8 mg/kg of APB-R3 or PBS was administered three times a week at 3 to 5 weeks. (J) Sirius red and Masson’s trichrome-stained liver sections were presented and positive area was analyzed by ImageJ. Scale bar, 200 μm. (K) Immunostaining of liver section for αSMA proteins. Stained area was measured. (L) ELISA assay was conducted to measure plasma Pro-C3. ∗p < 0.05, ∗∗p < 0.01, and ∗∗∗p < 0.001. The data represent mean ± SEM. n = 4–8 per mice group. The data were analyzed by the unpaired two-sided Student’s t test for simple comparisons or one-way ANOVA with Tukey’s post hoc test for multiple groups.
Figure 6
Figure 6
Blockade of IL-18 ameliorates fibrotic activation of hepatic stellate cells via cGMP signaling pathway (A) Measurement of mRNA levels of Il18, and Nlrp3 in non-activated (day 3) and activated (day 5) primary hepatic stellate cells (HSCs). (B) The concentrations of IL-18 in HSCs medium were measured (left). Lactate dehydrogenase (LDH) release assay in cell medium was conducted (right). (C) Representative immunoblot analysis in cell medium for caspase-1 p20 and lysates for pro-caspase-1 and housekeeping proteins from HSCs were conducted. (D) Measurement of mRNA levels of fibrosis genes such as Col1a1, Col3a1, Acta2, and Des in non-activated (day 3) and activated (day 5) primary HSCs. APB-R3 was treated at day 4 for 18 h (E) Measurement of mRNA levels of genes related with LX-2 cell activation such as SERPINE1 and COL1A1 in control and TGF-β-treated human LX-2 cell lines. (F) Immunofluorescence images of primary HSCs for αSMA. Scale bar, 50 μm. αSMA-positive area was analyzed. (G) Heatmap and principal component analysis (PCA) analysis of mRNA transcripts of vehicle or APB-R3-treated HSCs. (H) Representative pathways of Gene Ontology enrichment analysis for downregulated genes in APB-R3-treated HSCs. (I) Heatmap analysis of the genes related with extracellular matrix organization in vehicle or APB-R3 incubation. (J) GSEA analysis for reactome of collagen formation in vehicle or APB-R3-treated HSCs. (K) Representative KEGG pathways for downregulated genes in APB-R3-treated HSCs. (L) Measurement of mRNA levels of fibrosis genes such as Col1a1, Col3a1, and Acta2, in vehicle or 8-bromo-cGMP incubation on APB-R3-treated HSCs. ∗p < 0.05, ∗∗p < 0.01, and ∗∗∗p < 0.001. The data represent mean ± SEM. n = 3–5 per experimental condition. The data were analyzed by the unpaired two-sided Student’s t test for simple comparisons or one-way ANOVA with Tukey’s post hoc test for multiple groups.
Figure 7
Figure 7
APB-R3 treatment after establishment of liver fibrosis ameliorates disease parameters (A) C57BL/6J wild-type mice were fed FPC diet for 27 weeks. Drugs were administered from 19 to 27 weeks. 8 mg/kg of APB-R3 (SAFA-hIL-18BP) was intraperitoneally administered three times a week as indicated. 5 mg/kg of THRβ agonist (MGL-3196; resmetirom) was daily orally gavaged as compared group. (B) Body weight change after drug administration was measured at the end of experiments (left). The ratio of liver/body weight was analyzed (right). (C) Plasma ALT and AST levels were measured at the end of experiments. (D) Representative images of H&E liver sections (left). Scale bar, 50 μm. The numbers of inflammatory foci of liver histology (right). (E) Representative images of Sirius red-stained liver sections. Scale bar, 50 μm. Sirius red-positive area of liver histology was measured. (F) Measurement of hepatic hydroxyproline. (G) ELISA assay was conducted to measure plasma Pro-C3. (H) Relative band intensity of αSMA protein in the liver was measured. (I) C57BL/6J wild-type mice were administered with carbon tetrachloride (CCl4) for 10 weeks. 8 mg/kg of APB-R3 or PBS was administered three times a week at 7 to 10 weeks. (J and K) Sirius red and Masson’s trichrome-stained liver sections were presented and positive area was analyzed by ImageJ. Scale bar, 200 μm. (L) Measurement of hepatic hydroxyproline. (M) ELISA assay was conducted to measure plasma Pro-C3. (N) Immunostaining of liver section for αSMA proteins. Stained area was measured (left). Relative band intensity of αSMA protein in the liver was measured (right). ∗p < 0.05, ∗∗p < 0.01, and ∗∗∗p < 0.001. The data represent mean ± SEM. n = 4–7 per mice group. The data were analyzed by the unpaired two-sided Student’s t test for simple comparisons or one-way ANOVA with Tukey’s post hoc test for multiple groups.

Similar articles

Cited by

References

    1. Singh S., Allen A.M., Wang Z., Prokop L.J., Murad M.H., Loomba R. Fibrosis progression in nonalcoholic fatty liver vs nonalcoholic steatohepatitis: a systematic review and meta-analysis of paired-biopsy studies. Clin. Gastroenterol. Hepatol. 2015;13:643–e40. doi: 10.1016/j.cgh.2014.04.014. - DOI - PMC - PubMed
    1. Estes C., Razavi H., Loomba R., Younossi Z., Sanyal A.J. Modeling the epidemic of nonalcoholic fatty liver disease demonstrates an exponential increase in burden of disease. Hepatology. 2018;67:123–133. doi: 10.1002/hep.29466. - DOI - PMC - PubMed
    1. Anstee Q.M., Targher G., Day C.P. Progression of NAFLD to diabetes mellitus, cardiovascular disease or cirrhosis. Nat. Rev. Gastroenterol. Hepatol. 2013;10:330–344. doi: 10.1038/nrgastro.2013.41. - DOI - PubMed
    1. Tsuchida T., Friedman S.L. Mechanisms of hepatic stellate cell activation. Nat. Rev. Gastroenterol. Hepatol. 2017;14:397–411. doi: 10.1038/nrgastro.2017.38. - DOI - PubMed
    1. Inzaugarat M.E., Johnson C.D., Holtmann T.M., McGeough M.D., Trautwein C., Papouchado B.G., Schwabe R., Hoffman H.M., Wree A., Feldstein A.E. NLR Family Pyrin Domain-Containing 3 Inflammasome Activation in Hepatic Stellate Cells Induces Liver Fibrosis in Mice. Hepatology. 2019;69:845–859. doi: 10.1002/hep.30252. - DOI - PMC - PubMed

MeSH terms

Substances