Clinical Trial
. 2025 Apr 15;6(4):102045.
doi: 10.1016/j.xcrm.2025.102045.

Phase 2 trial of perioperative chemo-immunotherapy for gastro-esophageal adenocarcinoma: The role of M2 macrophage landscape in predicting response

Affiliations
Clinical Trial

Phase 2 trial of perioperative chemo-immunotherapy for gastro-esophageal adenocarcinoma: The role of M2 macrophage landscape in predicting response

Thierry Alcindor et al. Cell Rep Med. .

Abstract

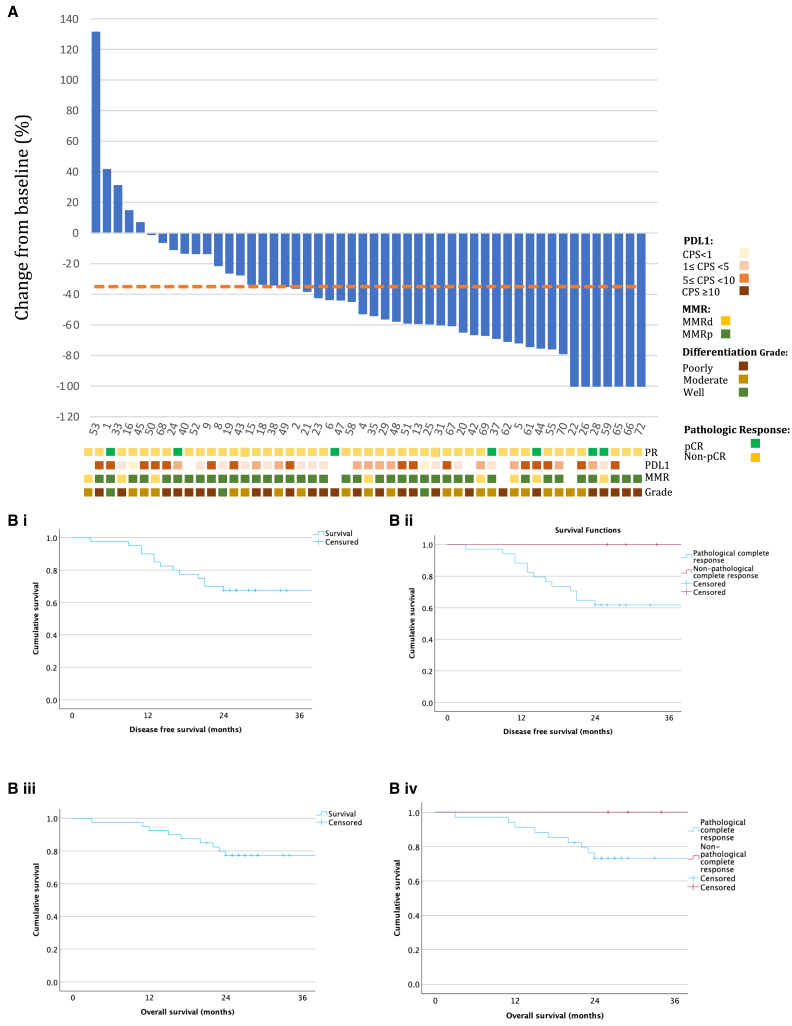
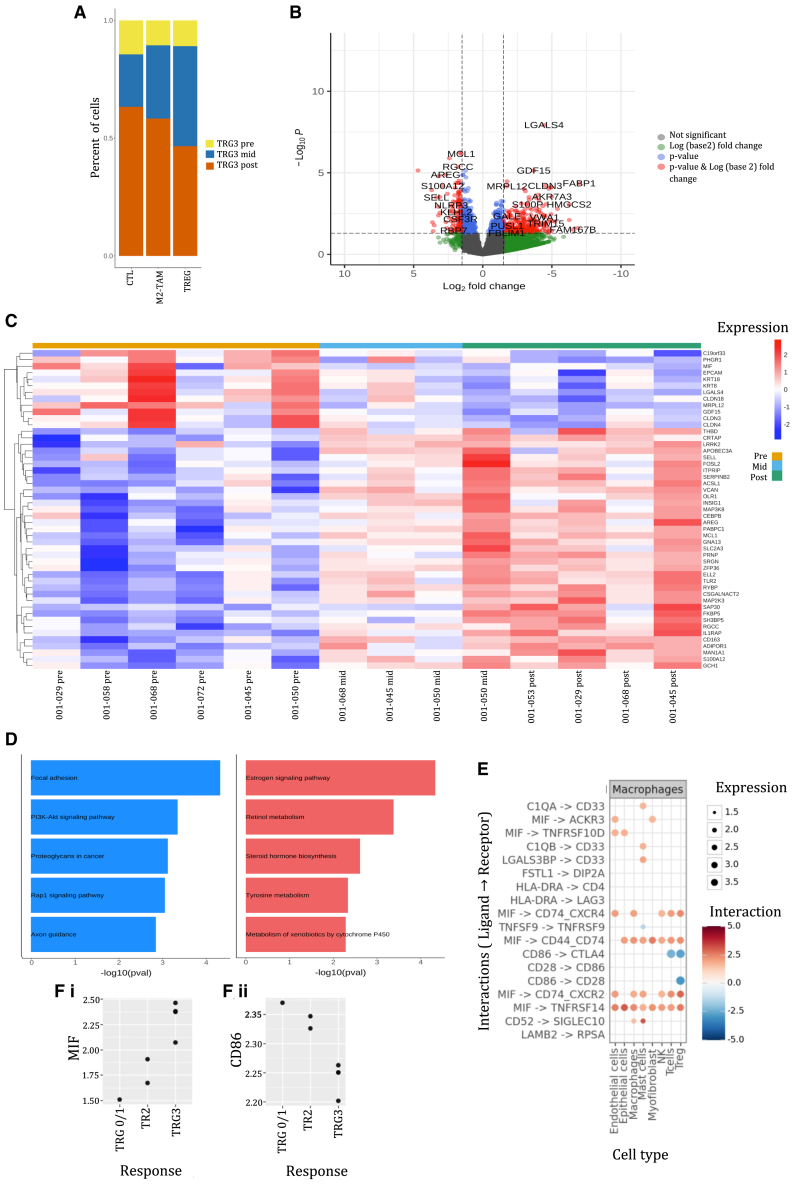
We present the clinical results of a phase 2 trial combining neoadjuvant docetaxel, cisplatin, 5 Flourouracil, and the PD-L1 inhibitor avelumab in locally advanced gastro-esophageal adenocarcinoma (GEA). Fifty-one patients receive neoadjuvant therapy with 50 proceeding to surgery. Grade 3-4 adverse events occur in 40%; complete/major pathological response is found in 7/50 (14%) and 9/50 (18%), with 2-year disease-free survival of 67.5%. There is no correlation between tumor regression and PD-L1 or mismatch repair (MMR) status. Multiplex immunohistochemistry and longitudinal single-cell transcriptomic profiling reveal alterations in certain innate immune cell populations, particularly noting an M2-tumor-associated macrophage (M2-TAM) proliferation in non-responding tumors. These findings describe the effective nature of this treatment regimen for GEA and reveal associated features of the inflammatory milieux associated with response to chemo-immunotherapy. The specific character of the inflammatory environment in non-responders may, in the future, help personalize treatment. This study was registered at ClinicalTrials.gov (NCT03288350).

Keywords: chemotherapy; gastroesophageal adenocarcinoma; immune microenvironment; immunotherapy; pathologic response; single cell transcriptomics; spatial proteomics; surgery; tumor associated macrophage.


Conflict of interest statement

Declaration of interests T.A. has received research funding from EMD Serono and consultancy fees for BMS, Roche, Merck, Novartis, and Tiaho. The rest of the authors declare no competing interests.

Figures

None
Graphical abstract
Figure 1
Figure 1
A CONSORT diagram showing patient inclusion in the study Fifty-one patients were enrolled of which 50 underwent surgery. There were 37 patients who continued to receive adjuvant therapy.
Figure 2
Figure 2
Stratified radiological and survival outcomes of the cohort (A) A waterfall plot showing the change in the maximum standardized uptake values (SUVmax) correlated with pathological response, PD-L1 status, MMR status, and grade of differentiation for the entire cohort (n = 50). (B) (i) Kaplan-Meier plot of DFS for the cohort as a whole (median DFS not met) and (ii) stratified by pCR status until (median DFS not met, log rank [Mantel-Cox] = 0.091) 36 months after histological confirmation. Similar plots were created for OS for the cohort as a whole (iii) (median OS not met) and stratified by pCR status (median OS not met, log rank [Mantel-Cox] = 0.175).
Figure 3
Figure 3
Multiplex imaging density and proximity analyses stratified by response to neoadjuvant therapy (A) Seven-colored composite microphotographs (20X, scale: 50 μm) of representative paired treated and untreated sections of MPR, TRG2, and TRG3 responders (left to right column). (B) (i) The results of a spatially resolved analysis of mIHC-defined immune markers using Halo software. Density of M2-TAM (CD68+CD163+), potential regulatory T cells (TREG Foxp3+), CD8+T cells, and CTLs (CD8+granzymeB+) was measured stratified by TRG (TRG0/1 n = 7, TRG 2 n = 11, and TRG3 n = 18). A significant reduction in the percentage change in M2-TAM density was associated with MPR (two-way ANOVA, Tukey’s correction for multiple comparison, p = 0.038). Though non-significant, increment in mean changes in CTLs and CD8+T cells densities was correlated with favorable outcome. All boxplots are shown with the horizontal line denoting the median, vertical line denoting the 95% confidence interval, and “+” denoting the mean. (B) (ii) Spatial analysis of the measured immune cells indicated a predictive role of intra-tumoral M2-TAM content in pre-treatment gastro-esophageal cancer tissues stratified by TRG (TRG0/1 n = 7, TRG 2 n = 13, and TRG3 n = 21). The mean density of pre-existing, intra-tumoral (infiltrated) M2-TAM among patients with MPR was significantly higher compared to that of poor responders (TRG3) (unpaired t test with Welch’s correction, p = 0.024). (B) (iii) Calculation of the average distance of M2-TAM from the tumor core stratified by TRG (TRG0/1 n = 7, TRG 2 n = 13, and TRG3 n = 21). M2-TAMs were found to be significantly further from tumor cells present in TRG0/1 patients’ specimen compared to that of TRG3 patients (Welch’s unpaired two tailed t test, p = 0.005. (C) Forty-two formalin-fixed paraffin-embedded (FFPE) specimens from pre-treatment biopsies were available. Patients were arranged (left to right) in a heatmap based on their pathological responses. Clinical and post-treatment TNM stages, tumor location, objective response to treatment, and survival were also stratified. High or low subgroups of M2-TAM, TREG, and CD8+T cells were determined using cohort medians. Analysis revealed that 22 out of 42 patients harbor high pre-existing M2-TAM (>median = 390.8 cells/mm2). In total, 63% of these patients had ≥500 M2-TAM/mm2, and 93% of such patients were pathological non-responders (TRG2 and TRG3). Similar analysis for potential TREG and CD8+T cells was conducted and also displayed in the heatmap (last 3 rows).
Figure 4
Figure 4
Single-cell analysis highlighting differential gene expression and cellular distribution among specific clusters of interest (A) A series of UMAPs showing the spatial reduction of cells included from the 20 samples in the scRNA-seq analysis including (i) stratified by cell types, (ii) time in the treatment cycle, (iii) sample number, (iv) response to neoadjuvant therapy, and (v) cell type allocation: CTL (CD8+GZMB+), TREG (CD4+FOXP3+), and M2-TAM (CD68+CD163+/CD206+) cells from all collected samples (n = 20). (B) A heatmap showing the top 10 genes (weighted by lowest adjusted p value) per cluster of M2-TAM, TREG, and CTL cell clusters among all samples (n = 20). (C) A bar plot showing the percentage distribution of M2-TAM, TREG, and CTL cells stratified by sample, response to treatment, and stage in the treatment cycle (treatment pre n = 10, treatment mid n = 2, and treatment post n = 5) with the corresponding number of cells per sample. (D) A transposition of the same data showing the combined cell distribution across all samples stratified by cell type and response to therapy.
Figure 5
Figure 5
Exploring single-cell characteristics of M2-TAMs among poor responders to neoadjuvant therapy (A) For patients with a TRG3, the number of cells allocated to the M2-TAM, TREG, and CTL clusters was summated and the percentage distribution calculated at each time point in the treatment cycle (treatment pre, n = 6, treatment mid, n = 3, and treatment post n = 5). (B) A volcano plot of an unmatched comparison of differentially expressed genes among M2-TAM (CD68+CD163+/CD206+) cells of patients with TRG3 lesions between the treatment pre (n = 6) and treatment post (n = 5) samples using a LogFold change cutoff of +/−1.5 and p value of <0.05. (C) A heatmap of differentially expressed genes of M2-TAM (CD68+CD163+/CD206+) among patients with TRG3 lesions, comparing treatment pre (n = 6) and treatment mid (n = 3) with treatment post (n = 5) with a LogFold change cutoff of +/−1.5 and p value of <0.05. (D) Functional enrichment pathways of differentially expressed genes of treatment-naive versus post-treatment TRG3 samples with upregulated (blue) and downregulated (red) genes. (E) A plot demonstrating ligand-receptor differential gene expression between M2-TAM and other TIME cell lineages among TRG3 samples (n = 14). (F) A dot plot comparing (i) MIF and (ii) CD68 expression among M2-TAMs stratified by TRG status (MPR n = 1, TRG 2 n = 2, and TRG 3 n = 3).

References

    1. Sung H., Ferlay J., Siegel R.L., Laversanne M., Soerjomataram I., Jemal A., Bray F. Global Cancer Statistics 2020: GLOBOCAN Estimates of Incidence and Mortality Worldwide for 36 Cancers in 185 Countries. CA Cancer J. Clin. 2021;71:209–249. doi: 10.3322/caac.21660. - DOI - PubMed
    1. Boonstra J.J., Kok T.C., Wijnhoven B.P., van Heijl M., van Berge Henegouwen M.I., Ten Kate F.J., Siersema P.D., Dinjens W.N., van Lanschot J.J., Tilanus H.W., van der Gaast A. Chemotherapy followed by surgery versus surgery alone in patients with resectable oesophageal squamous cell carcinoma: long-term results of a randomized controlled trial. BMC Cancer. 2011;11:181. doi: 10.1186/1471-2407-11-181. - DOI - PMC - PubMed
    1. van Hagen P., Hulshof M.C.C.M., van Lanschot J.J.B., Steyerberg E.W., van Berge Henegouwen M.I., Wijnhoven B.P.L., Richel D.J., Nieuwenhuijzen G.A.P., Hospers G.A.P., Bonenkamp J.J., et al. Preoperative chemoradiotherapy for esophageal or junctional cancer. N. Engl. J. Med. 2012;366:2074–2084. doi: 10.1056/NEJMoa1112088. - DOI - PubMed
    1. Al-Batran S.E., Homann N., Pauligk C., Goetze T.O., Meiler J., Kasper S., Kopp H.G., Mayer F., Haag G.M., Luley K., et al. Perioperative chemotherapy with fluorouracil plus leucovorin, oxaliplatin, and docetaxel versus fluorouracil or capecitabine plus cisplatin and epirubicin for locally advanced, resectable gastric or gastro-oesophageal junction adenocarcinoma (FLOT4): a randomised, phase 2/3 trial. Lancet. 2019;393:1948–1957. doi: 10.1016/S0140-6736(18)32557-1. - DOI - PubMed
    1. Möhring C., Mańczak A., Timotheou A., Sadeghlar F., Zhou T., Mahn R., Monin M.B., Toma M., Feldmann G., Brossart P., Köksal M. Perioperative therapy with FLOT4 significantly increases survival in patients with gastroesophageal and gastric cancer in a large real-world cohort. Int. J. Cancer. 2023;153:609–622. doi: 10.1002/ijc.34511. - DOI - PubMed

Publication types

MeSH terms

Supplementary concepts

Associated data