. 2025 May 1;188(9):2336-2353.e38.
doi: 10.1016/j.cell.2025.02.029. Epub 2025 Apr 15.

Microbiota-derived bile acids antagonize the host androgen receptor and drive anti-tumor immunity

Affiliations

Microbiota-derived bile acids antagonize the host androgen receptor and drive anti-tumor immunity

Wen-Bing Jin et al. Cell. .

Abstract

Microbiota-derived bile acids (BAs) are associated with host biology/disease, yet their causal effects remain largely undefined. Herein, we speculate that characterizing previously undefined microbiota-derived BAs would uncover previously unknown BA-sensing receptors and their biological functions. We integrated BA metabolomics and microbial genetics to functionally profile >200 putative microbiota BA metabolic genes. We identified 56 less-characterized BAs, many of which are detected in humans/mammals. Notably, a subset of these BAs are potent antagonists of the human androgen receptor (hAR). They inhibit AR-related gene expression and are human-relevant. As a proof-of-principle, we demonstrate that one of these BAs suppresses tumor progression and potentiates the efficacy of anti-PD-1 treatment in an AR-dependent manner. Our findings show that an approach combining bioinformatics, BA metabolomics, and microbial genetics can expand our knowledge of the microbiota metabolic potential and reveal an unexpected microbiota BA-AR interaction and its role in regulating host biology.

Keywords: androgen receptor; anti-tumor immunity; bile acid HSDHs; bile acid metabolism; gut microbiota; host-microbe interactions; microbiota bile acids.


Conflict of interest statement

Declaration of interests D.A. is on scientific advisory boards at Pfizer, Takeda, Nemagene, and the KRF. A provisional patent application based on this work has been filed by Weill Cornell Medicine.

Figures

Figure 1.
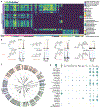
Figure 1.. Characterization of microbiota HSDHs and previously less-studied BA isomers
(A) E. coli was optimized as a heterologous expression host for microbiota BA HSDH candidates (denoted as MBHCs). (B) 207 MBHCs (highlighted) from the sequence similarity network (SSN) were randomly chosen and expressed in the E. coli. 46 known BA substrates were fed to the E. coli library, each expressing an individual MBHC. The SSN was constructed using 3,681 MBHCs with an initial score of 10−50. The edge score was refined such that nodes are connected by an edge if the pairwise sequence identity was ≥60%. Each of the 2,863 nodes contains proteins with identical amino acid sequences. 74 (marked as big colored nodes) were identified as BA HSDHs and are dispersedly distributed in the SSN. (C) MBHC023 was assigned as a 3α-HSDH because its expressing E. coli converts cholic acid to 3-oxo cholic acid. Since MBHC023 also converts norcholic acid (RT: 4.48 min) to a less-characterized BA (RT: 4.38 min). This BA was assigned as 3-oxo NorCA based on its 3α-HSDH activity and further validated its structure assignment by nuclear magnetic resonance (NMR). RT, retention time in LC-MS analysis. See also Figure S1.
Figure 2.
Figure 2.. The gut microbiota encodes uncharacterized BA HSDHs that produce less-characterized BA isomers
(A) A heatmap showing the efficiency of the 74 BA HSDHs converting 46 known BA substrates (Figures S1 and S2; Data S1; Table S3). The percentage of a BA metabolized into its corresponding oxo BAs is shown. Reported conversions are marked with an asterisk. (B) Representative NMR 13C chemical shifts of previously less-characterized BA isomers. The −OH in the substrate targeted by the HSDH is highlighted in green, and the corresponding −oxo group in the product is highlighted in red. See Data S2. (C) Phylogenetic tree of the protein sequences of the 74 microbiota BA HSDHs characterized in this study. (D) Targeted metabolomics analyses of the stool BA compositions of humans and other mammalians. Human, alpaca, cow, horse, Navajo-Churro sheep, sheep, swine, rabbit, hamster, SPF mice, and rat fecal samples were used. See also Figure S2.
Figure 3.
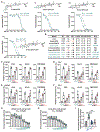
Figure 3.. BAs antagonize the hAR
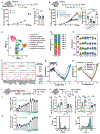
(A) The AR-antagonizing activities were assessed in an hAR reporter assay using 45 pM 5αDH-11-KT (green curves) and 15 pM DHT (gray curves) as agonists. Dose-dependent curves and IC50s are shown. Relative light units (RLUs) were normalized to cell viability. (B) Structural motifs in BAs that affect BA-hAR interactions. A structure-activity relationship (SAR) analysis suggested several structural motifs that favor (highlighted in green) or disfavor (highlighted in red) BA interactions with hAR. (C–F) AR-antagonizing BAs suppress the expression of AR-dependent genes PSA, KLK2, and TMPRSS2 (induced by R1881) in LNCaP and C4-2 cell lines. Cells were cultured in RPMI + 5% charcoal-stripped serum (CSS) and treated for 12 h with the vehicle (Veh) control, 1 nM AR agonist R1881, 1 nM R1881 + 3-oxo-Δ4,6-LCA (Δ4,6) or 3-oxo-Δ5-LCA (Δ5) at 20, 1.25, 0.078 μM (left to right). Three biological replicates as determined by qPCR are shown. Complete data, including enzalutamide (Enz) positive control, are in Data S1I. (G and H) 3-oxo-Δ4,6-LCA (Δ4,6) suppresses the growth of LNCaP and C4-2 cells. The LNCaP (G) and C4-2 cells (H) were treated with Veh and 3-oxo-Δ4,6-LCA (80 to 0.078 μM in a series of 2 × dilution, right to left). (I) AR-antagonizing BAs suppress AR-mediated nuclear translocation. MyC-CaP cells were cultured in androgen-depleted media (DMEM with 5% CSS) and treated with DMSO, 1 nM DHT + DMSO (Veh), 1 nM DHT + 50 μM 3-oxo-Δ4,6-LCA, or 1 nM DHT + 50 μM 3-oxo-Δ5-LCA for 24 h. In each cell, AR fluorescence in cell nucleus after normalizing to DAPI is quantified. (C)–(I) are mean ± SEM; (I) an unpaired two-tailed Student’s t test. The asterisk indicates p < 0.001 (***). See also Figure S3.
Figure 4.
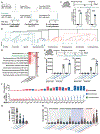
Figure 4.. The AR-antagonizing BAs are microbiota-derived and human-relevant
(A) LC-MS traces showing that gut microbes produce AR-antagonizing BAs in vitro. (B) Gut bacteria convert LCA, 3-oxo-LCA, 3β-Δ5-LCA, and 3-oxo-Δ4-CDCA to corresponding AR-antagonizing 3-oxo-LCA (Bi), 3-oxo-Δ4-LCA (Bii), 3-oxo-Δ5-LCA (Biii), and 3-oxo-Δ4,6-LCA (Biv). Conversion efficiency is calculated by quantifying the percentage of substrate metabolized into its product. (C) Human gut commensals produce AR-antagonizing 3-oxo-Δ4-LCA in vivo. Fecal and serum samples were collected for 3-oxo-Δ4-LCA quantification. (D) Heatmap showing the substrate specificity of gut microbes in converting 3-oxo-CDCA, 3-oxo-DCA, and 3-oxo-LCA (50 μM) into 3-oxo-Δ4-CDCA, 3-oxo-Δ4-DCA, and 3-oxo-Δ4-LCA. (E) Experimental schematic for mono-associating GF mice with Parabacteroides sp. D13 and assessing its preference in producing 3-oxo-Δ4-CDCA, 3-oxo-Δ4-DCA, and 3-oxo-Δ4-LCA. Fecal and serum BAs were quantified (Ei and Eii). (F) The presence rates and abundance distributions of microbiota genes for producing the 4 AR-antagonizing BAs (present in >5% of samples) in the Dutch Microbiome Project (DMP) cohort (n = 8208). The density plots show distributions of their producing microbiota genes (3α/3β-HSDH, 5β-reductase (5β-1-10) and 7α-dehydratase (7α-de) as in Figure S4A (details of sequences are in Table S2), and lines in the density plots denote the median value of non-zero abundances. Genes are sorted by median values of non-zero abundances. RPKM, reads per kilobase of transcript per million reads mapped. (G and H) LC-MS quantification of AR-antagonizing BAs and their associated metabolites (taurine [T-] or glycine [G-] conjugated) in human stool (G) and blood (H) samples (n = 36). In (C) and (E), data are shown as mean ± SEM, and an unpaired two-tailed Student’s t test was performed. The asterisk indicates p value < 0.01 (**) or< 0.001 (***), n.s., not statistically significant. See also Figure S4.
Figure 5.
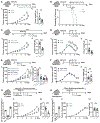
Figure 5.. AR-antagonizing BA promotes anti-cancer immunity in an AR-dependent manner
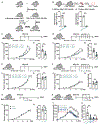
(A) 3-oxo-Δ4,6-LCA suppresses MB49 growth. Subcutaneous MB49 tumor volume changes (i) and tumor weight (ii) in WT-SPF C57BL/6J mice (n = 7/group) i.p. injected with 3-oxo-Δ4,6-LCA (50 mg/kg/day, Cpd) or Veh. (B) 3-oxo-Δ4,6-LCA improves the survival rate in MB49 survival model. Subcutaneous MB49 tumor survival curve in WT-SPF C57BL/6J mice (n = 7/group) treated with Cpd or Veh. (C) The tumor inhibition of 3-oxo-Δ4,6-LCA is not microbiota dependent. Subcutaneous MB49 tumor volume changes (i) and tumor weight (ii) in antibiotics-treated WT-SPF C57BL/6J mice (n = 7–8/group) given Cpd or Veh. (D) 3-oxo-Δ4,6-LCA potentiates anti-PD-1 anti-tumor efficacy. Subcutaneous MB49 tumor volume changes (i) and tumor weight (ii) in antibiotics-treated WT-SPF C57BL/6J mice (n = 10/group) treated with Cpd or Veh combined with anti-PD-1. (E) The anti-tumor effect of 3-oxo-Δ4,6-LCA is abolished after ADT. Subcutaneous MB49 tumor volume changes (i) and tumor weight (ii) in Sham or ADT WT-SPF C57BL/6J mice (n = 6–9/group) treated with Cpd or Veh. Sham, Sham-operated mice; ADT, androgen deprivation. (F) The anti-PD-1 potentiation of 3-oxo-Δ4,6-LCA is abolished after ADT. Subcutaneous MB49 tumor volume changes (i) and tumor weight (ii) in ADT WT-SPF C57BL/6J mice (n = 7/group) treated with Cpd or Veh combined with anti-PD-1. (G and H) The tumor inhibition of 3-oxo-Δ4,6-LCA is AR dependent. Circulatory testosterone in SPF male mice (male), ADT mice, ADT mice with testosterone pellet (Gi), and male mice with testosterone propionate (Hi) were quantified using Elisa. Subcutaneous MB49 tumor volume changes (ii) and tumor weight (iii) in WT-SPF C57BL/6J mice (n = 5–8/group) treated with Cpd or Veh. See STAR Methods section “subcutaneous tumor model” for details. Tumor inhibition and anti-PD-1 potentiation of Enz is shown in Figures S5A and S5B. In (A)–(H), 10% DMSO in corn oil was used as Veh. (A)–(H) are mean ± SEM and are representative results replicated in two or more independent experiments. (Ai), (Ci), (Di), (Ei), (Fi), (Gii), and (Hii): two-way ANOVA followed by the Bonferroni post hoc test. In (Bi), survival curves were analyzed using Kaplan-Meier method. (Aii), (Cii), (Dii), (Eii), (Fii), (Giii), and (Hiii): an unpaired two-tailed Student’s t test was performed. The asterisk indicates p < 0.01 (**) or < 0.001 (***), n.s., not statistically significant. See also Figure S5.
Figure 6.
Figure 6.. 3-oxo-Δ4,6-LCA promotes tumor-infiltrating CD8+ T cells with stem-like properties
(A) The tumor inhibition of 3-oxo-Δ4,6-LCA depends on the lymphoid compartment of the immune system. Subcutaneous MB49 tumor volume changes (i) and tumor weight (ii) in Rag1 KO-SPF C57BL/6J mice (n = 5/group) i.p. injected with 3-oxo-Δ4,6-LCA (50 mg/kg/day, Cpd) or Veh. (B) The anti-tumor effect of 3-oxo-Δ4,6-LCA is CD8+ T cell mediated. Subcutaneous MB49 tumor volume changes (i) and tumor weight (ii) in WT-SPF C57BL/6J mice (n = 5–7/group) treated with Veh + immunoglobulin G (IgG), Cpd + IgG, Cpd + anti-mouse CD4+, Cpd + anti-mouse CD8+. (C–H) Single-cell RNA sequencing (scRNA-seq) analysis of tumor-infiltrating CD8+ T cells FACS sorted from the day 11 MB49 tumors treated with Cpd or Veh. (C) UMAP of unsupervised clustering for tumor-associated CD8+ T cells. (D) Proportion of each cell cluster in Veh and Cpd group. (E) Violin plots showing the expression levels of Ar, Sell, Tcf7, and Bcl2 in different clusters. (F) Dot plot of differentially expressed genes (shown on the x axis) in different clusters (shown on the y axis). Intracellular, intracellular regulators; Effector, effector molecules; Checkpoint, checkpoint receptors; Activation, activation-associated receptors; Migration, migration-associated and cytokine receptors. (G) Pseudotime trajectory analysis of CD8+ T cells. (H) Ontogeny inference to model the relationships between CD8+ T cell subpopulations using Monocle3. Each dot represents a single cell. Colors represent the clusters to which the cells belong. (I) 3-oxo-Δ4,6-LCA induces stem-like CD8+ T cell phenotype in vitro. Median fluorescence intensity (MFI) fold changes (FC) in CD62L (Ii) and TCF-1 (Iii) of CD8+ T cells from the Veh or Cpd (20 to 0.078 μM in a series of 2 × dilution, right to left)-treated group are shown. The promotive effect of Enz (well-known AR antagonist, as positive control) on CD8+ T cell stem-like phenotype is shown in Figures S6I and S6J. (J) 3-oxo-Δ4,6-LCA promotes tumor-infiltrating stem-like CD8+ T cells. Data in (Ji) are representative MFI FC in CD62L and TCF-1 of tumor-infiltrating CD44+CD8+ T cells from the Cpd or Veh-treated mice. Panels in (Jii) are representative histogram overlays of CD62L and TCF-1 in tumor-infiltrating CD8+ T cells isolated from the Cpd- or Veh-treated mice. See STAR Methods section “subcutaneous tumor model” for method details. In (A)–(J), 10% DMSO in corn oil was used as a Veh. (A) and (B) are mean ± SEM and are representative results replicated in two or more independent experiments. (Ai) and (Bi): two-way ANOVA followed by the Bonferroni post hoc test. (Aii), (Bii), and (Ji): an unpaired two-tailed Student’s t test. The asterisk indicates p < 0.05 (*), < 0.01 (**) or < 0.001 (***), n.s., not statistically significant. See also Figures S6 and S7.
Figure 7.
Figure 7.. The anti-tumor effect and anti-PD-1 potentiation of 3-oxo-Δ4,6-LCA rely on CD8+ T cell-specific AR signaling
(A) Breeding strategy for CD8+ T cell-specific AR-KO male mice (E8i-Cre+ARfl), and experimental schematic of tumor model performed in this figure. (B) AR expression is depleted in the AR-KO CD8+ T cells. AR expressions of CD8+ T cell purified from the littermate control mice (WT) or the CD8+ T cell-specific AR-KO male mice (E8i-Cre+ARfl) were assessed before cell transfer (i) or 14 days after cell transfer (ii) into Rag1-KO mice. (C) 3-oxo-Δ4,6-LCA (Cpd) suppresses MB49 growth in the Rag1-KO mice transferred with WT CD8+ T cells. Subcutaneous MB49 tumor volume changes (i) and tumor weight (ii) in these mice (n = 6–8/group) treated with Cpd (50 mg/kg/day) or Veh. (D) 3-oxo-Δ4,6-LCA potentiates anti-PD-1 anti-tumor efficacy in the Rag1-KO mice transferred with WT CD8+ T cells. Subcutaneous MB49 tumor volume changes (i) and tumor weight (ii) in these mice (n = 6–8/group) treated with Cpd or Veh combined with anti-PD-1. (E) The anti-tumor effect of 3-oxo-Δ4,6-LCA is abolished in the Rag1-KO mice transferred with AR-KO CD8+ T cells. Subcutaneous MB49 tumor volume changes (i) and tumor weight (ii) in these mice (n = 4–7/group) treated with Cpd or Veh. (F) The anti-PD-1 potentiation of 3-oxo-Δ4,6-LCA is abolished in the Rag1-KO mice transferred with AR-KO CD8+ T cells. Subcutaneous MB49 tumor volume changes (i) and tumor weight (ii) in these mice (n = 5–6/group) treated with Cpd or Veh combined with anti-PD-1. (G) The anti-tumor effect of 3-oxo-Δ4,6-LCA is abolished in the CD8+ T cell-specific AR-KO mice. Subcutaneous MB49 tumor volume changes (i) and tumor weight (ii) in these mice (n = 5/group) treated with Cpd or Veh combined with anti-PD-1. (H) The anti-PD-1 potentiation of 3-oxo-Δ4,6-LCA is abolished in the CD8+ T cell-specific AR-KO mice (E8i-Cre+ARfl). Subcutaneous MB49 tumor volume changes (i) and tumor weight (ii) in littermate control (n = 7–8/group) or E8i-Cre+ARfl mice (n = 4–5/group) treated with Cpd (50 mg/kg/day) or Veh combined with anti-PD-1. In (A)–(F), “WT” refers to CD8+ T cells from littermate controls in which the Ar gene is not deleted. In (C)–(H), 10% DMSO in corn oil was used as a Veh. (C)–(H) are mean ± SEM and are representative results replicated in two or more independent experiments. (Ci), (Di), (Ei), (Fi), (Gi), and (Hi): two-way ANOVA followed by the Bonferroni post hoc test. (B) (Cii), (Dii), (Eii), (Fii), (Gii), and (Hii): an unpaired two-tailed Student’s t test. The asterisk indicates p < 0.01 (**) or < 0.001 (***), n.s., not statistically significant. See also Figure S7.

References

    1. Collins SL, Stine JG, Bisanz JE, Okafor CD, and Patterson AD (2023). Bile acids and the gut microbiota: metabolic interactions and impacts on disease. Nat. Rev. Microbiol 21, 236–247. 10.1038/s41579-022-00805-x. - DOI - PubMed
    1. Cai J, Sun L, and Gonzalez FJ (2022). Gut microbiota-derived bile acids in intestinal immunity, inflammation, and tumorigenesis. Cell Host Microbe 30, 289–300. 10.1016/j.chom.2022.02.004. - DOI - PMC - PubMed
    1. Krautkramer KA, Fan J, and Bäckhed F (2021). Gut microbial metabolites as multi-kingdom intermediates. Nat. Rev. Microbiol 19, 77–94. 10.1038/s41579-020-0438-4. - DOI - PubMed
    1. Lavelle A, and Sokol H (2020). Gut microbiota-derived metabolites as key actors in inflammatory bowel disease. Nat. Rev. Gastroenterol. Hepatol 17, 223–237. 10.1038/s41575-019-0258-z. - DOI - PubMed
    1. Skelly AN, Sato Y, Kearney S, and Honda K (2019). Mining the microbiota for microbial and metabolite-based immunotherapies. Nat. Rev. Immunol 19, 305–323. 10.1038/s41577-019-0144-5. - DOI - PubMed