. 2025 Jun;642(8067):431-441.
doi: 10.1038/s41586-025-08980-6. Epub 2025 Apr 16.

Mitochondrial metabolism sustains DNMT3A-R882-mutant clonal haematopoiesis

Affiliations

Mitochondrial metabolism sustains DNMT3A-R882-mutant clonal haematopoiesis

Malgorzata Gozdecka et al. Nature. 2025 Jun.

Abstract

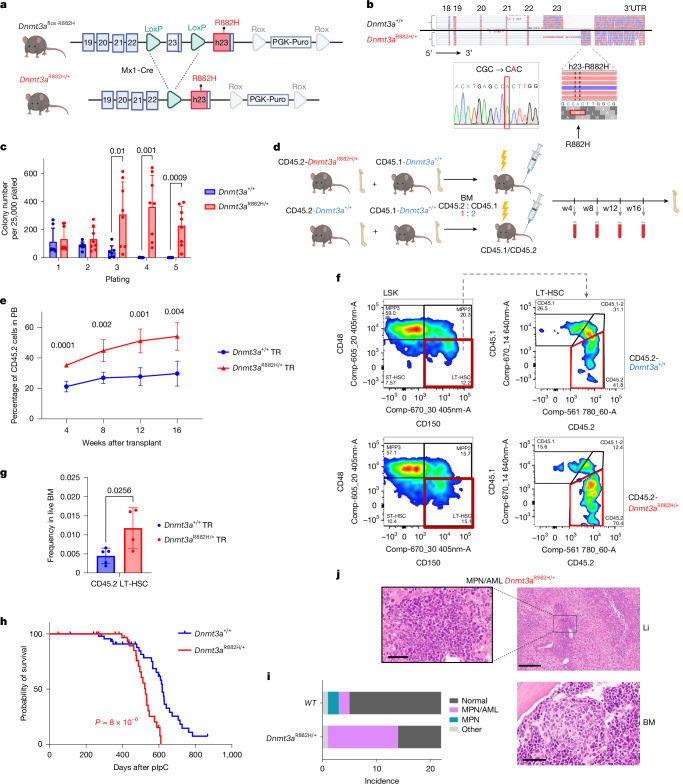
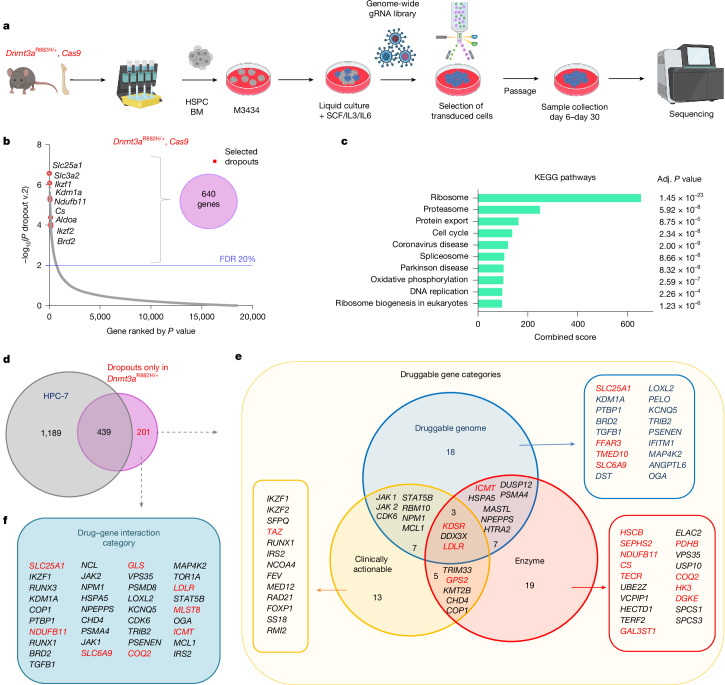
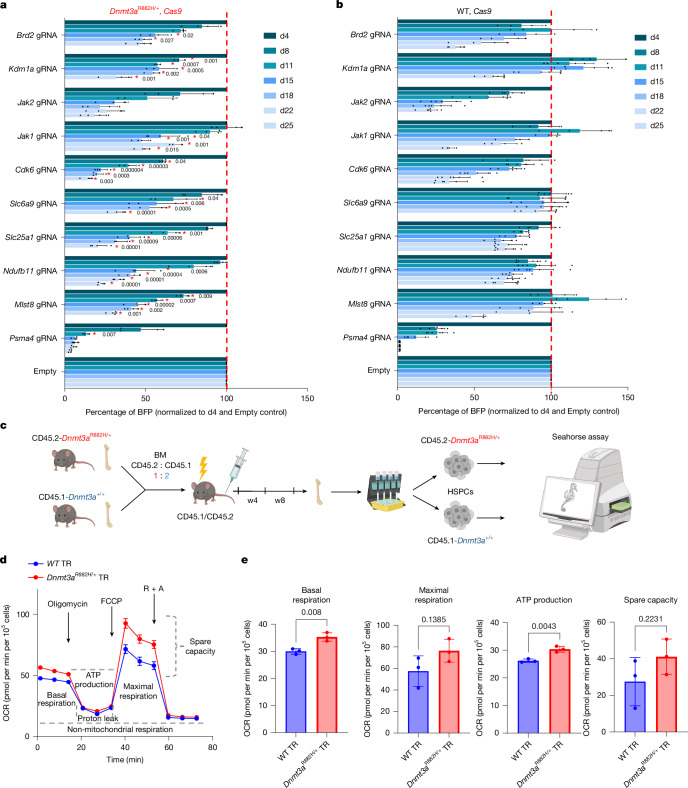
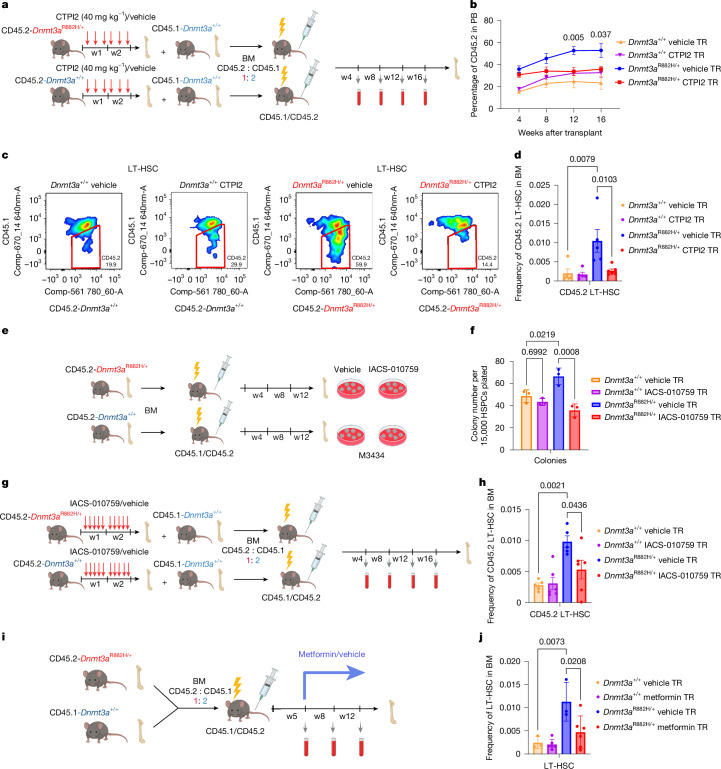
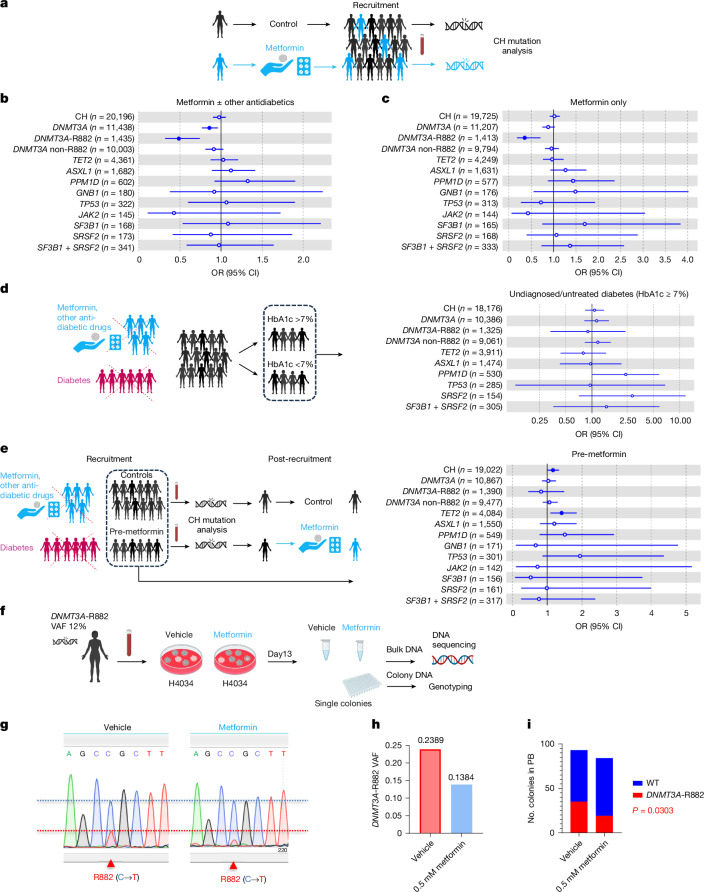
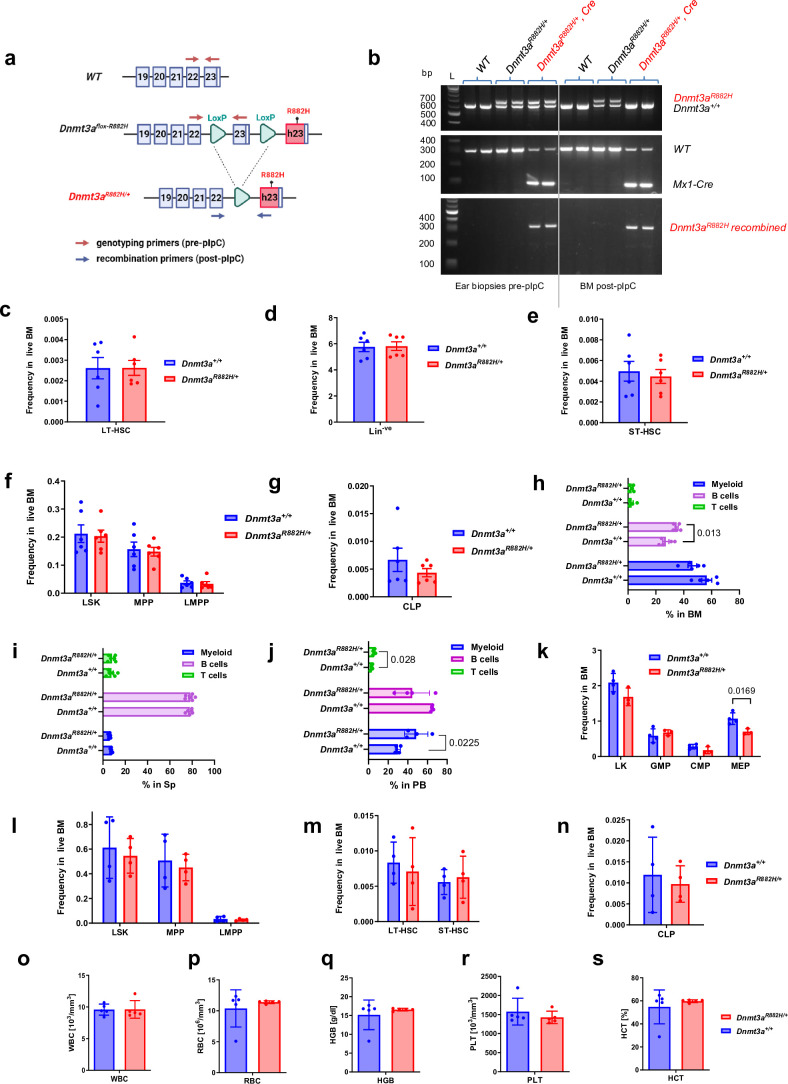
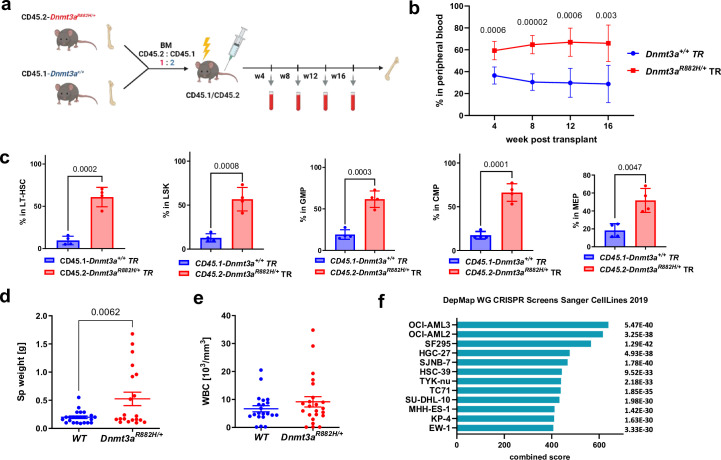
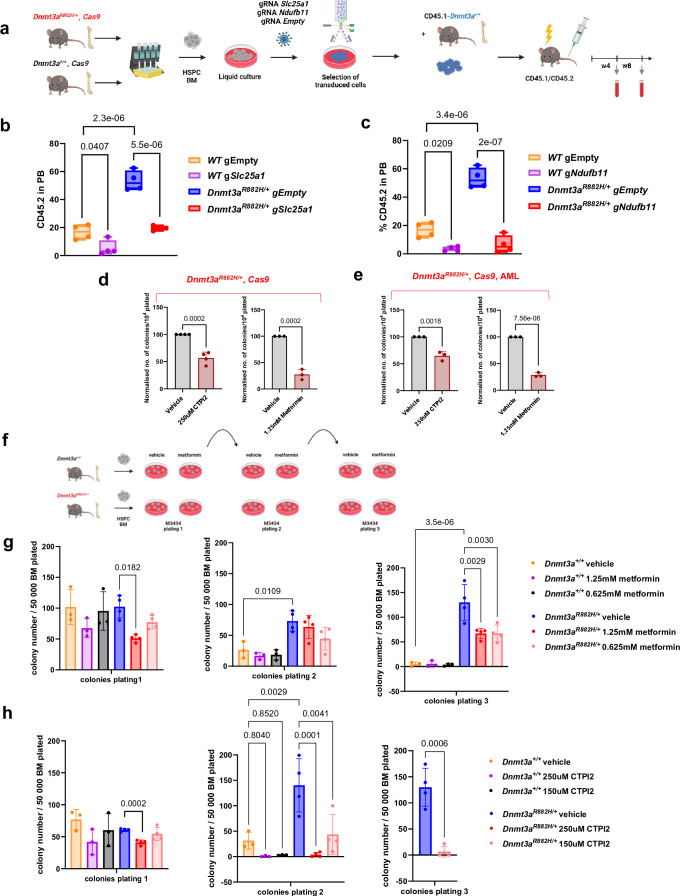
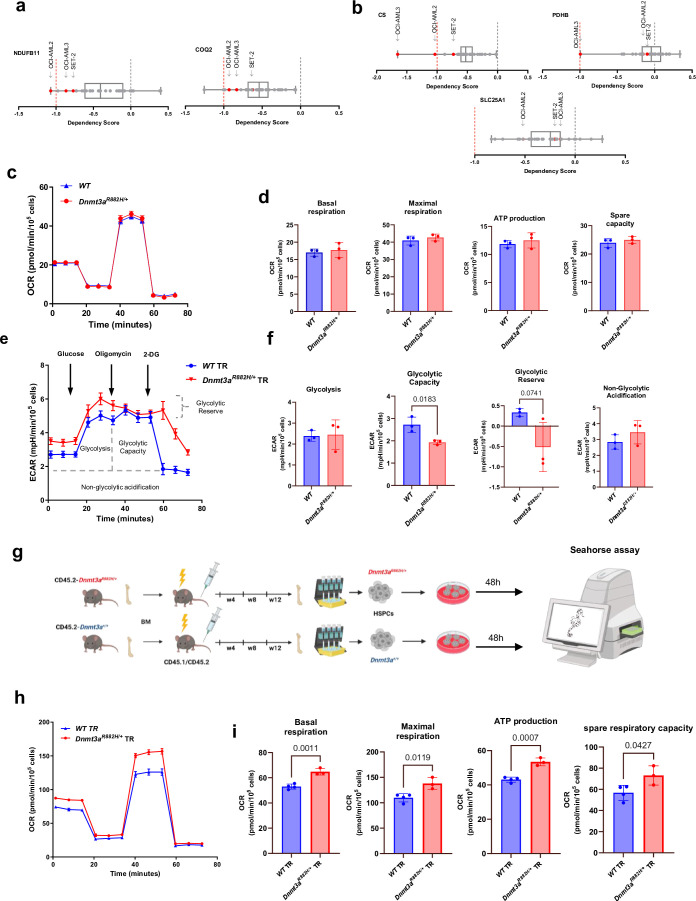
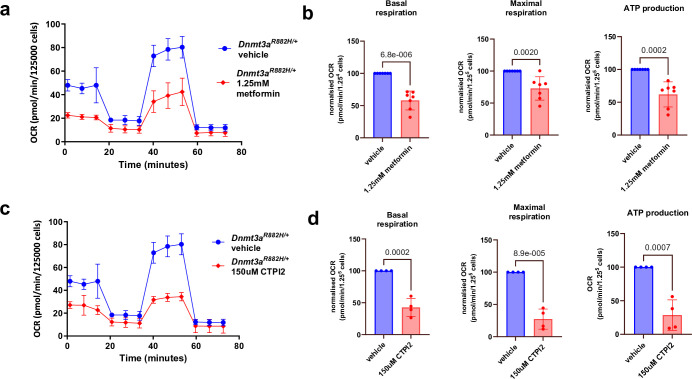
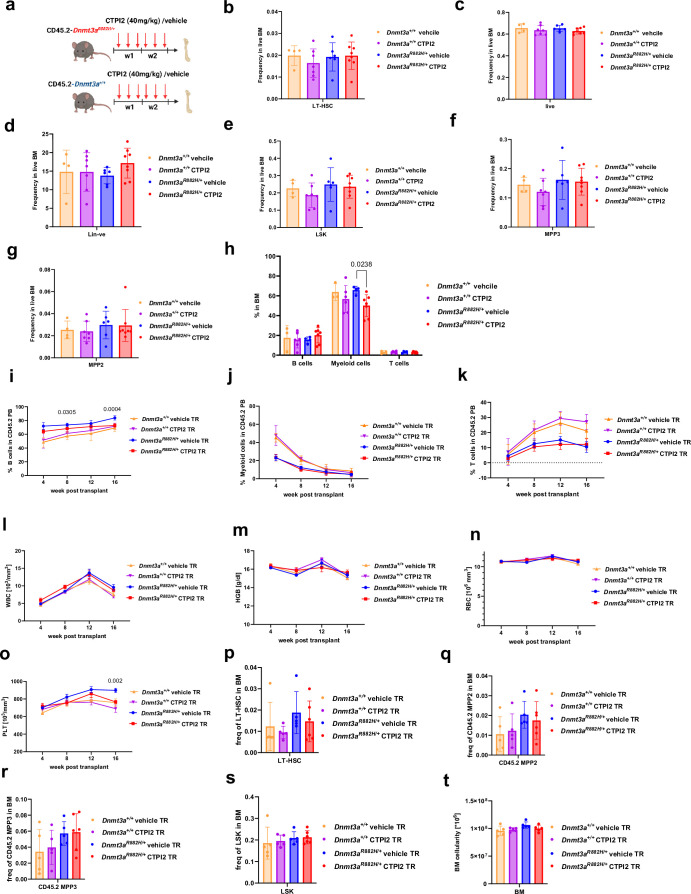
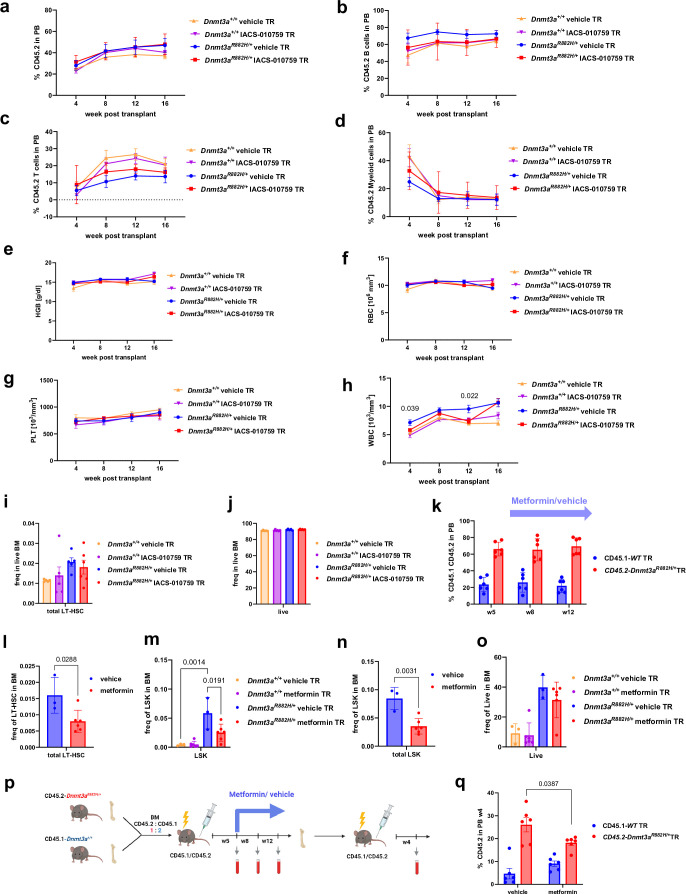
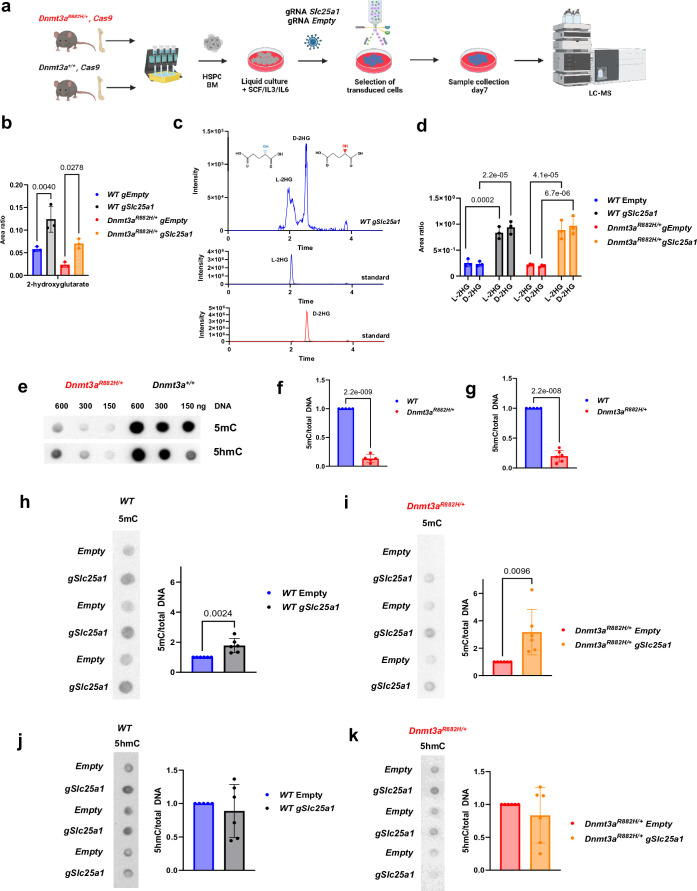
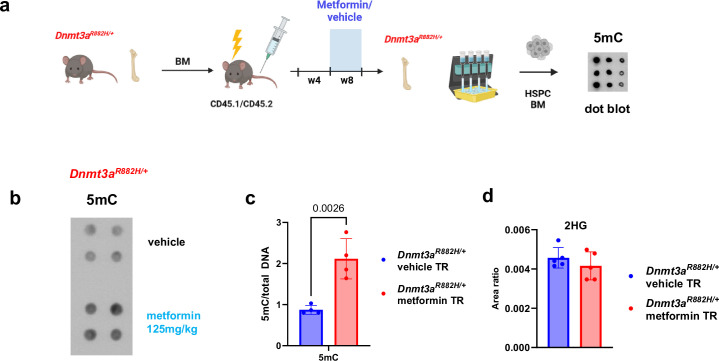
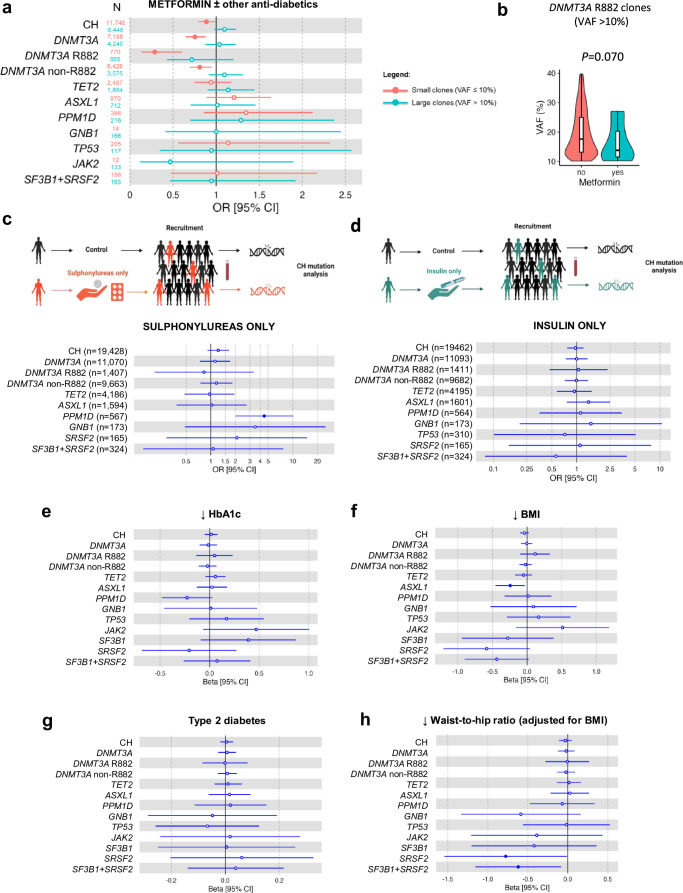
Somatic DNMT3A-R882 codon mutations drive the most common form of clonal haematopoiesis (CH) and are associated with increased acute myeloid leukaemia (AML) risk1,2. Preventing expansion of DNMT3A-R882-mutant haematopoietic stem/progenitor cells (HSPCs) may therefore avert progression to AML. To identify DNMT3A-R882-mutant-specific vulnerabilities, we conducted a genome-wide CRISPR screen on primary mouse Dnmt3aR882H/+ HSPCs. Among the 640 vulnerability genes identified, many were involved in mitochondrial metabolism, and metabolic flux analysis confirmed enhanced oxidative phosphorylation use in Dnmt3aR882H/+ versus Dnmt3a+/+ (WT) HSPCs. We selected citrate/malate transporter Slc25a1 and complex I component Ndufb11, for which pharmacological inhibitors are available, for downstream studies. In vivo administration of SLC25A1 inhibitor CTPI2 and complex I inhibitors IACS-010759 and metformin suppressed post-transplantation clonal expansion of Dnmt3aR882H/+, but not WT, long-term haematopoietic stem cells. The effect of metformin was recapitulated using a primary human DNMT3A-R882 CH sample. Notably, analysis of 412,234 UK Biobank participants showed that individuals taking metformin had a markedly lower prevalence of DNMT3A-R882-mutant CH, after controlling for potential confounders including glycated haemoglobin, diabetes and body mass index. Collectively, our data propose modulation of mitochondrial metabolism as a therapeutic strategy for prevention of DNMT3A-R882-mutant AML.


Conflict of interest statement

Competing interests: G.S.V. is a consultant for STRM.BIO and receives a research grant from AstraZeneca. S.W., J.M. and M.A.F. are current employees and/or stockholders of AstraZeneca. K.T. has received consultancy fees, stock options and research funding from Storm Therapeutics Ltd., Cambridge, UK. K.T. is a cofounder of Btwo3 Therapeutics LLC, USA and TEP Therapeutics LLC, USA. The other authors declare no competing interests.

Figures

Fig. 1
Fig. 1. Dnmt3aR882H/+ HSPC shows self-renewal phenotype, enhanced BM repopulation and progression to MPN/AML.
a, Structure of the Dnmt3aR882H conditional allele. b, RNA sequencing reads from Dnmt3a+/+ and Dnmt3aR882H/+ HSPCs were aligned to mouse exons and human exon 23 with DNMT3A-R882H mutation. Sanger sequencing was performed on cDNA of Dnmt3aR882H/+ amplified with primers detecting human exon 23. Similar data were observed for n = 3 mice per genotype. c, Serial replating of BM-derived colonies from Dnmt3a+/+ (n = 7 mice) and Dnmt3aR882H/+ (n = 8 mice). d, Schematic representation of BM competitive transplant strategy of CD45.2-WT and CD45.2-Dnmt3aR882H/+ transplanted together with CD45.1 competitor. e, Proportion of Dnmt3a+/+ (n = 5 mice) and Dnmt3aR882H/+ (n = 4 mice) cells in PB post-transplant. f,g, Fluorescence-activated cell sorting plots of LT-HSC (Lin−ve, Sca1+, c-Kit+, Cd48Cd150+) and proportion of Dnmt3a+/+ (n = 5 mice) and Dnmt3aR882H/+ (n = 4 mice) transplanted cells in LT-HSC (f) with quantification (g). h, Kaplan–Meier survival curves for Dnmt3aR882H/+ (n = 35) and control (n = 31) mice; P by log-rank (Mantel–Cox) test. i, Histopathological diagnoses of moribund mice. Bars depict cancer/normal diagnosis per genotype/total mice with available histology data (n = 44 mice). j, Characteristic histology from one mouse with MPN/AML. Myeloid cell/AML infiltration in the liver (Li) and blasts in the setting of myeloid hyperplasia and a hypercellular marrow are shown. Similar data were observed for 13 Dnmt3aR882H/+ mice. w, week. Scale bars, 300 µm for inset (Li), 50 µm for others. In ce, g and i, the mean ± s.d. is shown; P by two-sided t-test for comparisons between Dnmt3aR882H/+ and WT. Schematics in a,d were created using BioRender (https://biorender.com). Source data
Fig. 2
Fig. 2. Whole-genome CRISPR screen identifies Dnmt3aR882H/+ drug target candidates.
a, Schematic representation of CRISPR-screen strategy. b, Result of the whole-genome CRISPR screen in Dnmt3aR882H/+ HSPC. Selected highly significantly depleted genes are listed. False discovery rate (FDR) was calculated using the MAGeCK statistical package. c, KEGG pathway analysis of 640 depleted genes using Enrichr, reporting P values adjusted (adj.) for several comparisons. d, Venn diagram of Dnmt3aR882H/+ dropouts and HPC-7 dropouts. e,f, Classification of 201 dropout genes present only in Dnmt3aR882H/+ cells into potential ‘druggable’ gene categories (e) and drug–gene interaction categories, as defined by DGIdb and a literature search (f). Three categories are depicted in e. All categories in f can be found in Supplementary Table 4, and drug–gene categories are shown in Supplementary Table 5. Schematic in a was created using BioRender (https://biorender.com). Source data
Fig. 3
Fig. 3. Enhanced mitochondrial respiration in transplanted Dnmt3aR882H/+.
a,b, Proliferation of Dnmt3aR882H/+ (a) and WT (b) HSPCs after editing of the indicated gene. The BFP-positive fraction was compared with the non-transduced population and normalized to day 4 and Empty vector for each gRNA. For a and b, the mean ± s.d. is shown; n = 3 biological replicates for Kdm1a gRNA and n = 4 biological replicates for the remining gRNAs in Dnmt3aR882H/+. n = 4 biological replicates for Mlst8, Jak1, Brd2 gRNAs and n = 6 biological replicates for the remining gRNAs in WT. Asterisk indicates significant depletion in Dnmt3aR882H/+ versus WT HSPCs calculated for each day. P by two-sided t-test. c, Schematic representation of the experimental setup for mitochondrial respiration analysis of WT and Dnmt3aR882H/+ HSPCs extracted eight weeks post-transplantation performed with the Seahorse analyser. d, Example of OCR in transplanted WT and Dnmt3aR882H/+ HSPCs, measured using a Seahorse extracellular flux analyser; mean ± s.e.m. n = 18 for Dnmt3aR882H/+, n = 15 for WT representing three independent biological replicates, for each Dnmt3aR882H/+ performed in six replicates, for WT performed in four, five and six replicates respectively. R + A indicates rotenone and antimycin A. e, Basal respiration, maximal respiration, ATP production and spare respiration capacity were calculated; mean ± s.d. P by two-sided t-test. n = 3 biological replicates per genotype. Similar results were obtained when Dnmt3aR882H/+ versus WT cells were transplanted separately into recipients (Extended Data Fig. 4g–i). *Higher depletion in Dnmt3aR882H/+ versus WT. d, day. Schematic in c was created using BioRender (https://biorender.com). Seahorse picture in c adapted with permission from K. Gozdecki. Source data
Fig. 4
Fig. 4. CTPI2 and complex I inhibitors revert clonal advantage of Dnmt3aR882H/+ LT-HSC.
a, Scheme of experimental approach. b, The proportion of CD45.2 cells in PB, normalized to the proportion of injected CD45.2 cells. The mean ± s.e.m. is shown; for Dnmt3aR882H/+ CTPI2, n = 6, for remining groups, n = 5 mice; P by two-sided t-test between Dnmt3aR882H/+ vehicle and Dnmt3aR882H/+ CTPI2 is shown. c, The proportion of transplanted cells in LT-HSC by flow cytometry at week 16. One sample per group is shown; similar results were observed for n  =  5. d, Frequencies of CD45.2-LT-HSC in BM at week 16, normalized to the proportion of injected LT-HSC. The mean ± s.e.m. is shown; for Dnmt3aR882H/+ CTPI2, n = 6 mice, for remining groups, n = 5 mice. e, Schematic summary of the experimental approach. HSPCs isolated 12 weeks post-transplant were plated in semisolid media with 100 nM IACS-010759/vehicle for seven days. f, Quantified colonies; the mean ± s.d. is shown; n = 3 mice per group. g, Schema of experimental approach for IACS-010759/vehicle treatment. h, Frequencies of CD45.2 LT-HSC in mouse BM at endpoint. The mean ± s.e.m. is shown; n = 5 mice for both vehicle groups, and n = 6 for both IACS-010759 groups. i, Schematic representation of metformin treatment model. Dnmt3aR882H/+ were mixed with WT BM cells in 1:2 proportion and transplanted into lethally irradiated recipient mice. Metformin (125 mg kg−1) or vehicle treatment started from week 5 for six weeks. j, Frequencies of transplanted Dnmt3aR882H/+ and WT LT-HSC in BM; the mean ± s.d. is shown; n = 3 mice for vehicle group, and n = 6 mice per metformin group. P in d, f, h, j by one-way ANOVA with Tukey correction. Schematics in a,e,g,i were created using BioRender (https://biorender.com). Source data
Fig. 5
Fig. 5. Metformin curtails DNMT3A-R882 CH in humans.
a, Schematic representation of the UKB analysis. b, Association between metformin and CH risk. In total, 11,190 individuals taking metformin or metformin in combination with other antidiabetic medications and 401,044 individuals not on metformin were analysed. c, Association between metformin and CH risk. Only individuals taking metformin were included in the analysis. In total, 5,644 individuals on metformin only and 398,712 individuals not on any form of antidiabetic medications were analysed. d, Association between undiagnosed/untreated diabetes and overall CH or gene-specific CH risk. HbA1c > 7% (equivalent of 53 mmol mol−1) was used to identify individuals with undiagnosed/untreated diabetes. Diabetic individuals and individuals taking metformin or other antidiabetic medications at recruitment were excluded. In total, 374,873 individuals with HbA1c data available were included (1,195 individuals with HbA1c > 7% and 373,642 with HbA1c ≤ 7%). e, Association between post-recruitment metformin intake and CH risk. Diabetic individuals and individuals taking metformin or other antidiabetic medications at recruitment were excluded. In total, 3,568 individuals who started on metformin at some time after recruitment (post-recruitment metformin) and 389,153 controls were included for analysis. In be, measures of centre represent the ORs, and the error bars represent the lower and upper bound of the 95% CI of the ORs. ORs and two-sided unadjusted P values were derived from logistic regression model with all CH or gene-specific CH as outcome, and with age, sex, smoking and the first four genetic principal components as covariates. Significant P values (<0.05) are indicated with full blue circles. f, Experimental strategy for testing the effect of metformin on DNMT3A-R882 clonal growth (versus WT). g,h, Sanger sequencing (g) and next-generation sequencing (h) of DNA collected from bulk colonies. i, Comparison of the proportion of WT versus DNMT3A-R882 colonies in metformin- versus vehicle-treated cells (P by two-sided Chi-square test). Schematics in a,d,e,f were created using BioRender (https://biorender.com). Source data
Extended Data Fig. 1
Extended Data Fig. 1. Characterisation of Dnmt3aR882H/+ mouse model.
(a) Schematic representation of genotyping (red arrows) and recombination primers (blue arrows) binding to WT, Dnmt3aflox-R882H and Dnmt3aR882H alleles. (b) Genotyping confirmed the presence of the Dnmt3aR882H allele pre-pIpC in both Dnmt3aR882H/+ and Dnmt3aR882H/+ Cre genotypes (top panel, left half). After Cre induction with pIpC the Dnmt3aR882H allele completely disappears from Dnmt3aR882H/+ Cre mice, indicating complete recombination in BM (top panel, write half). Mid panel illustrates the presence of the Mx1-Cre allele in Dnmt3aR882H/+ Cre genotypes. Lower panel shows recombination in Dnmt3aR882H/+, Cre mice post-pIpC. A low level of recombination is also observed in Dnmt3aR882H/+, Cre mice pre-pIpC (lower panel, left half). However, the full recombination was not observed pre-pIpC Dnmt3aR882H/+ Cre, indicated by the presence of Dnmt3aR882H allele (top panel, left half). (c) Frequency of LT-HSC, (d) Lin-ve, (e) ST-HSC, (f) LSK, MPP, LMPP and (g) CLP progenitors in BM of Dnmt3aR882H/+ and WT mice 6-weeks post-pIpC, n = 6 mice per group in c-g (h) Proportion of B, T and myeloid cells in BM, n = 5 mice per group and (i) Sp of Dnmt3aR882H/+ and WT mice 6-weeks post-pIpC, n = 6 mice per group. The mean ± SEM is shown in c-i (j) Proportion of myeloid, B and T cells in PB, n = 4 mice per group. (k) Frequencies of LK, GMP, CMP, MEP, n = 4 mice for WT and n = 3 mice for Dnmt3aR882H/+ (l) Frequencies of LSK, MPP, LMPP (m) LT-HSC, ST-HSC and (n) CLP in BM of Dnmt3aR882H/+ and WT mice 1-year post-pIpC for j-n. The mean ± SD is shown, n = 4 mice per group for (l-n). (o) WBC, (p) RBC, (q) HGB, (r) PLT, (s) HCT of Dnmt3aR882H/+ and WT mice 20 weeks post-pIpC, n = 5 mice per group for (o-s). P in (h, j, k) by two-sided t-test. MPP, multipotent progenitors; LMPP, lymphoid primed multipotent progenitors; ST-HSC, short-term HSC; GMP, granulocyte-monocyte progenitors; CMP, common myeloid progenitors, MEP megakaryocyte-erythroid progenitors; CLP, common lymphoid progenitors; RBC, red blood cells. Schematic in a was created using BioRender (https://biorender.com). Source data
Extended Data Fig. 2
Extended Data Fig. 2. Enhanced competitive BM repopulation of Dnmt3aR882H/+.
(a) Schematic representation of the experimental approach for Dnmt3aR882H/+ (CD45.2) versus WT (CD45.1) competitive transplant. (b) Proportion of Dnmt3aR882H/+ and WT cells in PB of recipients post-transplant. The mean ± SD is shown, n = 8 mice, P by two-sided t-test. P displayed for Dnmt3aR882H/+ TR vs WT TR comparison. (c) Proportion of Dnmt3aR882H/+ and WT cells in LT-HSC, LSK, GMP, CMP, MEP in BM at end point. The mean ± SD is shown, n = 4 mice, P by two-sided t-test. (d) Spleen weights n = 23 for WT and n = 20 for Dnmt3aR882H/+ mice and (e) WBC from WT (n = 21) and Dnmt3aR882H/+ (n = 23) mice at aging end point. The mean ± SEM is shown, P by two-sided t-test. (f) Dnmt3aR882H/+ vulnerability genes are highly enriched for dropouts observed in human DNMT3A-mutant cell lines. Enrichment analysis was performed with the Enrichr online software. Schematic in a was created using BioRender (https://biorender.com). GMP, granulocyte-monocyte progenitor; CMP, common myeloid progenitor. Source data
Extended Data Fig. 3
Extended Data Fig. 3. Effect of selected inhibitors on Dnmt3aR882H/+ self-renewal potential.
(a) Experimental schema used to determine the impact of gene knockout on competitive repopulation potential of Dnmt3aR882H/+ vs Dnmt3a+/+ HSPCs (b-c) Proportion of CD45.2 (WT and Dnmt3aR882H/+) cells in PB upon (b) Slc25a1 and (c) Ndufb11 knockout. n = 4 mice per group, box-and-whiskers plots displaying median and interquartile range (IQR), with whiskers to min and max values. P by one-way-ANOVA with Tukey correction. (d) Colony formation of Dnmt3aR882H/+, n = 4 mice per condition in left panel and n = 3 mice per condition for right panel, and (e) leukaemic Dnmt3aR882H/+ HSPCs plated in the presence of selected inhibitors. Colony number was normalised to vehicle control. The mean ± SD is shown, n = 3 mice, P by two-sided t-test. (f) Schematic representation of colony replating strategy. (g) Colony number at each plating during metformin and (h) CTPI2 treatment. n = 3 mice for WT and n = 4 for Dnmt3aR882H/+ in each condition in g-h, the mean ± SD is shown, P by one way ANOVA, and in h plating 3 by two-sided t-test. Schematics in a,f were created using BioRender (https://biorender.com). Source data
Extended Data Fig. 4
Extended Data Fig. 4. Cellular respiration in homoeostasis and transplantation setting.
(a) CRISPR dependency scores for NDUFB11, COQ2, (b) Similar score for CS, PDHB, SLC25A1 across all myeloid cancer cell lines. Arrows identify the DNMT3A-mutated cell lines. (a-b) box-and-whiskers plots displaying median and interquartile range (IQR), with whiskers to min and max values. Data for a-b were obtained from DepMap, n = 37 cell lines. (c) Oxygen consumption rate in primary WT and Dnmt3aR882H/+ HSPCs, was measured using a Seahorse analyser, mean ± SEM is shown. n = 11 WT and n = 12 Dnmt3aR882H/+, representing 3 independent biological replicates per genotype each performed in 4 replicates for Dnmt3aR882H/+ and in 3, 4, and 4 replicates for WT. One of three independent experiments are shown. (d) Basal respiration, maximal respiration, ATP-production, and spare respiration capacity; mean ± SD is shown. n = 3 biological replicates per genotype. (e) The extracellular acidification rate (ECAR) was measured in transplanted WT and Dnmt3aR882H/+ HSPCs by the Seahorse analyser, mean ± SEM is shown. n = 7 for WT and n = 18 Dnmt3aR882H/+, 3 biological replicates per genotype were performed in 6 replicates for Dnmt3aR882H/+, and 3, 3 and 1 replicate for WT. One of three independent experiments are shown. (f) Glycolysis, glycolytic capacity, glycolytic reserve, and non-glycolytic acidification were compared between transplanted WT and Dnmt3aR882H/+ HSPCs. Mean ± SD is shown. P by two-sided t-test. n = 3 biological replicates per genotype. (g) Schematic representation of the experimental setup. WT and Dnmt3aR882H/+ BM were transplanted separately into recipient mice. HSPCs were extracted 12 weeks post-transplantation, cells were plated in culture for 48 h and analysed with Seahorse analyser. (h) OCR in transplanted WT and Dnmt3aR882H/+ HSPCs, was measured using a Seahorse extracellular flux analyser, mean ± SEM. n = 24 for WT and n = 18 for Dnmt3aR882H/+, indicating four and three biological replicates respectively, each performed in 6 replicates. (i) Basal respiration, maximal respiration, ATP-production and spare respiration capacity was calculated; mean ± SD. P by two-sided t-test. n = 4 biological replicates for WT and 3 biological replicates for Dnmt3aR882H/+. Schematic in g was created using BioRender (https://biorender.com). Seahorse picture in g adapted with permission from K. Gozdecki. Source data
Extended Data Fig. 5
Extended Data Fig. 5. The effect of metformin and CTPI2 on mitochondrial respiration in Dnmt3aR882H/+HSPCs.
(a) Oxygen consumption rate in Dnmt3aR882H/+ treated in vitro with 1.25 mM metformin for 2 h, mean ± SD. n = 11 for vehicle and n = 12 for metformin, indicating three biological replicates per condition, for metformin performed in 4 replicates and for vehicle, two performed in 3 and one in 4 replicates. One of three independent experiments is shown. (b) Basal, maximal respiration and ATP-production were compared between metformin and vehicle treatment, mean ± SD. P by two-sided t-test. Data were normalised to each vehicle control. n = 7 biological replicates per condition from three independent experiments. (c) Oxygen consumption rate in Dnmt3aR882H/+ treated with 150uM of CTPI2 for 2 h, mean ± SD. n = 11 for vehicle and n = 10 for CTPI2, indicating three biological replicates per condition, for CTPI2 performed in 4, 3 and 3 replicates and for vehicle, two performed in 3 and one in 4 replicates. One of two independent experiments is shown (d) Basal, maximal respiration and ATP-production were compared between CTPI2 and vehicle, mean ± SD, P by two-sided t-test. Data were normalised to each vehicle control. n = 4 biological replicates per condition from two independent experiments. Source data
Extended Data Fig. 6
Extended Data Fig. 6. Characterisation of the blood progenitor and differentiated cell compartments post-CTPI2 treatment.
(a) Schematic representation of the treatment of primary mice with CTPI2. (b) Frequencies of LT-HSC (c) live, (d) Lin-ve, (e) LSK, (f) MPP3 (g) MPP2 and (h) proportion of differentiated cells in primary WT and Dnmt3aR882H/+ mice treated with CTPI2/vehicle for 2 weeks. Mean ± SD is shown, in (b-g) n = 4 for WT vehicle, n = 7 for WT CTPI2, n = 6 for Dnmt3aR882H/+, and n = 8 mice for Dnmt3aR882H/+ CTPI2 group. In (h) n = 3 for WT vehicle, n = 6 for WT CTPI2, n = 4 for Dnmt3aR882H/+, and n = 7 mice for Dnmt3aR882H/+ CTPI2 group. (i) PB proportion of B (j) Myeloid (k) T cells in CTPI2/vehicle treated and transplanted CD45.2-WT and Dnmt3aR882H/+. (l) WBC, (m) HGB, (n) red blood cells (RBC), (o) PLT in CTPI2/vehicle treated and transplanted CD45.2-WT and Dnmt3aR882H/+. (p) Frequencies of total (CD45.1 and CD45.2) LT-HSC, (q) MPP2, (r) MPP3, (s) LSK and (t) BM cellularity in CTPI2/vehicle treated and transplanted WT and Dnmt3aR882H/+ at end point. Mean ± SD is shown, n = 6 for Dnmt3aR882H/+ CTPI2 and n = 5 mice for remining groups for (i-t). P by two-sided t-test, in (h), (i) and (o), P is displayed for comparison of Dnmt3aR882H/+ vehicle TR vs Dnmt3aR882H/+ CTPI2 TR. Schematic in a was created using BioRender (https://biorender.com). Source data
Extended Data Fig. 7
Extended Data Fig. 7. Characterisation of the blood progenitor and differentiated cell compartments post-IACS-010759 treatment.
(a) Proportion of CD45.2 (b) B (c) T and (d) Myeloid cells in PB of IACS-010759/vehicle treated and transplanted CD45.2-WT and Dnmt3aR882H/+ recipient mice (e) HGB, (f) red blood cells (RBC), (g) PLT and (h) WBC in IACS-010759/vehicle treated and transplanted WT and Dnmt3aR882H/+. (a-d) Mean ± SD is shown, n = 6 mice for IACS-010759 and n = 5 mice for vehicle groups. P by two-sided t-test, in (h) P displayed for comparison of Dnmt3aR882H/+ vehicle TR vs Dnmt3aR882H/+ IACS-010759 TR. (i) Frequencies of total (CD45.1 and CD45.2) LT-HSC and (j) live cells in BM of IACS-010759/vehicle treated and transplanted WT and Dnmt3aR882H/+. (e-j) Mean ± SEM is shown, n = 5 mice for vehicle and n = 6 mice for IACS-010759 groups. (k) Proportion of transplanted Dnmt3aR882H/+ and WT cells in PB before (w5) and during metformin treatment. Mean ± SD is shown, n = 6 mice. (l) Frequencies of total LT-HSC in BM (m) Frequencies of TR Dnmt3aR882H/+ and WT LSK in BM, (n) total frequencies of LSK in BM (o) Frequencies of live Dnmt3aR882H/+ and WT TR cells in BM, the mean ± SD is shown. For (l-o) n = 3 mice for vehicle group and n = 6 mice per metformin group. P in m by one-way ANOVA with Tukey correction; P in l and n by two-sided t-test. (p) Secondary transplantation strategy. (q) Quantification of the proportion of WT and Dnmt3aR882H/+ cells in PB of mice treated with metformin/vehicle post transplantation. Mean ± SEM is shown, n = 6 mice per group, P by two-sided t-test. Schematic in p was created using BioRender (https://biorender.com). Source data
Extended Data Fig. 8
Extended Data Fig. 8. Increased L,D-2HG levels and 5mC in Dnmt3aR882H/+ upon Slc25a1 knockout.
(a) Schematic representation of experimental strategy. (b) The levels of 2HG in Slc25a1 ko/control WT and Dnmt3aR882H/+ cells. Mean ± SD is shown, n = 3 biological replicates per group, P by one-way ANOVA. (c) Chromatogram indicating L and D-2HG in exemplary WT sample upon knockout of Slc25a1. L-2HG and D-2HG standards are presented below. Similar data were observed for n = 3 biological replicates. (d) Levels of L-2HG and D-2HG in each sample by LC-MS. Mean ± SD is shown, n = 3 biological replicates per group, P by two-way ANOVA. (e) DNA methylation and hydroxymethylation in WT and Dnmt3aR882H/+ HSPCs by dot blot. (f) Quantification of 5mC, n = 5 biological replicates per group, and (g) 5hmC levels in Dnmt3aR882H/+ relatively to WT. n = 5 for WT and n = 6 biological replicates for Dnmt3aR882H/+. (h) Dot blot and quantification of 5mC levels in WT Slc25a1 null cells compared to WT Empty controls, and (i) Dnmt3aR882H/+ Slc25a1 null cells compared to Dnmt3aR882H/+ Empty controls. (j) 5hmC levels in WT and (k) Dnmt3aR882H/+ compared to Empty controls. (f-k) Mean ± SD is shown, in (j) n = 5 biological replicates for WT Empty, and in remining groups in (h-k) n = 6 biological replicates, P by two-sided t-test. Schematic in a was created using BioRender (https://biorender.com). Source data
Extended Data Fig. 9
Extended Data Fig. 9. Increased 5mC in Dnmt3aR882H/+ HSPCs treated with metformin in vivo.
(a) Schematic representation of the experimental strategy. (b) 5mC dot blot and (c) quantification. (d) 2HG levels by targeted LC-MS. Mean ± SD is shown, n = 4 biological replicates per group, in b -each dot represents different biological replicate. P by two-sided t-test. Schematic in a was created using BioRender (https://biorender.com). Source data
Extended Data Fig. 10
Extended Data Fig. 10. Lack of association of sulphonylureas and insulin administration or genetically predicted glycemic-related traits with DNMT3A-R882 CH.
(a) Association between metformin and overall CH or gene-specific CH risk. CH split by small clone (VAF ≤ 10%) and large clone (VAF > 10%). In total, 11,190 individuals taking metformin or metformin in combination with other antidiabetic medications and 401,044 individuals not on metformin were included in the analysis. (b) Distribution of large DNMT3A-R882 clones (VAF > 10%) among 15 individuals taking metformin or metformin in combination with other anti-diabetic medications and 650 individuals not on metformin. The P value was derived using linear regression with VAF as outcome and metformin as predictor, adjusted for age, sex, smoking status, and first four genetic principal components (PCs). Boxplots represent the median, first and third quartiles, with whiskers representing 1.5 times the interquartile range. (c) Association between sulphonylureas (glibenclamide, gliclazide, glipizide, glimepiride, tolbutamide) and overall CH or gene-specific CH risk. Only individuals taking sulphonylureas as the only form of anti-diabetic medication were included in the analysis. In total, 571 individuals on sulphonylureas only and 398,712 individuals not on anti-diabetic medications were included for analysis. We observed significant association for PPM1D CH: OR = 4.49 [95 CI% = 1.99-10.12], P = 0.00029. (d) Association between insulin and overall CH or gene-specific CH risk. Only individuals taking insulin as the only form of anti-diabetic medication were included in the analysis. In total, 1,488 individuals on insulin only and 398,712 individuals not on anti-diabetic were included for analysis. For (a,c,d) odds ratios and two-sided unadjusted P values were derived from logistic regression model with all CH or gene-specific CH as outcome, and with age, sex, smoking, and the first four genetic principal components as covariates. Measures of centre represent the odds ratios, and the error bars represent the lower and upper bound of the 95% confidence interval of the odds ratios. Significant P values (<0.05) are indicated with full circles. (e-h) MR analyses of the effect of HbA1c, BMI, T2D, BMI-adjusted WTHR (exposure) on overall CH and gene-specific CH risk (outcome). In total, 392,186 individuals not on metformin at recruitment and passed sample-level QC for genotyping array (excluded samples with genotype missingness > 5%, samples with non-XX or -XY chromosome configuration, and samples with high heterozygosity) were included for analysis here. Measures of centre represent the beta coefficients, and the error bars represent the lower and upper bound of the 95% confidence interval of the beta coefficients. Beta coefficients and unadjusted P values were derived from inverse variance weighting method. Significant P values (<0.05) are indicated with full circles. Schematics in c,d were created using BioRender (https://biorender.com). Source data

Similar articles

Cited by

References

    1. Gu, M. et al. Multiparameter prediction of myeloid neoplasia risk. Nat. Genet.55, 1523–1530 (2023). - PMC - PubMed
    1. Weeks, L. D. et al. Prediction of risk for myeloid malignancy in clonal hematopoiesis. NEJM Evid.10.1056/evidoa2200310 (2023). - PMC - PubMed
    1. Jaiswal, S. et al. Age-related clonal hematopoiesis associated with adverse outcomes. N. Engl. J. Med.371, 2488–2498 (2014). - PMC - PubMed
    1. Genovese, G. et al. Clonal hematopoiesis and blood-cancer risk inferred from blood DNA sequence. N. Engl. J. Med.371, 2477–2487 (2014). - PMC - PubMed
    1. Xie, M. et al. Age-related mutations associated with clonal hematopoietic expansion and malignancies. Nat. Med.20, 1472–1478 (2014). - PMC - PubMed

MeSH terms

LinkOut - more resources