. 2025 Apr 10;53(7):gkaf297.
doi: 10.1093/nar/gkaf297.

Systematic genetic perturbation reveals principles underpinning robustness of the epigenetic regulatory network

Affiliations

Systematic genetic perturbation reveals principles underpinning robustness of the epigenetic regulatory network

Thomas Stuart Wilson et al. Nucleic Acids Res. .

Abstract

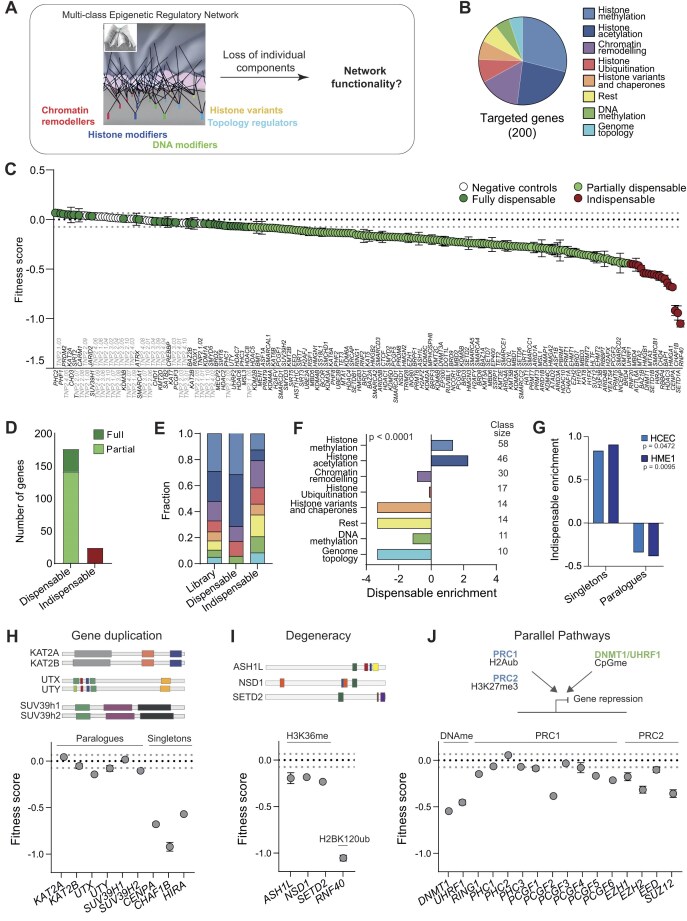
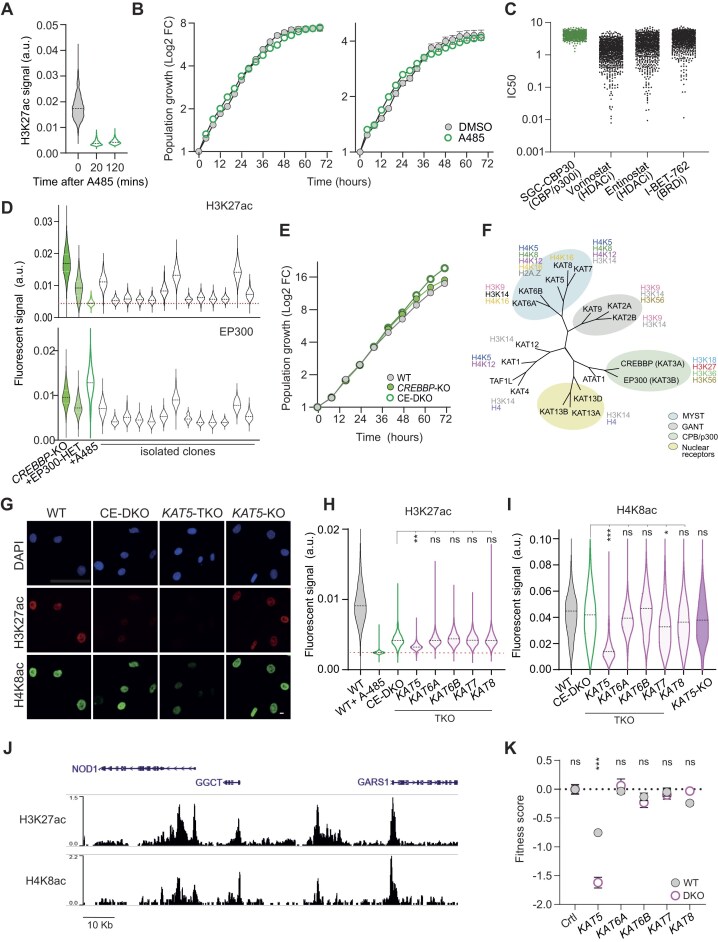
The molecular control of epigenetic information relies on hundreds of proteins of diverse function, which cooperate in defining chromatin structure and DNA methylation landscapes. While many individual pathways have been characterized, how different classes of epigenetic regulators interact to build a resilient epigenetic regulatory network (ERN) remains poorly understood. Here, we show that most individual regulators are dispensable for somatic cell fitness, and that robustness emerges from multiple layers of functional cooperation and degeneracy among network components. By disrupting 200 epigenetic regulator genes, individually or in combination, we generated network-wide maps of functional interactions for representative regulators. We found that paralogues represent only a first layer of functional compensation within the ERN, with intra- or inter-class interactions buffering the effects of perturbation in a gene-specific manner: while CREBBP cooperates with multiple acetyltransferases to form a subnetwork that ensures robust chromatin acetylation, ARID1A interacts with regulators from across all functional classes. When combined with oncogene activation, the accumulated epigenetic disorder exposes a synthetic fragility and broadly sensitizes ARID1A-deficient cells to further perturbation. Our findings reveal homeostatic mechanisms through which the ERN sustains somatic cell fitness and uncover how the network remodels as the epigenome is progressively deregulated in disease.

Plain language summary

Cells regulate their DNA through a network of proteins that shape chromatin structure and modify chemical markers. While many pathways have been studied individually, how they interact to maintain stability remains unclear. We investigated this by disrupting 200 genes involved in epigenetic regulation, one by one or in combination, to reveal their interactions. We found that most regulators are nonessential due to a variety of backup mechanisms. However, cancer-related mutations weaken this network, making cells more vulnerable to further disruption. Overall, our work helps explain how cells maintain stability despite disruptions and how this balance shifts in disease, potentially revealing new opportunities for treatment.


Conflict of interest statement

None declared.

Figures

Graphical Abstract
Graphical Abstract
Figure 1.
Figure 1.
Normal human epithelial cells are robust to epigenetic perturbation. (A) Schematic of the experimental approach. The bottom view of the Waddington landscape is used to visualize functional connections within and across ERN functional classes that sustain the cell epigenetic landscape. Image adapted from Rajagopal and Stanger [83] with permission from Elsevier. (B) Proportion of targeted genes in each functional group. (C) Profile of fitness scores in HCECs. Values: mean ± standard error of the mean (SEM) of three replicates. Dotted lines: mean and minimum/maximum negative control values, respectively. (D) Classification of ERGs in HCECs based on results in panel (C). Fraction (E) and enrichment (F) of fully dispensable or indispensable ERGs across functional class. Legend for ERN classes as in panel (B). Values in F are the log2 ratio of observed versus expected dispensable proportion. Statistical significance of the enrichment (two-tailed χ2 test, 7 df) and the size of each functional class are indicated. (G) Enrichment of genes with or without paralogues amongst indispensable ERGs, as the log2 ratio of observed versus expected counts. Paralogues for ERGs retrieved from Ensembl release 93 with sequence identity ≥ 0.2 [84]; histone variants were manually included. Statistical significance of the enrichment in each line (two-tailed χ2 test) is indicated. (HJ) Fitness scores for HCEC populations with the indicated genes knocked-out. The structure of the corresponding proteins retrieved from cBioPortal is indicated in panel (H) and (I), while a schematic diagram illustrates parallel pathways mediating gene silencing in J.
Figure 2.
Figure 2.
Loss of paralogue pairs does not induce ERN collapse. (A) Upper, ARID1A and CREBBP highlighted on the profile of HCEC fitness scores. Lower, schematic of knockout line generation. (B) Proliferation curve of the indicated HCEC isogenic lines. Values: mean ± SEM of six replicates. T-test comparing the slope of a linear model fitted to the log2-transformed values between 24 and 48 h, four asterisks: two-tailed P < .0001. (C) Log2 of L/H ratio (where L = sample and H = internal standard) relative to the mean value of WT cells for the indicated differentially modified histone peptides in the isogenic HCEC lines, and WT cells treated with 50 nM Quisinostat (HDACi). Three biological replicates per condition are shown. One, two, three and four asterisks: P < .05, P < .01, P < .001, and P < .0001, respectively. Cross: undetected peptides. (D) Quantitative immunofluorescence microscopy of single cells from the indicated populations. Median values of the signal intensity distributions from three biological replicates are plotted. Two, and four asterisks: P < .05 and P < .0001, respectively. a.u.: arbitrary units. (E) ChIP-seq tracks of H3K27ac in the indicated lines showing unaffected patterns. (F, G) Quantification of differential H3K27ac peaks detected in CREBBP-KO cells visualized as venn diagrams (F) or MA-plot (G). Visualization (H) and quantification (I) of fitness impact by the indicated sgRNAs in the isogenic HCEC lines. Nuclei were stained with SYTOX green. Ctrl: control, TNP2-targeting sgRNA. Values: mean ± SEM of three biological replicates. Black and grey dotted lines: mean and minimum/maximum negative control values, respectively. Fraction of apoptotic (J) and proliferating cells in S-phase (K) at the indicated time after knockout of the indicated genes. Values: mean ± SEM of three biological replicates. Two-way ANOVA with Dunnett’s multiple comparison test, samples compared at each timepoint against Ctrl. One, two, three and four asterisks: P < .05, P < .01, P < .001, and P < .0001, respectively. (L-M) Quantitative immunofluorescence microscopy of HCECs upon single or double inactivation of CREBBP and EP300. Distributions of H3K27ac signal intensity in single cells (L) and representative images (M). n = 431–2571, two-tailed t-test of three independent population medians versus WT; one, three, and four asterisks: P < .05, P < .001, and P < .0001, respectively. Scale bar: 10 μm.
Figure 3.
Figure 3.
Functional interactions of ARID1A and CREBBP within the ERN. (A) Schematic of the experimental approach used to identify functional interactions that sustain ERN functionality in or CREBBP- or ARID1A-KO cells. Fitness scores of ERG-KO populations in WT and CREBBP-KO (B) or ARIDA1-KO (D) HCEC cells. Values: mean ± SEM of three biological replicates. Vertical drop from line of identity (red arrow) indicates synthetic sick phenotypes. (C and E) Identification of functional interactions based on linear regression analysis. x-axis: regression coefficient, y-axis: Wald-test p-value. Red symbols: interactors whose loss synergizes with CREBBP (C) or ARID1A (E) loss. Fitness scores of ERG-KO Populations in WT and CREBBP-KO (F) or ARID1A-KO (I) HCEC cells. Values, mean ± SEM of three biological replicates. Red outline symbols: DKO populations exhibiting synthetic sick phenotypes based on linear regression analysis. (G, J) Fitness score of the indicated KO populations in WT and CREBBP-KO (G) or ARID1A-KO (J) HCEC cells. (H) Identified CREBBP or ARID1A functional interactions with ERN components in HCEC cells arranged by functional class. Edges are scaled to indicate interaction effect size, up to a maximum absolute coefficient value of 1. Gray bar, fitness score in WT cells. Black star: physical interactor by STRING database.
Figure 4.
Figure 4.
Synthetic fragility of the ERN upon transformation. (A) Schematic of the experimental approach used to assess how cumulative epigenetic deregulation compromises ERN robustness in malignant cells. (B) Log2-ratio of peptide L/H ratio relative to the mean value of parental WT HCEC cells for the indicated differentially modified histone peptides in transformed lines. Three biological replicates per condition are shown. One, two, three, and four asterisks: P < .05, P < .05, P < .001, and .0001, respectively. Gray cross: Undetected peptides. (C) Fitness scores of ERG-KO populations in parental WT and transformed KP-C or KP-A HCEC cells. Values: mean ± SEM of three biological replicates. Vertical drop from line of identity indicates synthetic sick/lethal phenotypes. (D, E) Fitness scores of ERG-KO populations in the indicated HCEC lines. Values: mean ± SEM of three biological replicates. Black and red gene names: enhanced or KP-unique synthetic phenotypes, respectively, based on linear regression analysis in the two conditions. Representative interactions are shown; the full list is in Supplementary Fig. S6F and Supplementary Table S4.
Figure 5.
Figure 5.
Cooperativity amongst HATs renders CREBBP/EP300 dispensable in human somatic cells. (A) Quantitative immunofluorescence microscopy of HCECs treated with 4 μM A-485. Distributions of H3K27ac signal intensity in single cells at the indicated timepoints are compared. n = 1206–1376, two-tailed t-test P-values < .0001. (B) Proliferation curves of HCEC and HME1 cell populations during treatment with DMSO or 4 μM A-485, refreshed every 12 h. Values are the increase in confluence relative to the first timepoint, expressed as mean ± SEM of five biological replicates. T-test comparing the slope of a linear model fitted to the log2-transformed values between 24 and 48 h, one asterisk: two-tailed P < .05. (C) Sensitivity data of cell lines across cancer types for the indicated drugs from the Sanger GDSC2 database. HDACi Vorinostat and Entinostat and BRD4i I-BET-762 are shown as a reference. Data for the CREBBP/EP300i SGC-CBP30 are shown as A-485 was not tested. 716 < N < 959 cancer cell lines. (D) Quantitative immunofluorescence microscopy of representative monoclonal CREBBP-KO HME1 populations treated with sgRNAs targeting EP300. Distributions of H3K27ac and EP300 signal intensity in single cells are compared with parental CREBBP-KO cells with WT EP300 alleles, a clone of CREBBP-KO cells with an inactivate allele (+EP300-HET) and CREBBP-KO cells treated with CREBBP/EP300i (+A485). Clones were scored as KO if the mean H3K27ac signal was within mean ± 2SD of the A485-treated population, shown as red dotted line. 77 < N < 1243 nuclei per condition. (E) Proliferation curves of HME1 cell populations of the indicated genotypes. Values are the increase in cell count relative to the first timepoint, expressed as mean ± SEM of six biological replicates. T-test comparing the slope of a linear model fitted to the log2-transformed values between 24 and 48 h, four asterisks: two-tailed P < .0001. (F) Phylogenetic tree of the KAT enzymes. Proteins are grouped by families and their major histone substrates are indicated. Adapted from Di Cerbo and Schneider [85]. Quantitative immunofluorescence microscopy of the indicated HME1 lines assessing the indicated acetylated residues. Representative images (G) and quantification of the fluorescent signal in single cells (H, I). Scale bar: 10 μm, 899 < n < 6855, two-way ANOVA with Dunnett’s multiple comparisons test; one, two, or three asterisks: P < .05, .01, or .001, respectively. (J) ChIP-seq tracks of the indicated histone acetylation marks profiled in human mammary epithelial cells MCF10A, retrieved from Cistrome Data Browser. (K) Fitness scores of either WT or CE-DKO HME1 cells 96 h after transfection with the indicated KAT-targeting gRNAs. Values, mean ± SEM of three replicates. Unpaired two-tailed t-test; three asterisks: P < .001.

Similar articles

References

    1. Strahl BD, Allis CD The language of covalent histone modifications. Nature. 2000; 403:41–5.10.1038/47412. - DOI - PubMed
    1. Allis CD, Jenuwein T The molecular hallmarks of epigenetic control. Nat Rev Genet. 2016; 17:487–500.10.1038/nrg.2016.59. - DOI - PubMed
    1. Janssen SM, Lorincz MC Interplay between chromatin marks in development and disease. Nat Rev Genet. 2022; 23:137–53.10.1038/s41576-021-00416-x. - DOI - PubMed
    1. Schuettengruber B, Chourrout D, Vervoort M et al. . Genome regulation by polycomb and trithorax proteins. Cell. 2007; 128:735–45.10.1016/j.cell.2007.02.009. - DOI - PubMed
    1. Reynoird N, Schwartz BE, Delvecchio M et al. . Oncogenesis by sequestration of CBP/p300 in transcriptionally inactive hyperacetylated chromatin domains. EMBO J. 2010; 29:2943–52.10.1038/emboj.2010.176. - DOI - PMC - PubMed

LinkOut - more resources