. 2025 Apr 10;53(7):gkaf272.
doi: 10.1093/nar/gkaf272.

Single-stranded DNA drives σ subunit loading onto mycobacterial RNA polymerase to unlock initiation-competent conformations

Affiliations

Single-stranded DNA drives σ subunit loading onto mycobacterial RNA polymerase to unlock initiation-competent conformations

Rishi Kishore Vishwakarma et al. Nucleic Acids Res. .

Abstract

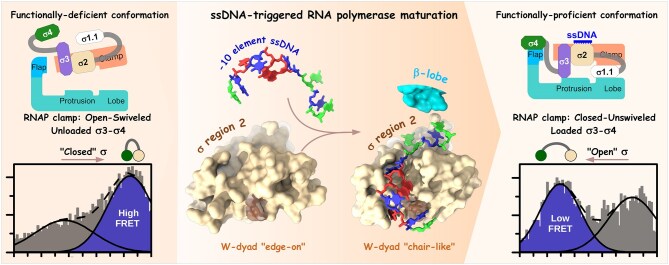
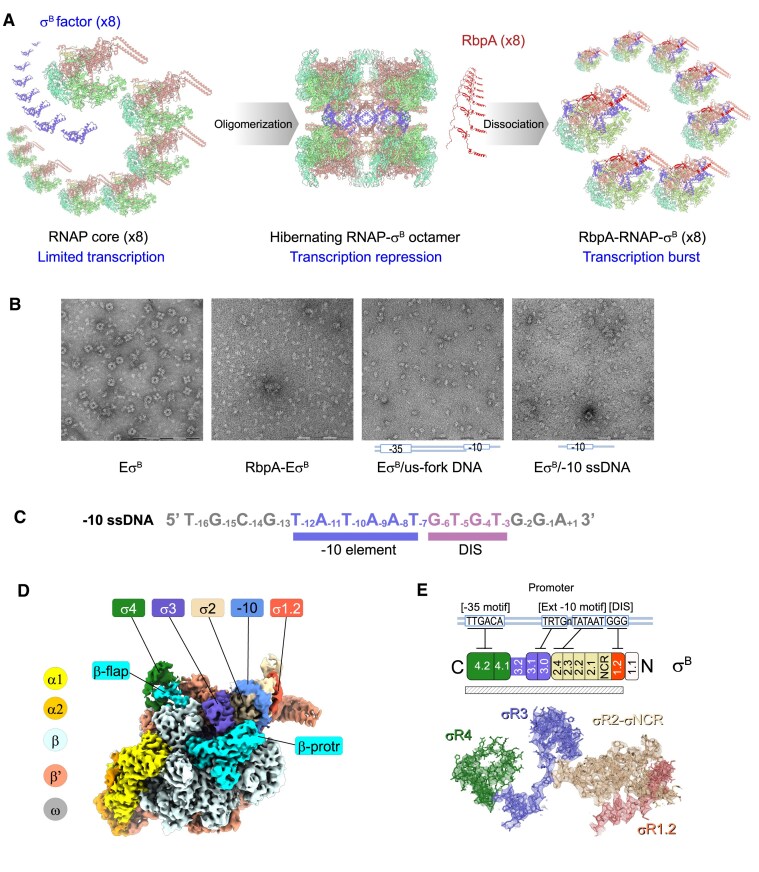
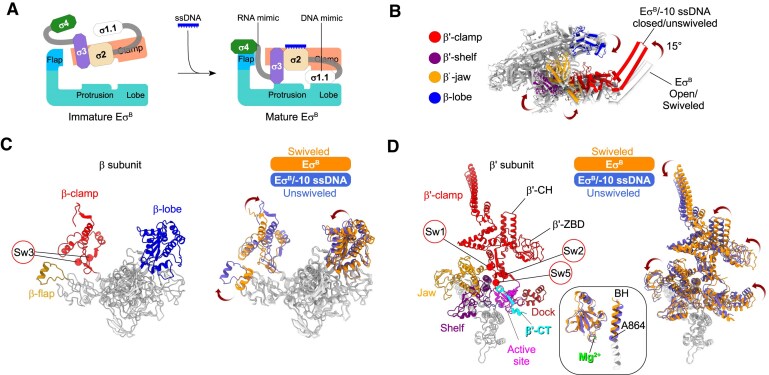
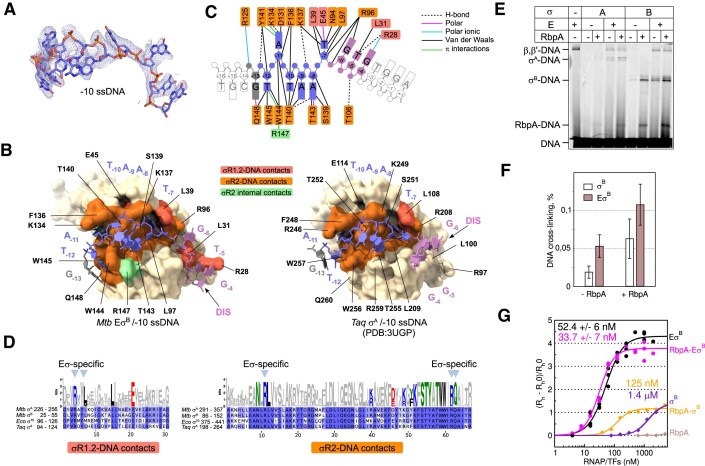
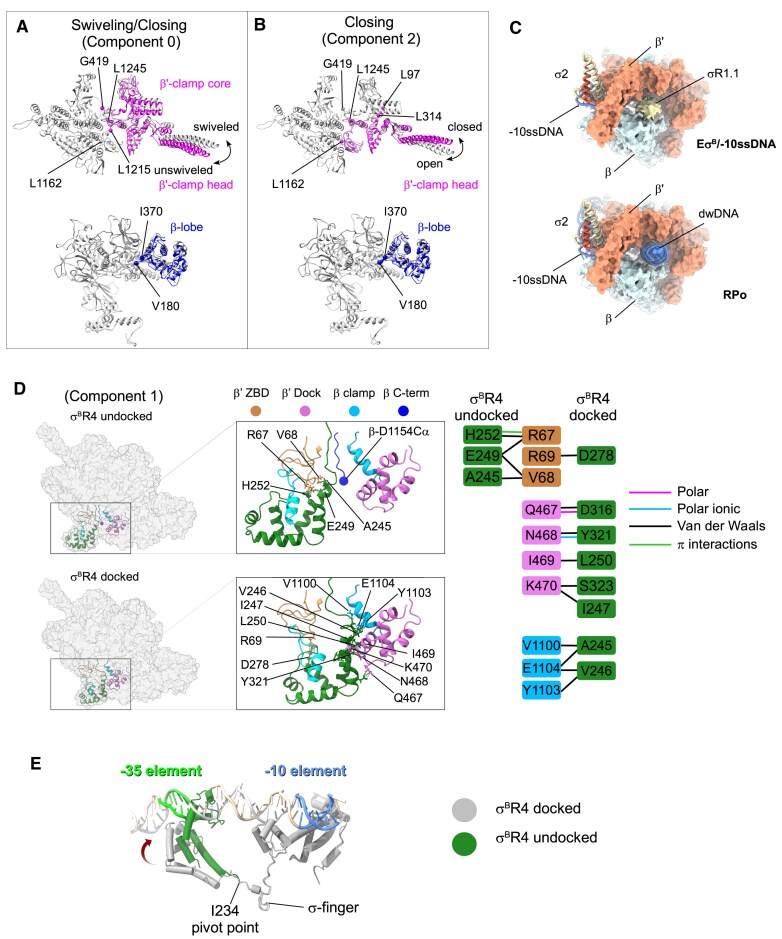
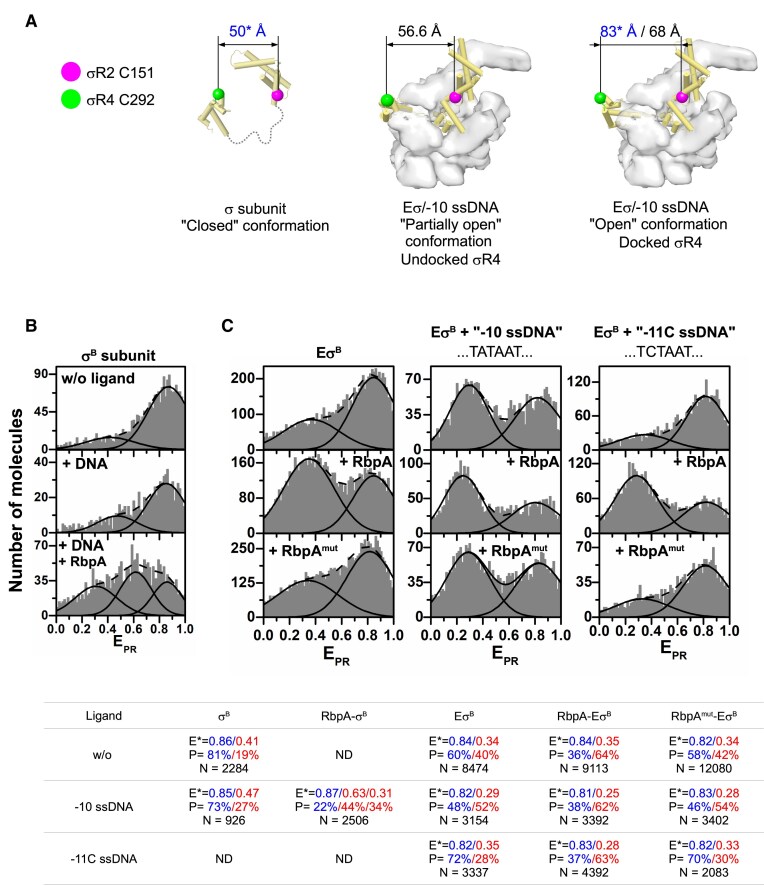
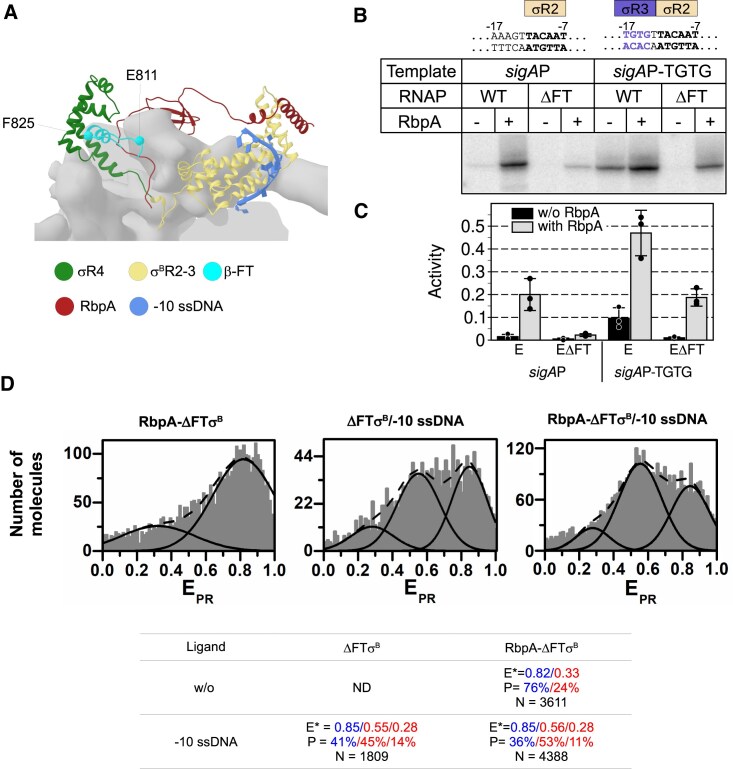
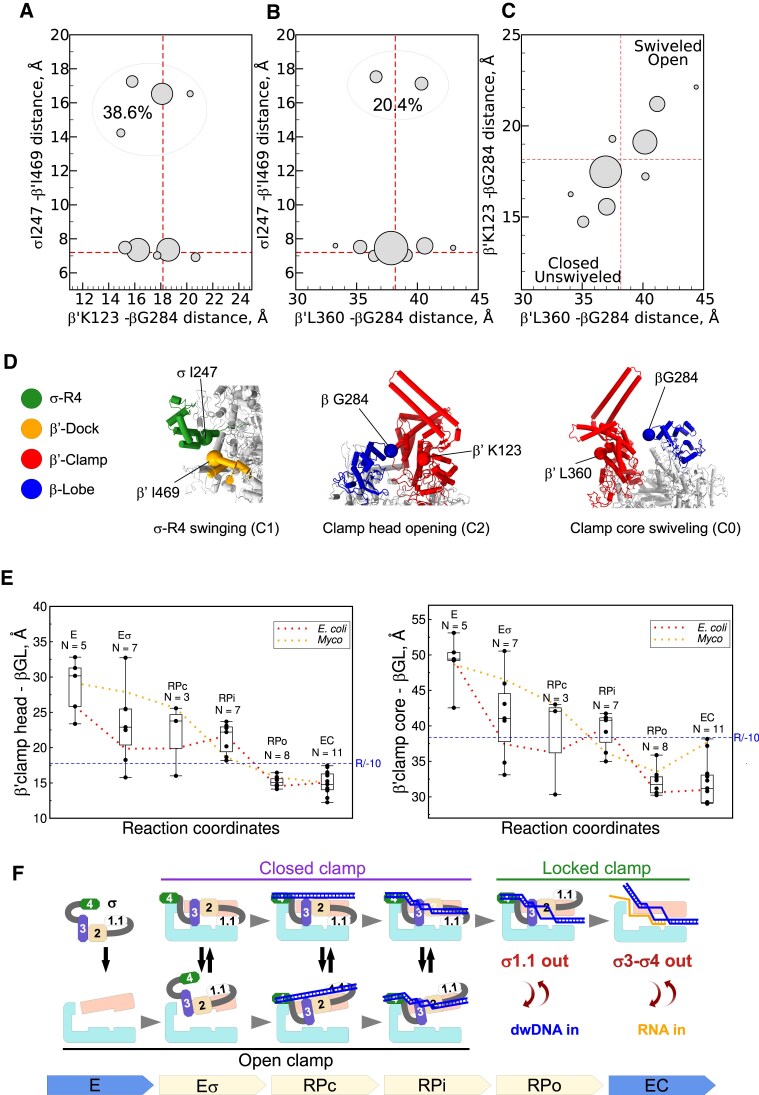
Initiation of transcription requires the formation of the "open" promoter complex (RPo). For this, the σ subunit of bacterial RNA polymerase (RNAP) binds to the nontemplate strand of the -10 element sequence of promoters and nucleates DNA unwinding. This is accompanied by a cascade of conformational changes on RNAP, the exact mechanics of which remains elusive. Here, using single-molecule Förster resonance energy transfer and cryo-electron microscopy, we explored the conformational landscape of RNAP from the human pathogen Mycobacterium tuberculosis upon binding to a single-stranded DNA (ssDNA) fragment that includes the -10 element sequence (-10 ssDNA). We found that like the transcription activator RNAP-binding protein A, -10 ssDNA induced σ subunit loading onto the DNA/RNA channels of RNAP. This triggered RNAP clamp closure and unswiveling that are required for RPo formation and RNA synthesis initiation. Our results reveal a mechanism of ssDNA-guided RNAP maturation and identify the σ subunit as a regulator of RNAP conformational dynamics.


Conflict of interest statement

None declared.

Figures

Graphical Abstract
Graphical Abstract
Figure 1.
Figure 1.
Structure of the M. tuberculosisB holoenzyme in complex with −10 ssDNA. (A) Cartoon depicting the MtbB holoenzyme assembly followed by oligomerization into an octamer and its regulation by RbpA. RbpA-induced EσB octamer dissociation results in the increase of the active RbpA–EσB concentration, leading to a transcription burst [51]. (B) MtbB octamer disassembly induced by RbpA and by −10 ssDNA. Negatively stained electron microscopy (EM) images of Mtb RNAP holoenzyme octamers (EσB), EσB monomers in complex with RbpA (RbpA–EσB), MtbB monomers in complex with us-fork DNA spanning the promoter positions −42/−3 (EσB/us-fork DNA), and EσB in complex with the −10 ssDNA (EσB/−10 ssDNA). Scale bar = 200 nm. (C) Sequence of the 17-mer DNA oligonucleotide derived from the lacUV5 promoter (−10 ssDNA). The −10 sequence element and discriminator (DIS) element, which determines whether promoter is subject to stringent control, are underlined. (D) Overall cryo-electron microscopy (cryo-EM) map of the MtbB/−10 ssDNA complex (consensus I map). RNAP subunits are color-coded as indicated on the left. β-protrusion (β-protr) and β-flap are in cyan. Regions/domains of the σB subunit and −10 ssDNA (-10) are color-coded as indicated on the top. (E) Cryo-EM density (shown as mesh) and molecular model of the resolved segment of the σB subunit. The cartoon shows the σB organization (numbered regions and subregions) and its interaction with promoter elements. N-terminus (N) on the right and C-terminus (C) on the left. The subregions inside σ domains are numbered. The hatched rectangle shows the resolved σB segment (residues 24–323). The σB subunit regions/domains σR1.2 (aa 24–55), σ-NCR (aa 56–86), σR2 (aa 87–163), σR3 (aa 164–240), and σR4 (aa 241–323) are color-coded as indicated.
Figure 2.
Figure 2.
Structural transitions in Mtb RNAP during holoenzyme maturation. (A) Cartoon showing the transitions in the MtbB holoenzyme induced by −10 ssDNA binding. (B–  D) Structure of the MtbB/−10 ssDNA complex superimposed with the published structure of the MtbB protomer (PDB: 7PP4) from the octameric assembly [51]. The RNAP core is shown as light gray ribbons with cylindrical helices. The σ subunit is omitted. The moving domains of EσB/−10 ssDNA [clamp (β′ 4−419, 1219–1261; β 1117–1140), jaw (β′ 1025–1218), shelf (β′ 882–1011), dock (β′ 444–495), and lobe (β 180–370)] are color-coded as indicated on the left. (C) Ribbon models of the β subunit. On the left, static regions are in gray and the moving domains β-clamp (aa 1041–1147), β-lobe (aa 180–370), and β-flap (aa 808–832) are in red, blue, and khaki, respectively. The switch 3 region (Sw3) is delimited by the Cα atoms of β-G1047 and β-G1065 depicted as spheres. On the right, superposition of the β subunit from the EσB octamer (dark orange) with the β subunit from the EσB/−10 ssDNA complex (slate blue). (D) Ribbon models of the β′ subunit. On the left, static regions are in gray and the moving domains β′-clamp (aa 4–423; 1219–1261) in red, jaw (aa 1025–1218) in orange, shelf (aa 882–1011) in purple, dock (aa 444–495) in firebrick, β′ C-terminus (β′-CT, aa 1262–1283) in cyan, and active site (aa 423–443; 496–562) in magenta. The σ subunit binding domains, β′-CH (aa 339–383) and β′-ZBD (aa 53–85), are indicated. The position of the switch regions is delimited by the Cα atoms of β′-S1219 (Sw1), β′-G419 (Sw2), and β′-P1259 (Sw5) depicted as spheres. On the right, superposition of the β′ subunit from the EσB octamer (dark orange) with the β′ subunit from the EσB/−10 ssDNA complex (slate blue). Insert shows the changes in the RNAP active site and BH (aa 850–882). The catalytic Mg2+ ion is shown in green.
Figure 3.
Figure 3.
Architecture of the σB/−10 ssDNA interactions and their quantitative analysis. (A) Cryo-EM density (as mesh) and molecular model of −10 ssDNA. (B) Comparison of the σ/ssDNA binding interfaces in the MtbB/−10 ssDNA complex (on the left) and Taq σA/−10 ssDNA complex [9] (PDB: 3UGP, on the right). The σ domain 2 is shown as a molecular surface colored in wheat. Residues interacting with ssDNA are in orange (σR2) and tomato (σR1.2). The σB-R147 making holoenzyme-specific π-interactions with σB-W144 is colored in light green. ssDNA is shown as a stick molecular model with filled sugars and bases. (C) Schematic drawing showing the network of interactions between ssDNA and the σB subunit in the MtbB/−10 ssDNA complex. Resolved DNA bases are color-coded as in Fig. 1C. Unresolved bases are in white. The amino acid residues interacting with ssDNA are indicated and colored as in panel (B). Lines are colored according to the interaction type (list on the right). (D) Web logo and alignment of σR1.2 and σR2. The ssDNA contacting residues are colored as follows: polar amino acids (G, S, T, Y, C, Q, and N) in green, basic amino acids (K, R, and H) in blue, acidic amino acids (D and E) in red, and hydrophobic amino acids (A, V, L, I, P, W, F, and M) in black. The arrows on the top indicate the contacts observed in the RNAP holoenzyme and missing in the Taq σA/−10 ssDNA complex. (E) Probing of the DNA–protein interactions by formaldehyde cross-linking. Mtb RNAP core (E), σA (A), σB (B), and/or RbpA (as indicated) were cross-linked to fluorescent −10 ssDNA and resolved on SDS–PAGE. (F) Bar graph showing the quantification of the experiment in panel (E). Data are presented as mean values ± standard deviation (SD) of six independent experiments. (G) Measurement of the apparent Kd of −10 ssDNA and the σB subunit by MDS. The relative change RRC of the mean Rh is plotted in function of the protein concentration. The calculated values of the apparent Kd are shown. Measurements were performed once for σB and RbpA–σB, twice for RbpA, three times for EσB, and four times for RbpA–EσB. Data are presented as mean values ± SD.
Figure 4.
Figure 4.
Conformational landscape of EσB bound to −10ssDNA. (A) Conformational changes in the RNAP core for the 3DVA component 0: clamp swiveling and closing. The β lobe and β′ subunit clamp domains that underwent conformational changes are colored. (B) Conformational changes in the RNAP core for 3DVA component 2: clamp closing. The β lobe and β′ subunit clamp domains that underwent conformational changes are colored. (C) Comparison of the position of σR1.1 in the unswiveled EσB/−10ss DNA complex and position of the dwDNA in RPo [32]. RNAP is shown as a molecular surface color-coded as in Fig. 1D. The σB subunit is shown as ribbons. The cryo-EM density of σR1.1 is represented as a yellow surface. (D) Conformational changes for the 3DVA component 1: σR4 swinging between the docked and undocked state. RNAP is represented as a molecular surface. The σR4 and RNAP core domains (β′-dock, β′-ZBD, and β-clamp) contacting σR4 are shown as ribbon models. The contacting residues are shown as ball and stick molecular models. The cartoon on the right shows the map of the interactions between σR4 and RNAP core in the undocked and docked σR4 states. Lines are colored according to the interaction type. (D) Superposition of the σB subunit in the docked and undocked conformations with the promoter DNA structure from the Mtb RPc [40] (PDB: 7KIM).
Figure 5.
Figure 5.
Conformational changes in σB upon the −10 ssDNA and RbpA binding. (A) Molecular models of the free σB subunit (ribbons with cylindrical helices) and EσB in the undocked and docked conformations. The RNAP core is depicted as a molecular surface. Spheres represent the Cα atoms of the σB subunit residues Cys-151 and Cys-292 (color-coded as indicated on the left) labeled with the DY-547P1 and DY-647P1 fluorescent dyes. Distances between dyes, shown above the models, were calculated using the smFRET data (in blue) [50] and from the EσB structures reported here (in black). (B) smFRET of free σB performed without ligands or in the presence of −10 ssDNA (DNA) and RbpA. (C) smFRET of the MtbB holoenzyme in the presence of −10 ssDNA, −11C ssDNA, wild-type RbpA, and the RbpA double mutant R88,89A (RbpAmut). The table lists the EPR values (E), percentages (P) of molecules in each histogram peak, and total number (N) of molecules from panels (B) and (C). ND, not determined. All smFRET measurements were done three times except for EσB and RbpA–EσB which were done twice.
Figure 6.
Figure 6.
The RNAP β-flap is essential for σ loading induced by RbpA and by −10 ssDNA. (A) Cartoon showing the σB 4/β-FT interactions. Molecular model of MtbB/−10 ssDNA in complex with RbpA (RbpA coordinates taken from PDB: 6EDT [32]). The RNAP core is depicted as molecular surface. The σB subunit, RbpA, and β-FT are shown as ribbons models. (B) Effect of β-FT deletion on run-off transcription from the sigAP and extended −10 type sigAP-TGTG promoters. The difference in promoter sequences is shown on the top. The σB subunit regions that interact with promoter motifs are depicted as rectangles above the DNA sequences. (C) Bar graph showing the quantification of the run-off RNA products of the gel shown in panel (B). Activity was calculated by dividing the run-off RNA signal (counts) in each lane by the total counts across all lanes. Data are presented as mean values ± SD of three independent experiments. (D) smFRET analysis of the mutant Mtb EΔFTσB holoenzyme (lacking the RNAP β-FT) in the presence of −10 ssDNA and RbpA. The table lists the EPR values (E), percentages (P) of molecules in each peak, and total number (N) of molecules in panel (D). ND, not determined. The smFRET measurements were done three times.
Figure 7.
Figure 7.
Correlation between σ loading, σR4 swinging, and clamp motions. (A–C) Graphs showing the distances between σR4 and β′-dock and β′CH and β-lobe in the nine clusters produced in the 3DVA (see Supplementary Table S1). (D) Molecular models showing the above mentioned regions; the Cα atoms of the residues used for the distance calculations are shown as spheres. (E) Box plots showing the compilation of the clamp-lobe distances from published cryo-EM structures of RNAP plotted in function of the transcription cycle progression (reaction coordinates). Dotted lines show the mean values for E. coli and M. tuberculosis (Myco), respectively. N, number of data points used for each reaction step (see Supplementary Table S2). (F) Model depicting the changes in RNAP clamp (light salmon) and σ subunit (σR1.1 in white, color-codes for σR2, σR3, and σR4 as in Fig. 1E) conformations throughout the transcription cycle. Promoter DNA is depicted as a blue ladder, RNA as an orange line. Each complex type (E, Eσ, RPc, RPi, RPo, and EC) and the reaction direction are indicated by arrows at the bottom.

Similar articles

References

    1. Burgess RR, Travers AA, Dunn JJ et al. . Factor stimulating transcription by RNA polymerase. Nature. 1969; 221:43–6.10.1038/221043a0. - DOI - PubMed
    1. Feklistov A, Sharon BD, Darst Sa et al. . Bacterial sigma factors: a historical, structural, and genomic perspective. Annu Rev Microbiol. 2014; 68:357–76.10.1146/annurev-micro-092412-155737. - DOI - PubMed
    1. Gruber TM, Gross CA Multiple sigma subunits and the partitioning of bacterial transcription space. Annu Rev Microbiol. 2003; 57:441–66.10.1146/annurev.micro.57.030502.090913. - DOI - PubMed
    1. Rodrigue S, Provvedi R, Jacques PÉ et al. . The σ factors of Mycobacterium tuberculosis. FEMS Microbiol Rev. 2006; 30:926–41.10.1111/j.1574-6976.2006.00040.x. - DOI - PubMed
    1. Buc H, McClure WR Kinetics of open complex formation between Escherichia coli RNA polymerase and the lac UV5 promoter. Evidence for a sequential mechanism involving three steps. Biochemistry. 1985; 24:2712–23.10.1021/bi00332a018. - DOI - PubMed

MeSH terms

LinkOut - more resources