. 2025 May 2;39(9-10):652-675.
doi: 10.1101/gad.352316.124.

Histone chaperones coupled to DNA replication and transcription control divergent chromatin elements to maintain cell fate

Affiliations

Histone chaperones coupled to DNA replication and transcription control divergent chromatin elements to maintain cell fate

Reuben Franklin et al. Genes Dev. .

Abstract

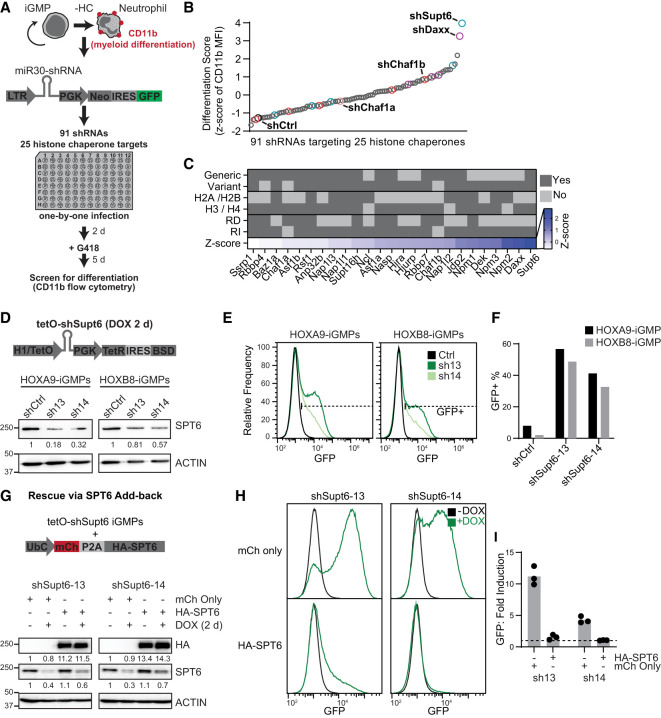
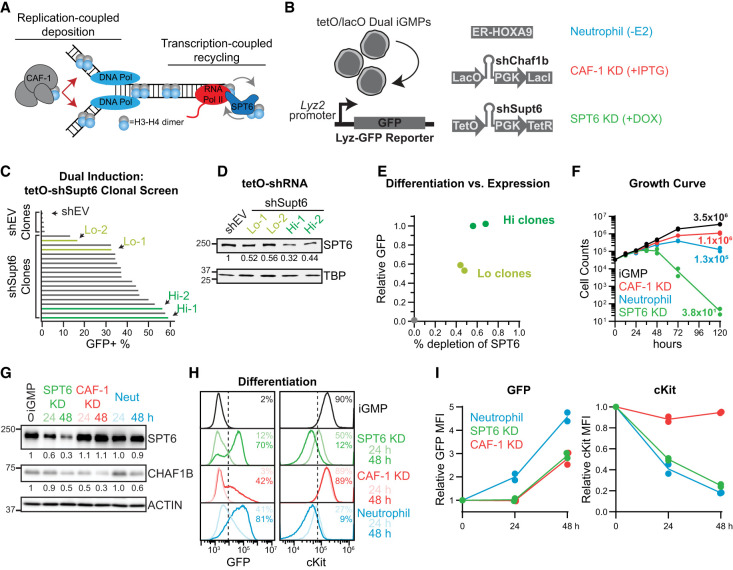
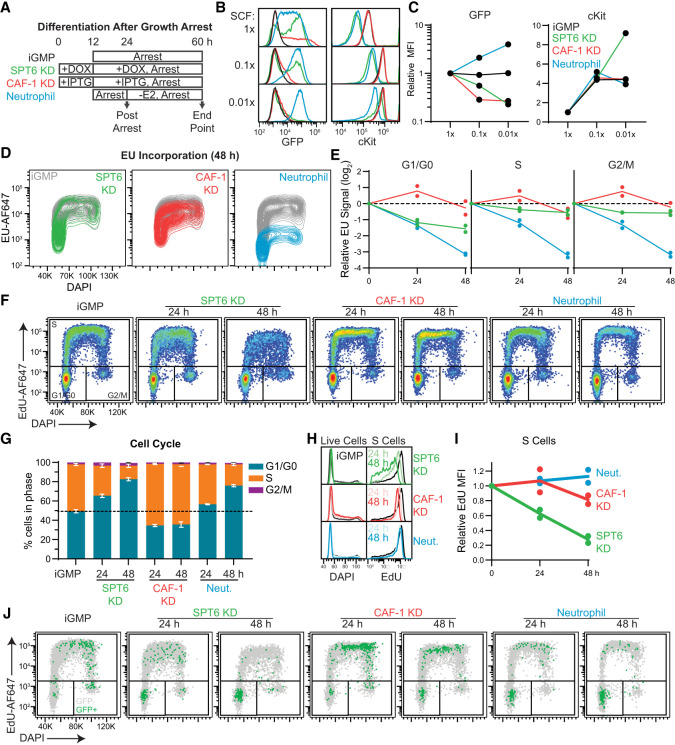
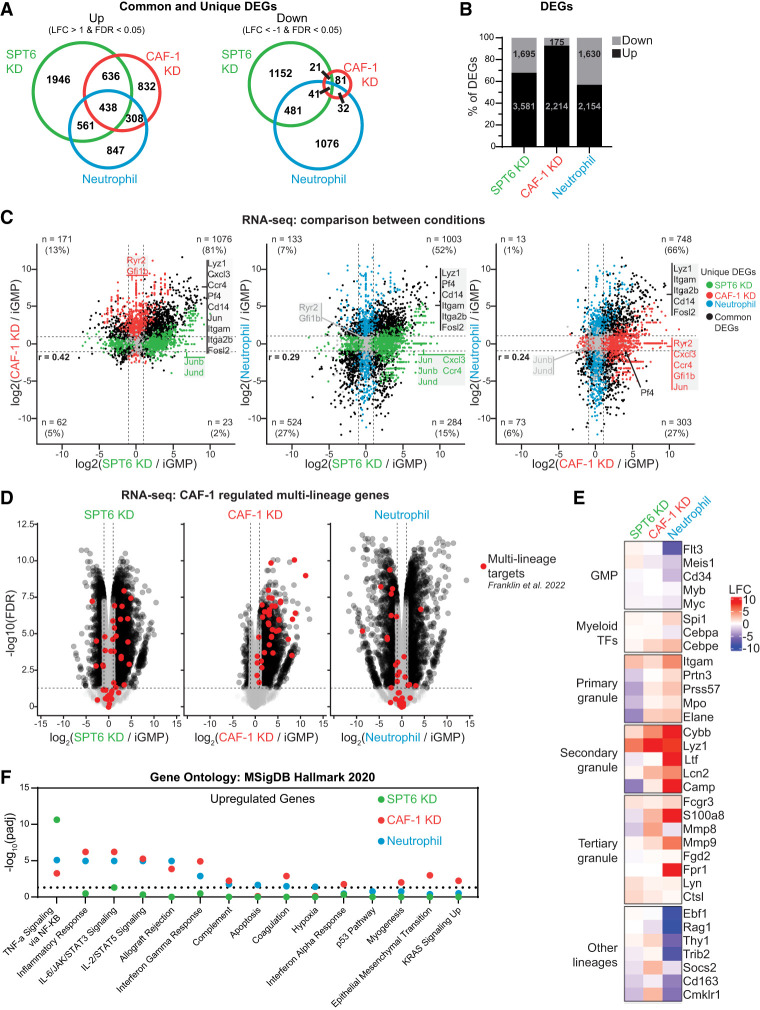
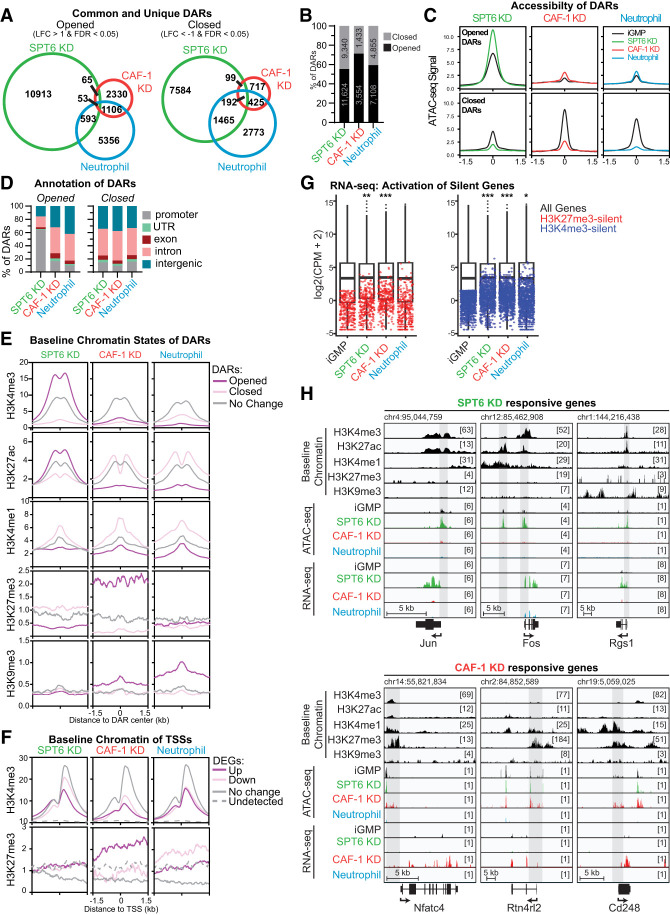
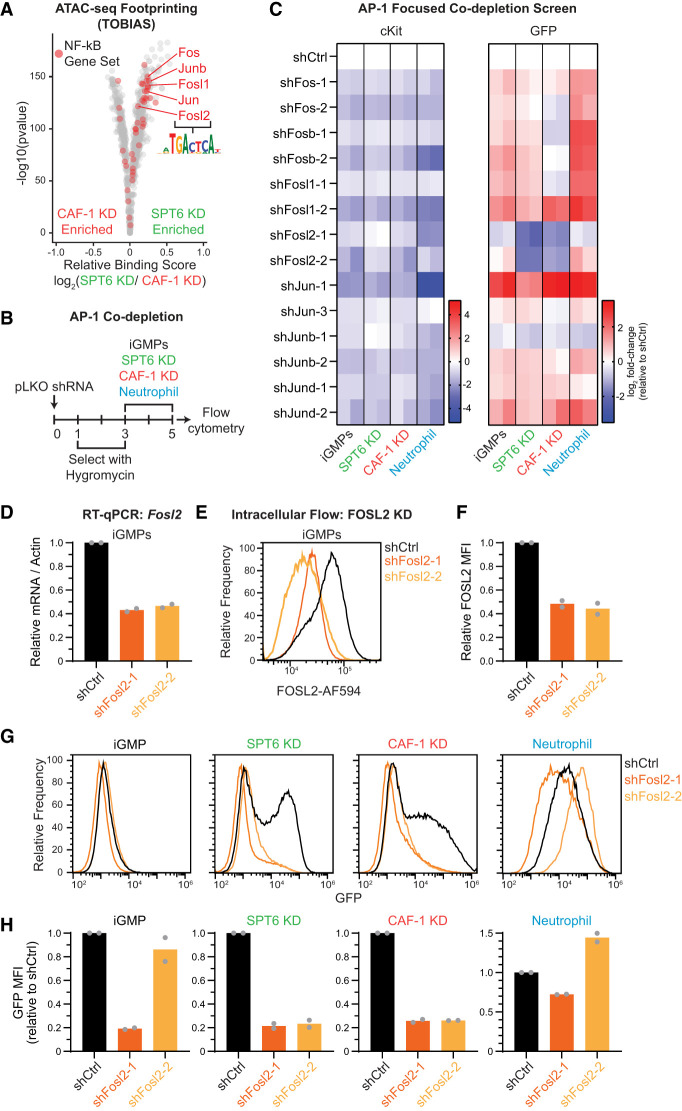
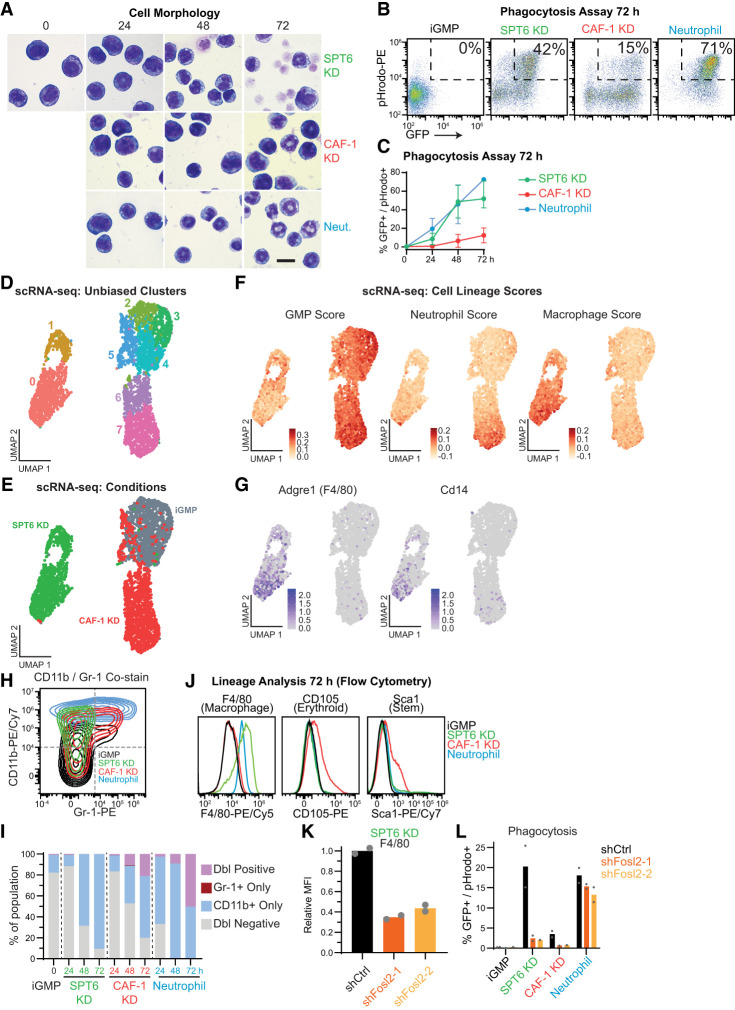
The manipulation of DNA replication and transcription can be harnessed to control cell fate. Central to the regulation of these DNA-templated processes are histone chaperones, which in turn are emerging as cell fate regulators. Histone chaperones are a group of proteins with diverse functions that are primarily involved in escorting histones to assemble nucleosomes and maintain the chromatin landscape. Whether distinct histone chaperone pathways control cell fate and whether they function using related mechanisms remain unclear. To address this, we performed a screen to assess the requirement of diverse histone chaperones in the self-renewal of hematopoietic stem and progenitor cells. Remarkably, all candidates were required to maintain cell fate to differing extents, with no clear correlation with their specific histone partners or DNA-templated process. Among all the histone chaperones, the loss of the transcription-coupled histone chaperone SPT6 most strongly promoted differentiation, even more than the major replication-coupled chromatin assembly factor complex CAF-1. To directly compare how DNA replication- and transcription-coupled histone chaperones maintain stem cell self-renewal, we generated an isogenic dual-inducible system to perturb each pathway individually. We found that SPT6 and CAF-1 perturbations required cell division to induce differentiation but had distinct effects on cell cycle progression, chromatin accessibility, and lineage choice. CAF-1 depletion led to S-phase accumulation, increased heterochromatic accessibility (particularly at H3K27me3 sites), and aberrant multilineage gene expression. In contrast, SPT6 loss triggered cell cycle arrest, altered accessibility at promoter elements, and drove lineage-specific differentiation, which is in part influenced by AP-1 transcription factors. Thus, CAF-1 and SPT6 histone chaperones maintain cell fate through distinct mechanisms, highlighting how different chromatin assembly pathways can be leveraged to alter cell fate.

Keywords: DNA replication; histone chaperones; lineage choice; stem cells; transcription; transcription factors.


Figures

Figure 1.
Figure 1.
SPT6 and other histone chaperone pathways maintain iGMPs. (A) Schematic for the arrayed screen design targeting 25 different histone chaperones through individual retroviral infection with pLMN-miR30-shRNAs. Infected (GFP+) cells were analyzed for mean fluorescence intensity (MFI) of CD11b expression with flow cytometry. (HC) Histone chaperone. (B) Screen results showing the differentiation score of individual shRNAs in iGMPs. The differentiation score is based on the Z-score of CD11b geometric mean fluorescence intensity (MFI) (see the Materials and Methods; Supplemental Fig. S1A,B). Colored points represent shRNAs targeting Supt6 (blue), Daxx (purple), Chaf1b (red), Chaf1a (light red), and Renilla luciferase (shCtrl; black). Data represent the average Z-score of n = 3 experimental replicates. (C) Annotation table of targeted histone chaperones. Categories include histone chaperones known to interact with replicative histones, variant histones, H2A/H2B, or H3/H4 and histone chaperones known to be involved in replication-dependent (RD) and replication-independent (RI) pathways. Z-score represents the average of all shRNAs in B targeting the indicated histone chaperone. (D, top panel) Schematic of the tetO-shRNA (EZ-tet-pLKO-Blast; Addgene 85973) used for shCtrl and inducible depletion of SPT6. (Bottom panel) Western blot quantifying SPT6 with ACTIN as a loading control after 2 days of Dox induction. HOXA9-iGMPs and HOXB8-iGMPs transduced with two independent tetO-shRNAs targeting Supt6 (shSupt6-13/14) and a scrambled shRNA as control (shCtrl). (E) Histograms showing GFP expression quantified with flow cytometry in HOXA9-iGMPs and HOXB8-iGMPs after 2 day Dox induction of shCtrl or one of two independent Supt6 shRNAs (shSupt6-13/14). (F) Bar plots summarizing the percentage of GFP+ cells shown in F. Experiments represent one polyclonally transduced population per cell line and shRNA. Experiments with HOXA9-iGMPs from DF were independently repeated three times with consistent results. (G, top panel) Schematic of rescue experiment performed by transducing tetO-shSupt6-HOXA9-iGMPs with pUltra expression vector containing the ubiquitin C promoter driving a polycistronic transcript. The HA-SPT6 vector encodes mCherry (mCh), P2A self-cleaving peptide, and HA fused to the SUPT6H N terminus (HA-SPT6; human SPT6 homolog). pUltra backbone with mCh still encoded was used as a control (mCh only). Cells treated with Dox for 2 days were analyzed with flow cytometry and Western blotting and compared with untreated iGMPs. (Bottom panel) Western blot quantifying HA and SPT6 expression with ACTIN as a loading control. Cells with exogenous HA-SPT6 or mCh only were measured before and after 48 h of Dox induction. (H)Histogram showing GFP expression quantified with flow cytometry. shSupt6-13 and shSupt6-14 HOXA9-iGMPs with mCh only or with HA-SPT6 are treated with Dox for 2 days. Representative of n = 3 clonal replicates. (I) Bar plot summarizing fold induction of GFP (= +Dox GFP MFI/−Dox GFP MFI) as shown in H. n = 3 clonal replicates for each shRNA and condition. The dotted line represents no fold induction (=1).
Figure 2.
Figure 2.
Dually inducible depletion of SPT6 and CAF-1 perturbs replication- and transcription-coupled histone chaperone pathways. (A) CAF-1 and SPT6 are involved in replication- and transcription-coupled maintenance of chromatin, respectively. (B) Schematic of the dual-inducible iGMPs with corresponding genotypes and outcomes upon induction. (Lyz-GFP) Lysozyme-GFP. (C) Differentiation screen analysis of dual-inducible clones derived as seen in B. Bar plots show the percentage of GFP+ cells determined by flow cytometry after 5 days of continuous SPT6 KD (+Dox) treatment. TetO-pLKO backbone was used as a negative control (shEV). Green bars represent selected clones with high (Hi) or low (Lo) induction of GFP. n = 5 (shEV) and n = 19 (shSupt6) clonal replicates represented individually. (D) Western blot quantifying SPT6 with TBP as a loading control. Two clones with high (Hi) or low (Lo) GFP induction were compared with shEV cells. Cells were continuously treated with SPT6 KD for 48 h before quantification. (E) Differentiation versus expression. Differentiation signal (relative GFP) of selected Hi (dark green) and Lo (light green) clones. Relative GFP was normalized with the lower limit set to shEV and the upper limit set to Hi clones. Percent depletion of SPT6 was derived from the blot shown in D. For D and E, n = 2 clonal replicates for Hi and Lo populations, displayed individually. (F) Growth curve analysis performed by counting cells induced continuously with SPT6 KD, CAF-1 KD, or neutrophil differentiation for 0, 12, 24, 36, 48, 72, or 120 h. The Y-axis displays cell counts on a log10 scale. Lines connect the average counts of n = 2 clonal replicates per time point. The average number of cells recovered after 120 h is displayed next to the corresponding points. (G) Western blot analysis of SPT6 and CHAF1B after 24 and 48 h of SPT6 KD, CAF-1 KD, and neutrophil differentiation conditions compared with iGMPs. Western blot is representative of n = 2 clonal replicates with the average signal density normalized to the ACTIN loading control and displayed relative to iGMPs. (H) Flow cytometry quantification of GFP and cKit in iGMPs and after 24 or 48 h of SPT6, CAF-1, or neutrophil differentiation conditions. Dashed lines indicate the threshold for differentiation signal (GFP+ and cKit+). The mean percentages of GFP+ and cKit+ populations for n = 2 clonal replicates are displayed and colored according to condition and time point. (I) Line plots summarizing GFP and cKit expression in differentiated cells quantified by flow cytometry from H and displayed relative to iGMPs. The line connects the mean of n = 2 clonal replicates.
Figure 3.
Figure 3.
Cell cycle dependencies upon CAF-1 and SPT6 perturbations. (A) iGMPs were arrested with 0.1× or 0.01× SCF (arrest), in parallel with normal 1× SCF treatment. For SPT6 KD and CAF-1 KD conditions, arrest was performed following 12 h of pretreatment with Dox and IPTG, respectively. For neutrophil differentiation conditions, cells were arrested for 12 h before inducing differentiation for 36 h. SCF concentrations were maintained throughout the 48 h (arrest). Samples were collected “postarrest” to confirm arrest (see Supplemental Fig. S4A,B) and at the “end point” as shown in the schematic. (B) Histograms showing cKit and GFP expression quantified by flow cytometry at the “end point” of each treatment, as shown in A. iGMP, SPT6 KD, CAF-1 KD, and neutrophil histograms are overlaid for each SCF condition. (C) Quantification of GFP and cKit expression levels shown in B for each treatment relative to 1× SCF. n = 2 clonal replicates. (D) Flow cytometry contour plot showing incorporation of 5-ethynyluridine (EU) versus total DNA DAPI staining in iGMPs and after 48 h of SPT6 KD, CAF-1 KD, and neutrophil differentiation. Untreated iGMPs are overlaid with each condition and colored accordingly. (E) Time-course analysis of EU incorporation relative to iGMPs for each condition as a function of cell cycle phase. n = 2 clonal replicates. Phases were gated based on DAPI signal (see also histograms in Supplemental Fig. S4E). (F) Cell cycle plots showing EdU incorporation and total DNA staining (DAPI) quantified with flow cytometry. G1/G0, S, and G2/M cell cycle phases are gated based on EdU and DAPI signal. Data were quantified in iGMPs and after 24 or 48 h of continuous treatment for each condition. Representative of n = 2 clonal replicates. The experiment was independently repeated three times with consistent results. (AF647) Alexa fluor-647. (G) The percentage of cells in each cell cycle phase as gated in F. The mean of n = 2 clonal replicates with error bars representing the range. (H) Histograms quantifying DNA content in the bulk population for each condition and EdU incorporation in S-phase cells from cells shown in F. Representative of n = 2 clonal replicates. (I) Geometric mean fluorescence intensity of EdU incorporation in S-phase cells as shown in H for n = 2 clonal replicates. (J) Cell cycle plots as shown in F, but with GFP (gray) and GFP+ (green) cells displayed for each condition and time point. A reduced number of events is shown for clarity (see quantification of total populations in Supplemental Fig. S4F).
Figure 4.
Figure 4.
Common and distinct transcriptional signatures upon SPT6 and CAF-1 loss in iGMPs. (A) Venn diagrams showing the overlap of upregulated or downregulated differentially expressed genes between SPT6 KD, CAF-1 KD, and neutrophils determined by RNA-seq after 48 h of treatment. Fold changes were calculated relative to iGMPs. (LFC) Log2 transformed fold change. (B) The percentages of total DEGs that are upregulated or downregulated within each condition. The number of DEGs is presented within the respective bars. (C) RNA-seq XY plots showing pairwise comparisons of gene log2 transformed fold changes (LFCs). For each plot, genes differentially expressed (FDR < 0.05 and |LFC| > 1) in both conditions are shown in black. Genes differentially expressed in only one of the displayed conditions (unique DEGs) are colored according to their respective conditions. Dotted lines indicate twofold change cutoffs. The number of common DEGs in each quadrant is given with the percentage of all common DEGs. Select genes are labeled following the same color scheme. LFCs represent n = 2 clonal replicates. Pearson's correlation coefficient (r) is provided with P-values < 2.2 × 10⁻¹⁶. (D) RNA-seq volcano plot. Log2 transformed fold changes (LFCs) of genes in each respective condition compared with iGMPs are displayed on the X-axis, and −log10 transformed false discovery rates (FDRs) are displayed on the Y-axis. Black circles represent individual gene quantifications from all differentially expressed genes (|LFC| > 1 and FDR < 0.05). Red dots represent CAF-1 silenced multilineage genes as described by Franklin et al. (2022). Nondifferentially expressed (nc/ns; |LFC| < 1 or FDR > 0.05) detected genes are displayed as gray dots. Data represent n = 2 clonal replicates. (E) Heat map showing log2 transformed fold changes (LFCs) for selected genes relative to iGMPs. SPT6 KD, CAF-1 KD, and neutrophil conditions are presented in columns, with genes presented in rows. Genes are grouped according to function as described by Do et al. (2024). LFC represents n = 2 clonal replicates. (F) EnrichR gene ontology analysis of upregulated DEGs (LFC > 1 and FDR < 0.05). Gene symbols of upregulated and downregulated genes (see Supplemental Fig. S4B) were used to find enriched gene sets from the MSigDB Hallmark 2020 data set. −log10 adjusted P-value (Padj) of enrichment scores are shown on the Y-axis. The names of individual gene sets are displayed on the X-axis. Dots indicate enrichment scores for SPT6 (green), CAF-1 (red), or HOXA9 (blue) KD DEGs. The dotted line represents Padj = 0.05.
Figure 5.
Figure 5.
SPT6 and CAF-1 coordinate regulation of distinct chromatin environments. (A) Venn diagrams showing the overlap of opened (LFC > 1 and FDR < 0.05) or closed (LFC < −1 and FDR < 0.05) differentially accessible regions (DARs) between SPT6 KD, CAF-1 KD, and neutrophil differentiation. Opening and closing are quantified with ATAC-seq and relative to accessibility in iGMPs. (LFC) Log2 transformed fold change. (B) Stacked bar plot showing proportions of DARs that are opened or closed for each condition, with the number of DARs displayed inside the bar. (C) ATAC-seq metaplots showing mean counts per million over differentially accessible regions (DARs). Metaplots for each condition (colored lines) are overlaid on the corresponding ATAC-seq signal in iGMPs (black lines). The X-axis represents the center of each DAR as 0, with a ±1.5 kb genomic window. Metaplots represent n = 2 clonal replicates and quantify average counts per million over 10 bp bins. (D) Stacked bar plots showing proportions of opened and closed DARs annotated to genomic regions. Promoters are defined as within 1.5 kb upstream of or 500 bp downstream from annotated transcription start sites. UTRs are defined as DARs overlapping annotated 5′ or 3′ genic untranslated regions. Exons and introns are DARs that overlap annotated exonic or intronic regions, respectively. Intergenic regions are defined as all other DARs not overlapping one of the other genomic features. Annotations are presented in the order of priority and assigned with at least 1 bp overlap. (E) ChIP-seq (H3K27ac and H3K4me3) and CUT&RUN (H3K4me1, H3K27me3, and H3K9me3) metaplots showing mean signal in iGMPs (fold change enrichments over input or IgG, respectively). Mean signal is averaged in 10 bp bins over 3 kb windows centered on opened or closed DARs from each condition (|LFC| > 1 and FDR < 0.05) or on ATAC-seq peaks not differentially accessible (no change; |LFC| < 0 or FDR > 0.05). Metaplots represent n = 3 (H3K27ac, H3K4me1, H3K9me3, and H3K27me3) and n = 2 (H3K4me3) independent experiments. (F) H3K27me3 CUT&RUN and H3K4me3 ChIP-seq metaplots, as shown in E, showing mean signal in iGMPs. Mean signal is averaged in 10 bp bins over 3 kb windows centered on TSSs of differentially expressed genes (RNA-seq read counts with |LFC| > 1 and FDR < 0.05) in each condition or centered on randomly sampled TSSs from genes not differentially expressed (no change; |LFC| < 0 or FDR > 0.05) or from genes not detected (RNA-seq CPM = 0 in all conditions). (G) Box plots summarizing the gene-wise log2 transformed RNA-seq counts per million (CPM) of all detected genes (black box plots) in each condition. The median, second/third quartiles, and 1.5× interquartile range are represented as the center line, box bounds, and extended lines, respectively. Red and blue dots represent lowly expressed (<3 CPM in iGMPs) genes with H3K27me3-marked (red) or H3K4me3-marked (blue) promoters. Mean CPMs are represented for n = 2 clonal replicates. Pairwise Wilcoxon rank sum tests were performed with Holm's correction for multiple comparisons. (*) P = 0.018, (**) P = 0.00022, (***) P < 2.2 × 10⁻¹⁶. (H) Genomic snapshots of SPT6 KD- and CAF-1 KD-responsive genes from the IGV genome browser using the mm10 reference. Baseline chromatin tracks are displayed as base-pair resolution fold change over background (input for H3K27ac, H3K4me3 ChIP-seq, and IgG for H3K4me1, H3K27me3, and H3K9me3 CUT&RUN) in iGMPs. ATAC-seq tracks are base-pair resolution counts per million (CPM) in each indicated condition (iGMPs, SPT6 KD, CAF-1 KD, or neutrophils). RNA-seq tracks are displayed as base-pair resolution CPM in each indicated condition. Schematics for expressed genes are displayed below the snapshots, with UTRs, exons, and introns represented. Arrows indicate the direction of transcription. Bracketed numbers represent the scale maximum. Shaded boxes display regions of interest within the snapshot associated with accessibility changes and certain histone mark enrichments. A scale bar and starting coordinate are shown for each locus.
Figure 6.
Figure 6.
SPT6 uniquely maintains AP-1 (FOS/JUN family) binding sites. (A) TOBIAS ATAC-seq footprinting volcano plot showing the predicted changes in total transcription factor binding between SPT6 KD and CAF-1 KD. Red dots represent genes from the TNF-α signaling via NF-kB gene set (see Fig. 4F), with the FOS and JUN transcription factor family labeled. (B) Schematic of AP-1 TF miniscreen depleting FOS and JUN TFs in the context of SPT6 KD, CAF-1 KD, and neutrophil differentiation conditions. (C) Heat map of cKit+ and GFP+ population fold changes quantified by flow cytometry relative to scrambled shRNA (shCtrl) in each condition. Log2 fold changes for n = 2 clonal replicates are shown in individual columns. (D) Reverse transcription quantitative PCR (RT-qPCR) of Fosl2 mRNA for n = 2 clonal replicates in iGMPs transduced with shCtrl, shFosl2-1, or shFosl2-2, quantified 3 days after infection. (E) Histogram showing FOSL2 expression quantified by flow cytometry. iGMPs were transduced with two independent shRNAs targeting Fosl2 and compared with shCtrl cells transduced with scrambled shRNA. Depletion was quantified 3 days after infection. Histograms are representative of n = 2 clonal replicates. (F) Bar plot summarizing FOSL2 expression with mean fluorescence intensity (MFI) shown in E relative to the shCtrl. The mean of n = 2 clonal replicates. (G) Histograms showing GFP expression quantified with flow cytometry 5 days after transducing nontargeting shRNA (shCtrl) or Fosl2 shRNAs, including 2 days of inducing with SPT6 KD, CAF-1 KD, and neutrophil differentiation. Representative of n = 2 clonal replicates. (H) Bar plots summarizing GFP mean fluorescence intensity (MFI; from samples in G) relative to shCtrl.
Figure 7.
Figure 7.
SPT6 and CAF-1 perturbations induce divergent differentiation paths. (A) Morphology of iGMPs after 0, 24, 48, or 72 h of SPT6 KD, CAF-1 KD, or neutrophil differentiation. Magnification, 1000×. Scale bar, 10 µm. Experiment was repeated independently in two clones with similar results. (B) Phagocytosis flow cytometric assay. Density plots of iGMPs and 72 h after induction for each condition, showing GFP signal versus fluorescently labeled bacterial particles (pHrodo). (C) Phagocytosis time-course analysis reflecting the percentage of GFP+/pHrodo+ cells (B shows a representative example of gating) for iGMPs and after 24, 48, or 72 h of SPT6 KD, CAF-1 KD, and neutrophil differentiation. The line connects the mean of two clonal replicates with the range displayed. (D) UMAP analysis of single-cell transcriptomes in iGMPs (n = 1419), 48 h of SPT6 KD (n = 1220), and 48 h of CAF-1 KD (n = 1425). Single cells are colored according to unsupervised cluster assignment (see the Materials and Methods). (E) UMAP analysis as in D with cells colored according to treatment (iGMPs, SPT6 KD, or CAF-1 KD). (F) UMAP feature plots representing lineage scores summarizing average signal over background for gene sets enriched in primary granulocyte–macrophage progenitors (GMPs), macrophages, or neutrophils (see the Materials and Methods; Supplemental Fig. S10B,C). (G) UMAP feature plot displaying the log-normalized expression of select macrophage-specific marker genes Adgre1 and Cd14. (H) Representative flow cytometry contour plot representing CD11b (pan-myeloid marker) and Gr-1 (neutrophil-specific marker) expression in iGMPs or after 72 h of SPT6 KD, CAF-1 KD, or neutrophil differentiation. Contours are colored according to each condition. (I) Time-course analysis of percent populations based on CD11b versus Gr1 expression. Representative gating as shown in H. (J) Representative flow cytometry analysis measuring the expression of F4/80 (macrophage-specific), CD105 (erythroid-specific), or Sca1 (stemness marker) in iGMPs or 72 h after SPT6 KD, CAF-1 KD, or neutrophil differentiation. (K) Bar plot showing F4/80 expression after 48 h of SPT6 KD in cells transduced with shCtrl, shFosl2-1, or shFosl2-2 (as shown in Fig. 6B). n = 2 clonal replicates. (L) Phagocytosis flow cytometric assay quantifying the percentage of phagocytic differentiated cells (GFP+/pHrodo+) in iGMPs and after 48 h of SPT6 KD, CAF-1 KD, and neutrophil differentiation in cells transduced with shCtrl, shFosl2-1, or shFosl2-2 (as shown in Fig. 6B). Mean of n = 2 clonal replicates.

Similar articles

References

    1. Abe Y, Kofman ER, Ouyang Z, Cruz-Becerra G, Spann NJ, Seidman JS, Troutman TD, Stender JD, Taylor H, Fan W, et al. 2024. A TLR4/TRAF6-dependent signaling pathway mediates NCoR coactivator complex formation for inflammatory gene activation. Proc Natl Acad Sci 121: e2316104121. 10.1073/pnas.2316104121 - DOI - PMC - PubMed
    1. Aoi Y, Shah AP, Ganesan S, Soliman SHA, Cho B-K, Goo YA, Kelleher NL, Shilatifard A. 2022. SPT6 functions in transcriptional pause/release via PAF1C recruitment. Mol Cell 82: 3412–3423.e5. 10.1016/j.molcel.2022.06.037 - DOI - PMC - PubMed
    1. Avvakumov N, Nourani A, Côté J. 2011. Histone chaperones: modulators of chromatin marks. Mol Cell 41: 502–514. 10.1016/j.molcel.2011.02.013 - DOI - PubMed
    1. Barlow JH, Faryabi RB, Callén E, Wong N, Malhowski A, Chen HT, Gutierrez-Cruz G, Sun H-W, McKinnon P, Wright G, et al. 2013. Identification of early replicating fragile sites that contribute to genome instability. Cell 152: 620–632. 10.1016/j.cell.2013.01.006 - DOI - PMC - PubMed
    1. Becht E, McInnes L, Healy J, Dutertre C-A, Kwok IWH, Ng LG, Ginhoux F, Newell EW. 2019. Dimensionality reduction for visualizing single-cell data using UMAP. Nat Biotechnol 37: 38–44. 10.1038/nbt.4314 - DOI - PubMed

MeSH terms

LinkOut - more resources