. 2025 Apr 16;15(1):13145.
doi: 10.1038/s41598-025-95958-z.

Meta-frequency modulation in LQR vibration control with chirp excitation

Affiliations

Meta-frequency modulation in LQR vibration control with chirp excitation

Simone Mesbahi et al. Sci Rep. .

Abstract

This paper presents a comprehensive analysis of the indirect control of inertial properties of a rigid bodies system by semi-actively modifying the viscosity of tunable dampers. Linear Quadratic Regulator (LQR) optimal control logic and Hilbert-Huang Transform (HHT) analysis are employed to investigate its impact on the system response. The study utilizes a simple 2-d.o.f. architecture, referred to as the Toy Model, to demonstrate how proper selection of the damping coefficient allows for manipulation of the equivalent mass and variation of the natural frequency within a specific resonant band. Chirp excitations are applied to the Toy Model, and an iterative LQR scheme is implemented to optimally control the damping coefficient, thereby preventing resonance. Given that the adoption of the semi-active controller significantly alters the primary mass response, it is crucial to establish the cause-and-effect relationship between the control law and system response, which is achieved through the HHT. Notably, the proposed model is the first known example of a physical system that exhibits both intra- and inter-wave modulations of the instantaneous frequency of the main mass response, leading to a meta-phenomenon here defined as meta-frequency modulation. This meta-frequency modulation nonlinearly distorts the response of the optimally controlled system compared to passive optimization.

Keywords: Empirical mode decomposition; Hilbert transform; Inter-wave; Intra-wave; Linear quadratic regulator.


Conflict of interest statement

Declarations. Competing interests: The authors declare no competing interests.

Figures
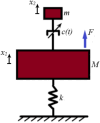
Fig. 1
Fig. 1
Toy Model architecture with a single small auxiliary mass-damper device.
Fig. 2
Fig. 2
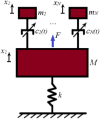
Toy Model architecture with several small auxiliary mass-damper devices.
Fig. 3
Fig. 3
In (a) the response of the Toy model excited by an impulse of velocity for different damping coefficient values and in (b) the corresponding IFs.
Fig. 4
Fig. 4
FRF of the Toy Model system.
Fig. 5
Fig. 5
Comparison between LQR controlled solutions (blue and red lines) and the optimized (green line) and non-optimized (black dotted line) passive solutions for the main mass in (a)–(c), and for the auxiliary mass in (b)–(d).
Fig. 6
Fig. 6
Comparison between the displacements amplitudes of the LQR controlled responses and the optimized and non-optimized passive responses of the main mass with respect to the resonant band (magenta dotted lines) of the Toy Model system.
Fig. 7
Fig. 7
Optimal damping coefficient control laws for the LQRlow in (a) and LQRhigh settings in (b) (focus over 1 s-window).
Fig. 8
Fig. 8
In (a) I pole, in (b) II pole and in (c) III pole of the TF of the Toy Model system computed by substituting the optimal damping coefficient control law produced by the LQRlow setting.
Fig. 9
Fig. 9
Current resonant frequency of the Toy Model system corresponding to the LQRlow in (a) and LQRhigh settings in (b) (focus over 1 s-window).
Fig. 10
Fig. 10
Comparison between the control frequency formula image, the current resonant frequency of the Toy Model system and the formula image of the chirp excitation for the LQRlow in (a) and LQRhigh settings in (b).
Fig. 11
Fig. 11
Ratio formula image between the characteristic frequency formula image and the formula image of the chirp excitation for the LQRlow and LQRhigh settings.
Fig. 12
Fig. 12
In (a)–(c)–(e) main IMFs and in (b)–(d)–(f) corresponding IFs obtained from the application of the HHT to the optimal damping coefficient coming from the LQRlow setting (i, u and j∙ext in the legend of subfigures (b)–(d)–(f) stand for IFi, u and j∙IFext,th and so on).
Fig. 13
Fig. 13
In (a)–(c)–(e) main IMFs and in (b)–(d)–(f) corresponding IFs obtained from the application of the HHT to the optimal damping coefficient coming from the LQRhigh setting (i, u and j∙ext in the legend of subfigures (b)–(d)–(f) stand for IFi, u and j∙IFext,th and so on).
Fig. 14
Fig. 14
Comparison between: (a) the damping force corresponding to the optimized passive setting (green) and the control damping forces coming from LQRlow (blue) in (b) and LQRhigh (red) settings (c).
Fig. 15
Fig. 15
In (a) main IMF and in (b) corresponding IF associated with the damping force coming from the optimized passive setting.
Fig. 16
Fig. 16
In (a)–(c)–(e)–(g) main IMFs and in (b)–(d)–(f)–(h) corresponding IFs associated with the control damping force coming from the LQRlow setting (i, u and j∙ext in the legend of subfigures (b)–(d)–(f)–(h) stand for IFi, u and j∙IFext,th and so on).
Fig. 17
Fig. 17
In (a)–(c)–(e)–(g) main IMFs and in (b)–(d)–(f)–(h) corresponding IFs associated with the control damping force coming from the LQRhigh setting (i, u and j∙ext in the legend of subfigures (b)–(d)–(f) stand for IFi, u and j∙IFext,th and so on).
Fig. 18
Fig. 18
Morlet WT of the control damping force coming from the LQRhigh setting.
Fig. 19
Fig. 19
In (a) main IMF and in (b) corresponding IF associated with the displacement response of the main mass obtained for the optimized passive setting.
Fig. 20
Fig. 20
In (a) main IMF and in (b) corresponding IF associated with the displacement response of the main mass obtained for the LQRlow setting.
Fig. 21
Fig. 21
Comparison between the analytical model wave formula image in and the corresponding IMF in (a) together with the comparison between the analytical instantaneous frequency formula image and the IF associated with the IMF of formula image in (b).
Fig. 22
Fig. 22
In (a)–(b) the main features of formula image and in (c) their resulting contribute.
Fig. 23
Fig. 23
In (a) main IMF and in (b) corresponding IF associated with the displacement response of the main mass obtained for the LQRhigh setting.
Fig. 24
Fig. 24
Experimental setup.
Fig. 25
Fig. 25
Experimental flowchart.

References

    1. Liu, Y., Matsuhisa, H. & Utsuno, H. Semi-Active vibration isolation system with variable stiffness and damping control. J. Sound. Vib.313(1–2), 16–28. 10.1016/j.jsv.2007.11.045 (2008).
    1. Le, T. D. & Ahn, K. K. Experimental investigation of a vibration isolation system using negative stiffness structure. Int. J. Mech. Sci.70, 99–112. 10.1016/j.ijmecsci.2013.02.009 (2013).
    1. Miah, M. S., Chatzi, E. N. & Weber, F. Semi-active control for vibration mitigation of structural systems incorporating uncertainties. Smart Mater. Struct.24, 055016. 10.1088/0964-1726/24/5/055016 (2015).
    1. Wei, X., Zhu, M. & Jia, L. A semi-active control suspension system for railway vehicles with magnetorheological fluid dampers. Veh. Syst. Dyn. Int. J. Veh. Mech. Mobil.54(7), 982–1003. 10.1080/00423114.2016.1177189 (2016).
    1. Ata, W. G. & Salem, A. M. Semi-active control of tracked vehicle suspension incorporating magnetorheological dampers. Veh. Syst. Dyn. Int. J. Veh. Mech. Mobil.55(5), 626–647. 10.1080/00423114.2016.1273531 (2017).

LinkOut - more resources