. 2025 Apr 16;16(1):3624.
doi: 10.1038/s41467-025-59017-5.

Molecular structure and enzymatic mechanism of the human collagen hydroxylysine galactosyltransferase GLT25D1/COLGALT1

Affiliations

Molecular structure and enzymatic mechanism of the human collagen hydroxylysine galactosyltransferase GLT25D1/COLGALT1

Matteo De Marco et al. Nat Commun. .

Abstract

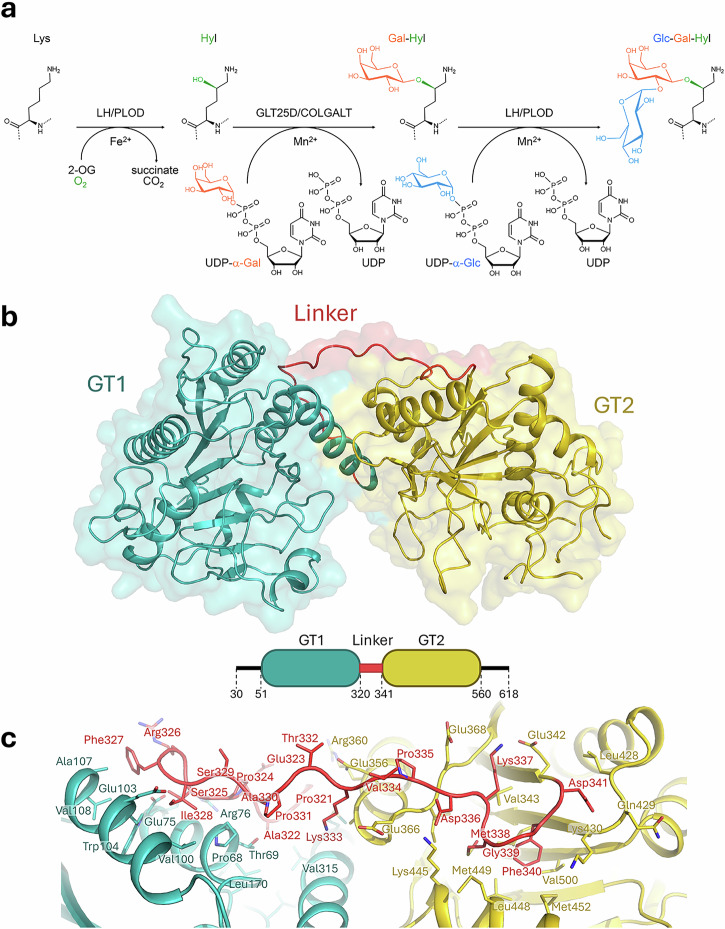
During collagen biosynthesis, lysine residues undergo extensive post-translational modifications through the alternate action of two distinct metal ion-dependent enzyme families (i.e., LH/PLODs and GLT25D/COLGALT), ultimately producing the highly conserved α-(1,2)-glucosyl-β-(1,O)-galactosyl-5-hydroxylysine pattern. Malfunctions in these enzymes are linked to developmental pathologies and extracellular matrix alterations associated to enhanced aggressiveness of solid tumors. Here, we characterized human GLT25D1/COLGALT1, revealing an elongated head-to-head homodimeric assembly. Each monomer encompasses two domains (named GT1 and GT2), both unexpectedly capable of binding metal ion cofactors and UDP-α-galactose donor substrates, resulting in four candidate catalytic sites per dimer. We identify the catalytic site in GT2, featuring an unusual Glu-Asp-Asp motif critical for Mn2+ binding, ruling out direct catalytic roles for the GT1 domain, but showing that in this domain the unexpectedly bound Ca2+ and UDP-α-galactose cofactors are critical for folding stability. Dimerization, albeit not essential for GLT25D1/COLGALT1 activity, provides a critical molecular contact site for multi-enzyme assembly interactions with partner multifunctional LH/PLOD lysyl hydroxylase-glycosyltransferase enzymes.


Conflict of interest statement

Competing interests: The authors declare no competing interests.

Figures

Fig. 1
Fig. 1. Biochemical and structural features of human GLT25D1/COLGALT1.
a Reaction scheme showing the collagen Lys–to–Glc-Gal-Hyl conversion post-translational modification process mediated by the alternate action of LH/PLOD and GLT25D1/COLGALT1, with color highlight of donor substrates and associated products. b Cartoon representation of the crystal structure of human GLT25D1/COLGALT1, showing the domain architecture of the enzyme with GT1 and GT2 domains connected via a rigid linker element, anchored to both domains via hydrophobic anchorages shown in details in (c).
Fig. 2
Fig. 2. GLT25D1/COLGALT1 forms stable elongated dimers.
a Structure of dimeric full-length GLT25D1/COLGALT1 enzyme, showing two molecules interconnected through their N-terminal domains. b Mass photometry analysis of recombinant wild-type GLT25D1/COLGALT1 samples. c Comparison of the GLT25D1/COLGALT1 dimer observed in the crystal structure with solution SAXS data (red circles) yields a χ2 of 7.62 (dashed line). Modeling of the N- and C-terminal flexible loops (shown as blue and spheres, respectively) yields a structural model of the dimeric enzyme (represented as a white cartoon) with improved fitting of the experimental solution SAXS data, resulting in χ2 of 1.89 (solid line). d Comparison of negative stain electron microscopy single particle 2D classes (gray background) with selected orientations of computed projections of the GLT25D1/COLGALT1 crystal structure (black background) shows matching molecular projections.
Fig. 3
Fig. 3. Probing GLT25D1/COLGALT1 dimeric architecture and its functional significance.
a Details of the dimeric interface, showing amino acid residues involved in the direct contacts between the two monomers. The bottom panel shows an open-book rendering of the two GLT25D1/COLGALT1 monomers, with the colored footprint of the dimerization partner on the molecular surface. b Results of the mass photometry comparison of wild-type GLT25D1/COLGALT1 and the Trp158Arg mutant, designed to disrupt the dimer interface. c Results of the SEC-MALS comparison of wild-type GLT25D1/COLGALT1 and the Trp158Arg mutant, showing alterations of the elution volume as well as molar mass. d Comparison of the Gal-T enzymatic activity of GLT25D1/COLGALT1 wild-type and Trp158Arg mutant using luminescence. The Michaelis-Menten curves show the steady-state kinetics characterization, described as apparent turnover number (v0/[enzyme]) as a function of gelatin substrate concentration. Quantitation of KM and kcat values for both wild-type and Trp158Arg mutant is provided in Supplementary Table 5. Error bars represent standard deviations from average of triplicate independent experiments. e Abundance ratios of wild-type and Trp158Arg GLT25D1/COLGALT1 GLT25D1Lys145-LH3Lys645 inter-protein cross-links (orange), GLT25D1Lys145 and LH3Lys645 mono-links (cyan), and total GLT25D1/COLGALT1 and LH3/PLOD3 peptides (green) detected in the XL-MS/MS experiments. The relative abundance of LH3/PLOD3 and GLT25D1/COLGALT1 proteins was calculated from the 10 most abundant peptides per protein. Data are reported as mean. Individual peptide and cross-link abundance ratios are shown as dots. (Mean ± SD: LH3/PLOD3 1.07 ± 0.11, GLT25D1/COLGALT1 1.02 ± 0.12); median values are 1.02 for LH3/PLOD3 and 1.00 for GLT25D1/COLGALT1, with interquartile ranges of 1.01–1.12 and 0.95–1.09, respectively. The minimum and maximum values observed were 0.96–1.30 for LH3/PLOD3 and 0.83–1.27 for GLT25D1/COLGALT1.
Fig. 4
Fig. 4. Structural insights into GLT25D1/COLGALT1 enzymatic activity and assembly.
a The GT1 domain is constitutively populated by a divalent metal ion (labeled as M2+, shown with a purple sphere) and UDP-α-Gal, as shown in the FoFc omit electron density map (contour level 3.2 σ). Residues involved in coordination of the metal ion and interaction with the donor substrate are shown as sticks. b LIGPLOT+ diagram illustrating the interaction network for donor substrates and cofactors observed in the GT1 domain. c When co-crystallized with excess Mn2+ and UDP-α-Gal, also the electron density of the GT2 domain (FoFc omit map, contour level 3.2 σ) shows presence of donor substrates and cofactors. In this domain, the galactose moiety of the donor substrate is not visible, hence only UDP has been modeled (shown as sticks). Residues involved in coordination of the metal ion and interaction with the donor substrate are shown as sticks. d LIGPLOT+ diagram illustrating the interaction network for donor substrates and cofactors observed in the GT2 domain. e Binding of Mn2+ and UDP-α-Gal induces conformational changes in the GT2 domain, by stabilizing the otherwise flexible C-terminal loop through direct interactions with the cofactor and the donor substrate. Shown is the superposition of GLT25D1 GT2 domains in substrate-free (light orange cartoon) versus substrate-bound (light blue cartoon) states, with highlight of the loop comprising residues 560–574 (brown), stabilized only when Mn2+ and UDP-α-Gal are present.
Fig. 5
Fig. 5. Structure-guided interpretation of GLT25D1/COLGALT1 functional features.
a Amino acid conservation diagram for different GLT25D/COLGALT homologs. The colors represent the different degree of amino acid conservation from dark blue (not conserved at all) to dark purple (fully conserved). The complete list used for the representation and the associated alignment is shown in Supplementary Figs. 6 and 7. b Luminescence-based comparison of the Gal-T enzymatic activity of wild-type GLT25D1/COLGALT1 and mutants designed to interfere with cofactor and substrate binding in the GT2 domain. The histograms show the average result of triplicate independent measurements (whose results are individually shown as overlayed dots). Error bars represent standard deviations from average of four independent experiments; Statistical evaluations based on pair sample comparisons between control and assay values using Student’s t-test. ****P-value < 0.0001. c A salt bridge involving Arg351 and Asp570 from the flexible C-terminal loop (blue) shapes the GLT25D1/COLGALT1 GT2 catalytic site when enzyme cofactors are bound. Mn2+ is shown as a purple sphere coordinated to Glu437. UDP as well as amino acid side chains directly involved in the described interactions are shown as sticks. d Mapping of the sites affected by known pathogenic mutations on the GLT25D1/COLGALT1 structure. Residues found mutated in the homologous fosse mouse phenotype (Trp135) and in cerebral small vessel disease (Leu151Arg, Ala154Pro, Gly377Arg) are shown in red and highlighted by arrows.
Fig. 6
Fig. 6. Probing the structural role of metal ions and cofactors in GLT25D1/COLGALT1 GT1 and GT2 domains.
a DSF analysis of wild-type GLT25D1 (left) incubated with Mn2+ (purple trace) shows significant stabilization induced by binding of the metal ion when compared to untreated samples (blue trace); removal of amino acid side chains critical for binding of metal ions in the GT2 domain such as Glu435 (center) and Asp437 (right) results in loss of the metal ion-induced stabilization effect. b DSF analysis of GLT25D1/COLGALT1 subject to EDTA (green trace) and EGTA (orange trace) treatment, showing the destabilization induced by metal ion chelation when compared to untreated samples (blue trace); Comparison between wild type (left) and mutants in the GT2 domain highlight very similar destabilization effects. c EDTA-treated samples show alterations in dispersity when tested using mass photometry. d EDTA-treated samples show altered elution profiles when tested using size-exclusion chromatography. e Native-MS spectra under partially-denaturing conditions of wild-type 30+ charge state (left) and Trp158Arg 31+ charge state (center), with the signals corresponding to the free protein and protein-ligand complex labeled; box plot (bounds: percentile 25–75%; mean value: black line; whiskers: maxima-minima) of ligand mass calculation obtained from the entire charge state distribution (n = 6 for wild-type, n = 7 for Trp158Arg) of Native-MS spectra (right); reference lines report the theoretical ligand mass as a function of distinct divalent cation cofactors.

References

    1. Bourhis, J. M. et al. Structural basis of fibrillar collagen trimerization and related genetic disorders. Nat. Struct. Mol. Biol.19, 1031–1036 (2012). - PMC - PubMed
    1. Fidler, A. L., Boudko, S. P., Rokas, A. & Hudson, B. G. The triple helix of collagens—an ancient protein structure that enabled animal multicellularity and tissue evolution. J. Cell Sci.131, jcs203950 (2018). - PMC - PubMed
    1. Myllyharju, J. & Kivirikko, K. I. Collagens and collagen-related diseases. Ann. Med.33, 7–21 (2001). - PubMed
    1. Ishikawa, Y. & Bachinger, H. P. A molecular ensemble in the rER for procollagen maturation. Biochim. Biophys. Acta1833, 2479–2491 (2013). - PubMed
    1. Gelse, K., Poschl, E. & Aigner, T. Collagens-structure, function, and biosynthesis. Adv. Drug Deliv. Rev.55, 1531–1546 (2003). - PubMed

LinkOut - more resources