Clinical Trial
. 2025 May;641(8064):971-977.
doi: 10.1038/s41586-025-08700-0. Epub 2025 Apr 16.

Phase I/II trial of iPS-cell-derived dopaminergic cells for Parkinson's disease

Affiliations
Clinical Trial

Phase I/II trial of iPS-cell-derived dopaminergic cells for Parkinson's disease

Nobukatsu Sawamoto et al. Nature. 2025 May.

Abstract

Parkinson's disease is caused by the loss of dopamine neurons, causing motor symptoms. Initial cell therapies using fetal tissues showed promise but had complications and ethical concerns1-5. Pluripotent stem (PS) cells emerged as a promising alternative for developing safe and effective treatments6. In this phase I/II trial at Kyoto University Hospital, seven patients (ages 50-69) received bilateral transplantation of dopaminergic progenitors derived from induced PS (iPS) cells. Primary outcomes focused on safety and adverse events, while secondary outcomes assessed motor symptom changes and dopamine production for 24 months. There were no serious adverse events, with 73 mild to moderate events. Patients' anti-parkinsonian medication doses were maintained unless therapeutic adjustments were required, resulting in increased dyskinesia. Magnetic resonance imaging showed no graft overgrowth. Among six patients subjected to efficacy evaluation, four showed improvements in the Movement Disorder Society Unified Parkinson's Disease Rating Scale part III OFF score, and five showed improvements in the ON scores. The average changes of all six patients were 9.5 (20.4%) and 4.3 points (35.7%) for the OFF and ON scores, respectively. Hoehn-Yahr stages improved in four patients. Fluorine-18-L-dihydroxyphenylalanine (18F-DOPA) influx rate constant (Ki) values in the putamen increased by 44.7%, with higher increases in the high-dose group. Other measures showed minimal changes. This trial (jRCT2090220384) demonstrated that allogeneic iPS-cell-derived dopaminergic progenitors survived, produced dopamine and did not form tumours, therefore suggesting safety and potential clinical benefits for Parkinson's disease.


Conflict of interest statement

Competing interests: N.S., R.T. and J.T. received a grant for collaborative research from Sumitomo Pharma. R.T. received a research grant from Nihon Medi-Physics. T.O. received a research grant from Siemens Healthcare. S.H. is an employee of Sumitomo Pharma. The other authors declare no competing interests.

Figures

Fig. 1
Fig. 1. Enrolment and follow-up.
a, Patients were recruited and evaluated at Kyoto University Hospital between August 2018 and January 2019. The first three patients were categorized into the low-dose subgroup, while the remaining four were classified into the high-dose subgroup. One registered patient was excluded before surgery owing to a COVID-19 infection. The first patient received unilateral surgeries with an eight-month interval between procedures and was included only in the safety assessment. Efficacy analysis was conducted on the remaining six patients. b, After providing informed consent, the patients were enrolled in this clinical trial and underwent neurological evaluation for more than 6 months. If no notable symptomatic changes were observed during this period, patients were re-enrolled for surgery and underwent further neurological evaluation (including MDS-UPDRS) and an 18F-DOPA PET study. After cell transplantation, brain imaging (MRI and PET) and neurological assessments (including MDS-UPDRS) were performed at 3, 6, 12, 18 and 24 months. PET studies included 18F-DOPA (to assess DA synthesis), 18F-GE180 (to detect inflammation) and 18F-FLT (to assess cell proliferation). For immunosuppression, tacrolimus (0.06 mg per kg twice daily) was administered, with the dosage adjusted to maintain target trough levels of 5–10 ng ml−1. The dose was reduced by half at 12 months and discontinued at 15 months.
Fig. 2
Fig. 2. Chronological changes in clinical end points.
a,b, Chronological changes in the UDysRS scores for each patient from registration (0 months) to the end of the observation period (24 months) for safety assessment. b, Score changes from the baseline, with the mean represented by the black line. Absolute and relative (percentage) changes at 24 months are shown on the right. cf, Chronological changes in MDS-UPDRS part III scores during the medication-off (c,d) and medication-on (e,f) periods for each patient from registration (0 months) to the end of observation (24 months) for efficacy assessment. d,f, Score changes from the baseline. The mean is represented by the black line. The absolute and relative (percentage) changes at 24 months are shown on the right. Source data
Fig. 3
Fig. 3. DA synthesis detected by 18F-DOPA PET.
a,b, Chronological changes in 18F-DOPA Ki values (average of both sides) in the putamen for each patient from registration (0 months) to the end of the observation period (24 months). b, The Ki value changes from the baseline; the mean is represented by the black line. The absolute and relative (percentage) changes at 24 months are shown on the right. c, The 18F-DOPA Ki value (average of both sides) changes from the baseline in the caudate nucleus for each patient, indicating pathological deterioration in PD. d, The ratio of Ki values between the putamen and the caudate nucleus, highlighting the impact of cell transplantation on pathological deterioration. The percentage changes at 24 months are shown on the right. e, Semiquantitative 18F-DOPA images generated at 80–90 min after injection by subtracting the occipital background signal and normalizing the result to the occipital activity in patient PD08. The colour change from dark green to red in the bilateral putamen indicates increased 18F-DOPA uptake, reflecting DA synthesis by grafted cells. Pre-op, pre-operation; R, right. Source data
Extended Data Fig. 1
Extended Data Fig. 1. Single-cell RT-qPCR (sc-RT-qPCR) analysis of cells during DA differentiation.
a. t-SNE plot of sc-RT-qPCR data for iPSCs, intermediate cells (before CORIN-positive cell sorting), and final products. iPSCs and intermediate cells each form a distinct cluster, while final products are divided into two clusters. b. Relative proportions of cell types in each cell sample, determined by K-means clustering of sc-RT-qPCR data, indicate the final product consists of approximately 60% DA progenitors and 40% DA neurons. Batch #20022 was the donor cells used for PD04, Batch #20048 for PD05, Batch #21004 for PD06, and Batch #21047 for PD08. Batch #190909 was used for PD02. c. Violin plots of gene expression patterns in clusters of iPSCs, intermediate cells, and final products show gene expression changes during DA differentiation. d. Violin plots of gene expression patterns across different batches of final products indicate stable expression among batches. Source data
Extended Data Fig. 2
Extended Data Fig. 2. Transplantation of the same donor cells used for patients into rat PD models.
a-d. Immunofluorescence images of donor cells on day 30 (n = 7 independent experiments). NURR1 (a) is a nuclear receptor expressed in DA neurons, while FOXA2 (b) is a transcription factor expressed in the floor plate. DAPI (c) is used for nuclear staining. The merged image (d) shows that donor cells consist mainly of DA progenitors and some DA neurons. Scale bars = 100 μm. e. Summary of cell transplantation experiments and results. Low- and high-dose cell injections were administered to examine differences in cell survival and behavioural improvement. f-i. Methamphetamine-induced rotation behaviour in rats with grafts shows improvement at approximately 24 weeks. Data are presented as mean ± s.d. * p < 0.05, ** p < 0.01, *** p < 0.001 versus vehicle group by a two-way analysis of variance (ANOVA) with Tukey’s multiple comparisons test. f. Adjusted p value = 0.033 (20 weeks) and 0.045 (24 weeks). g. Adjusted p value = 0.006 (20 weeks), <0.001 (24 weeks), 0.002 (28 weeks), 0.011 (32 weeks, Vehicle vs. Cell 400 K), and <0.001 (32 weeks, Vehicle vs. Cell 800 K). h. Adjusted p value = 0.004 (20 weeks), 0.001 (28 weeks, Vehicle vs. Cell 500 K), and the others <0.001. i. Adjusted p value = 0.033 (12 weeks), 0.001 (20 weeks), 0.002 (32 weeks, Vehicle vs. Cell 500 K), 0.006 (32 weeks, Vehicle vs. Cell 1,000 K), and the others <0.001. jk. DAB staining for TH (tyrosine hydroxylase, a marker for DA neurons) in representative grafts at 32 weeks (n = 4 independent experiments). Scale bar = 2 mm. k. Magnified image of the graft shown in panel j. Scale bar = 500 μm. l. Immunofluorescence image of the graft double-labelled for TH and HNA-positive cells indicating donor-derived DA neurons (n = 4 independent experiments). Scale bar = 50 μm. m. Percentage of KI67-positive cells relative to HNA-positive cells for each graft. N = 8 (batch 20022), 7 (batch 20048), 9 (batch 21004), and 9 (batch 21047) biologically independent animals, respectively. Line = median. n. Immunofluorescence image of the graft stained for HNA (green) and KI67 (red), n = 4 independent experiments. Scale bar = 500 μm. o. Magnified image of the graft shown in panel n, with an arrowhead indicating an HNA/KI67 double-positive cell. p. Immunofluorescence image of the graft stained for HNA (green) and 5-HT (red), n = 4 independent experiments. Scale bar = 500 μm. q. Magnified image of the graft shown in panel p, showing the absence of HNA/5-HT double-positive cells. DAPI staining is shown in blue. Scale bar = 50 μm. r. Immunofluorescence image of the host Raphe nucleus as a positive control for serotonergic neurons (5-HT, red) DAPI staining is shown in blue (n = 4 independent experiments). Scale bar = 50 μm. Source data
Extended Data Fig. 3
Extended Data Fig. 3. Cell survival of iPSC-derived DA progenitors.
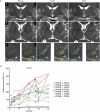
a. T2-weighted MR images of patient PD08, showing grafts as hyperintense areas. Coronal, axial, and sagittal images are displayed from top to bottom. Blue and yellow regions indicate areas within 3 mm of cell injection sites. b. Changes in graft volume as measured by T2-weighted MR images of each patient. Hyperintense areas within the blue and yellow regions were calculated (R: right and L: left). Source data
Extended Data Fig. 4
Extended Data Fig. 4. Changes in the Hoehn and Yahr scale for each patient.
The Hoehn and Yahr scale was evaluated at 3, 6, 12, 18, and 24 months. “ON” indicates measurements taken while the patient was on medication, while “OFF” indicates measurements taken after the patient had been off medication for more than 12 h. Source data
Extended Data Fig. 5
Extended Data Fig. 5. Changes in ON-time, OFF-time, PDQ−39 scores, and changes in levodopa equivalent daily dose (LEDD) for each patient.
a-f, Chronological changes in ON-time period, OFF-time period, and PDQ39 scores for each patient from registration (0 M) to the end of the observation period (24 M), respectively, based on the patient’s subjective perception. b,d,f, Score changes from baseline, with the mean represented by the black line. Absolute and relative (percentage) changes at 24 months are shown on the right. g,h, Changes in levodopa equivalent daily dose (LEDD) for each patient. Medication data for each patient was collected from medical charts, and LEDD was calculated according to a previously established method. g, Chronological changes in LEDD for each patient from registration (0 M) to the end of the observation period (24 M). h, Score changes from baseline, with the mean represented by the black line. Absolute and relative (percentage) changes at 24 months are shown on the right. Source data
Extended Data Fig. 6
Extended Data Fig. 6. Dopamine synthesis detected by 18F-DOPA PET.
a, Chronological changes in the fluorine-18-L-dihydroxyphenylalanine (18F-DOPA) Ki values for each side of the putamen for each patient from registration (0 M) to the end of the observation period (24 M), as a supplement to Fig. 3. b, Changes in Ki values from baseline, with the mean represented by the black line. c-h, semiquantitative 18F-DOPA images generated at 80–90 min post-injection by subtracting the occipital background signal and normalizing the result to the occipital activity for each patient (Pre-Op: pre-operation, 12 M: 12 months, 24 M: 24 months). The colour change from dark green to red in the bilateral putamen indicates increased 18F-DOPA uptake, reflecting dopamine synthesis by grafted cells. i,j, Relationship between 18F-DOPA uptake and motor symptom improvement. (i) Plots of pre- and post-transplant Ki values and MDS-UPDRS part III OFF scores for six (PD02-08) patients. Healthy and initial symptom ranges are indicated based on previous studies, where Ki values for healthy individuals range from 0.010 to 0.017, and initial Parkinsonian symptoms emerge with Ki values between 0.0045 and 0.0073. (j) Changes in Ki values and MDS-UPDRS part III OFF scores for each patient. Source data

References

    1. Kordower, J. H. et al. Neuropathological evidence of graft survival and striatal reinnervation after the transplantation of fetal mesencephalic tissue in a patient with Parkinson’s disease. N. Engl. J. Med.332, 1118–1124 (1995). - PubMed
    1. Piccini, P. et al. Dopamine release from nigral transplants visualized in vivo in a Parkinson’s patient. Nat. Neurosci.2, 1137–1140 (1999). - PubMed
    1. Barker, R. A., Barrett, J., Mason, S. L. & Bjorklund, A. Fetal dopaminergic transplantation trials and the future of neural grafting in Parkinson’s disease. Lancet Neurol.12, 84–91 (2013). - PubMed
    1. Freed, C. R. et al. Transplantation of embryonic dopamine neurons for severe Parkinson’s disease. N. Engl. J. Med.344, 710–719 (2001). - PubMed
    1. Olanow, C. W. et al. A double-blind controlled trial of bilateral fetal nigral transplantation in Parkinson’s disease. Ann. Neurol.54, 403–414 (2003). - PubMed

Publication types