. 2025 May;641(8065):1258-1267.
doi: 10.1038/s41586-025-08850-1. Epub 2025 Apr 16.

Multi-zonal liver organoids from human pluripotent stem cells

Affiliations

Multi-zonal liver organoids from human pluripotent stem cells

Hasan Al Reza et al. Nature. 2025 May.

Erratum in

Abstract

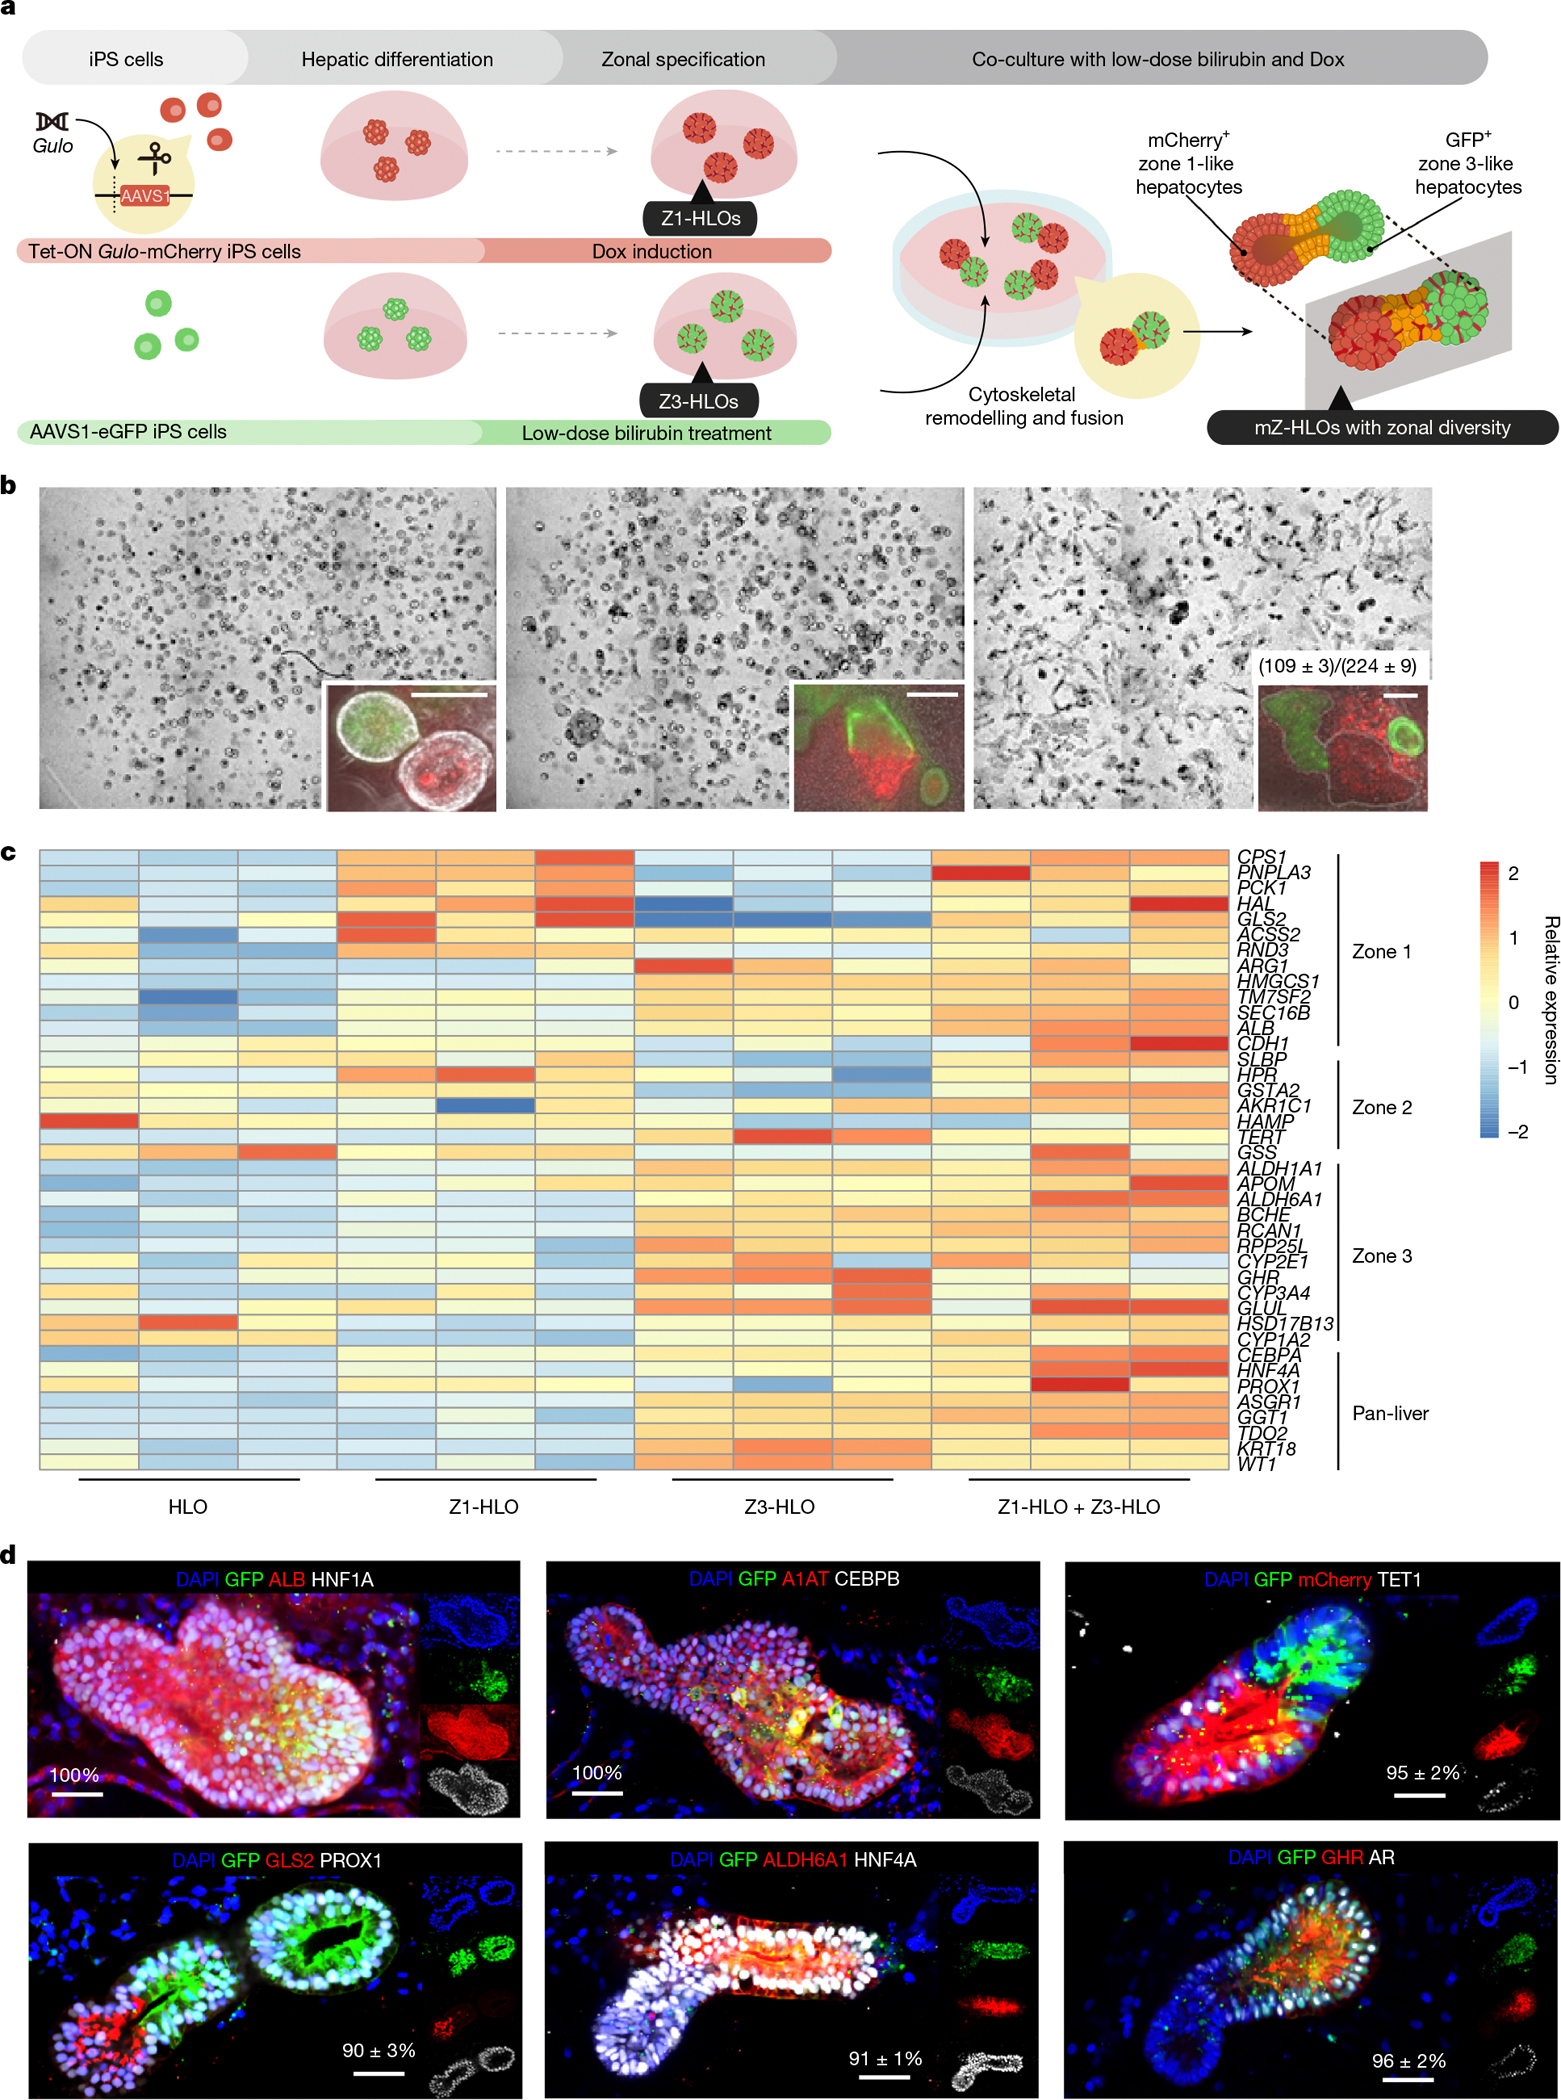
Distinct hepatocyte subpopulations are spatially segregated along the portal-central axis and are critical to understanding metabolic homeostasis and injury in the liver1. Although several bioactive molecules, including ascorbate and bilirubin, have been described as having a role in directing zonal fates, zonal liver architecture has not yet been replicated in vitro2,3. Here, to evaluate hepatic zonal polarity, we developed a self-assembling zone-specific liver organoid by co-culturing ascorbate- and bilirubin-enriched hepatic progenitors derived from human induced pluripotent stem cells. We found that preconditioned hepatocyte-like cells exhibited zone-specific functions associated with the urea cycle, glutathione synthesis and glutamate synthesis. Single-nucleus RNA-sequencing analysis of these zonally patterned organoids identifies a hepatoblast differentiation trajectory that dictates periportal, interzonal and pericentral human hepatocytes. Epigenetic and transcriptomic analysis showed that zonal identity is orchestrated by ascorbate- or bilirubin-dependent binding of EP300 to TET1 or HIF1α. Transplantation of the self-assembled zonally patterned human organoids improved survival of immunodeficient rats who underwent bile duct ligation by ameliorating the hyperammonaemia and hyperbilirubinaemia. Overall, this multi-zonal organoid system serves as an in vitro human model to better recapitulate hepatic architecture relevant to liver development and disease.


Conflict of interest statement

Competing interests: The authors declare no competing interests.

Figures

Extended Data Fig. 1 |
Extended Data Fig. 1 |. Intracellular redox management enables CPS1+ hepatocyte specification in HLOs.
a) H&E histology, GLS2 IHC, and GS IHC images of liver sections are shown in panels from ODS od/od (GULO mutant) rat treated with 0.2% Ascorbic acid (AsA), ODS od/od rat treated without AsA. Scale bars indicate 100 μm. The graph shows the GLS2 or GS positive area ratio versus the hematoxylin positive area in ODS od/od (GULO mutant) rat treated with 0.2% Ascorbic acid (AsA) and ODS od/od rat treated without AsA. Data points are shown for GLS2 area at portal vein (37 portal vein sections of + AsA rats, 27 portal vein sections of - AsA rats) and GS area in 8 images of +/− AsA rat. b) Schematic for development of Z1-HLOs and doxycycline induction to induce CPS1+ hepatocyte specification (left). Brightfield and fluorescence images of mCherry expression in ascorbate depleted Dox (100 ng/ml) treated Z1-HLOs compared to HLOs with ascorbic acid depletion at D20 and control HLOs (right). c) ELISA for mGULO protein concentration in Dox treated Z1-HLOs compared to control HLOs. (n = 9 independent experiments). d) Cellular Antioxidant concentration in Dox treated Z1-HLOs compared to control HLOs. (n = 9 independent experiments). e) ROS levels in Dox treated and extracellular ascorbate induced Z1-HLOs compared to control HLOs. (n = 9 independent experiments). f) RT-qPCR of genes for Z1-HLOs. (mean ± SD and n = 9 independent experiments). g) Albumin ELISA for Z1-HLOs treated with Dox compared to control HLOs and PHH normalized by cell viability. (n = 9 independent experiments). h) Immunofluorescence images of Dox treated Z1-HLOs for CPS1, ACSS2 and CDH1 compared to control HLOs and primary liver. Scale bar indicates 200 μm. (n = 3 independent experiments). In c-e, g data are represented as boxplots where the middle line is the median, the lower and upper hinges correspond to the first and third quartiles, the upper and lower whisker extends from the hinge to the largest and smallest value respectively no further than 1.5 × IQR from the hinge (where IQR is the inter-quartile range). c-e, f, g, one-way ANOVA with multiple comparisons and Tukey’s correction.
Extended Data Fig. 2 |
Extended Data Fig. 2 |. Low dose bilirubin promotes GLUL+ hepatocyte specification in HLOs.
a) Schematic for low dose bilirubin treatment and Z3-HLO development to induce GLUL+ expression. b) Cell viability assay with different concentration of bilirubin to titrate dose for maximal viability. (n = 9 independent experiments). c) Brightfield image of Z3-HLOs treated with low dose bilirubin (1 mg/L) compared to control, and luminal outline using ImageJ, arrows indicate luminal projections that are similar to bile canaliculi found in human liver. Scale bar indicates 200 μm. d) Comparison of size and circularity of lumen of the control and 1 mg/L bilirubin treated Z3-HLOs. (Data is mean ± SD, n = 9 independent experiments). e) Heatmap of Zone 3 genes from RNAseq dataset for bilirubin treated Z3-HLOs compared to control. f) RT-qPCR of genes for Z3-HLOs. (mean ± SD and n = 9 independent experiments). g) CYP3A4 activity assay in response to Rifampicin in control, Z1-, Z3-HLOs, and PHH (left). CYP1A2 activity assay in response to Omeprazole in control, Z1-, Z3-HLOs, and PHH (right). (n = 9 independent experiments). h) Immunofluorescence images of Z3-HLOs for GLUL, NR3C1 and CDH1 compared to control HLOs and primary liver. Scale bar indicates 200 μm. (n = 3 independent experiments). i) Heatmap of Z1- and Z3- HLOs depicting expression of zonal genes and lack of consensus expression of markers such as ARG1 and AKR1C1. j) Caspase 3 activity assay in Z3-HLOs (left) and cell viability assay in Z3-HLOs compared to Z1-HLOs after treatment with Zone 1 toxin (right). (n = 9 independent experiments). k) Caspase 3 activity assay in Z3-HLOs (left) and cell viability assay in Z3-HLOs compared to Z1-HLOs after treatment with Zone 3 toxin (right). (n = 9 independent experiments). In b, g, j, k data are represented as boxplots where the middle line is the median, the lower and upper hinges correspond to the first and third quartiles, the upper and lower whisker extends from the hinge to the largest and smallest value respectively no further than 1.5 × IQR from the hinge (where IQR is the inter-quartile range). b,f, g,j,k one-way ANOVA with multiple comparisons and Tukey’s correction. d, Kruskal–Wallis test (left) and unpaired two-tailed Student’s t-test (right).
Extended Data Fig. 3 |
Extended Data Fig. 3 |. Bilirubin induced fusion requires close proximity and cytoskeletal signaling.
a) Brightfield images of bilirubin induced fusion in high density HLOs compared to low density and no bilirubin treatment. Scale bar indicates 200 μm. b) Comparison of mean segment length in high density HLOs compared to low density and no bilirubin treatment. (n = 9 independent experiments). c) Brightfield and live staining images (NucBlue: Blue, Cytoskeleton: White) show progression of organoid fusion after continued treatment with bilirubin (1 mg/L). Scale bar indicates 200 μm. (n = 3 independent experiments). d) Comparison of mean segment length of the HLOs from D1 to D7. (n = 9 independent experiments). e) NOTCH activity assay in bilirubin treated HLOs compared to control. (n = 9 independent experiments). f) Percentage of fused organoids after bilirubin treatment in DAPT (Notch inhibitor) and NSC (Ezrin Inhibitor, NSC668394) treated HLOs compared to control. (n = 9 independent experiments). g) Brightfield images of bilirubin induced fused HLOs compared to DAPT or NSC668394 treatment and control HLOs. Scale bar indicates 200 μm. (n = 3 independent experiments). h) CLF assay for self-assembled organoids compared to control. Scale indicates 200 μm. (n = 3 independent experiments). i) Percentage of fused organoids for each type of organoid. (n = 9 independent experiments). In e data is represented as boxplot where the middle line is the median, the lower and upper hinges correspond to the first and third quartiles, the upper and lower whisker extends from the hinge to the largest and smallest value respectively no further than 1.5 × IQR from the hinge (where IQR is the inter-quartile range). b,d, Kruskal-Wallis with multiple comparisons and Dunn-Holland-Wolfe correction. e, unpaired two-tailed Student’s t-test. i, one-way ANOVA with multiple comparisons and Tukey’s correction.
Extended Data Fig. 4 |
Extended Data Fig. 4 |. Immunostaining of mZ-HLOs compared to neonatal liver show similar features.
a) Brightfield images of fused HLOs following continued treatment with bilirubin compared to single dose treatment after 10 days. (n = 3 independent experiments). b) Immunofluorescence images (bottom) of mZ-HLOs depicting GFP, mCherry, PROX1 and A1AT. Scale bar indicates 200 μm. (n = 3 independent experiments). c) Immunofluorescence images of mZ-HLOs for pan liver markers: TUBA1A, CTNBB1, luminal marker: ZO-1 (depicting continuous lumen); Zone 1 markers: ARG1 and SLBP; Zone 2 marker TERT; Zone 3 markers: AHR, and MRP2; and Cholangiocyte marker CK7. Scale bar indicates 200 μm. Numbers on the bar indicate the percentage of fused organoids that express dual and single positivity for the indicated antigen staining. (n = 3 independent experiments). d) Immunohistochemistry images of neonatal liver sections for pan liver marker TUBA1A; Cholangiocyte marker CK7; Zone 1 markers: ARG1, SLBP, and GLS2; Zone 2 marker TERT; and Zone 3 markers: AHR, ALDH6A1 and MRP2. Scale bar indicates 200 μm. (P: Portal vein, C: Central vein). (n = 3 independent experiments).
Extended Data Fig. 5 |
Extended Data Fig. 5 |. Single cell profiling of mZ-HLOs indicate the emergence of zonal like populations.
a) UMAP plot with the major populations (hepatocytes, cholangiocytes, endothelial cells, macrophages, stellate cells, and mesenchyme) of all nuclei in mZ-HLOs. b) Distinct expression profile all populations in mZ-HLOs. The size of the circle indicates the percentage of nuclei in each population expressing each gene. The color represents the average expression level for the indicated gene. c) Heatmap showing scaled mean expression of all genes in each cluster. Top 10 marker genes in each cluster have been added as labels. d) Expression of known hepatoblast and zonal hepatocyte marker genes in each population. e) Violin plot for expression of AFP (hepatoblast gene), GSS (interzonal hepatocytes), GHR (pericentral hepatocyte), and GLS2 (periportal hepatocyte).
Extended Data Fig. 6 |
Extended Data Fig. 6 |. Pseudo-spatial profiling of mZ-HLOs show similarity of zonal expression to primary liver tissue.
a) Spatial plot for TAT (zone 1), HAMP (zone 2), and CYP3A4 (zone 3) markers in 10X Xenium healthy human liver dataset (publicly available dataset). b) UMAP plot of mZ-HLO with hepatocyte populations (top) and distribution of replicate data (bottom). c) Feature plot for TAT (zone 1), HAMP (zone 2), and CYP3A4 (zone 3) markers. d) UMAP plot for zonal hepatocyte populations from primary liver (Andrews et al.) and mZ-HLOs integrated together (top). UMAP plot depicting distribution for total hepatocyte populations from primary liver and mZ-HLOs integrated together (bottom). e) Expression of known hepatoblast and zonal hepatocyte marker genes in mZ-HLOs benchmarked against Andrews et al. snRNAseq dataset. f) UMAP plot for all cell types (inset: sample distribution) from primary liver datasets and mZ-HLOs integrated together. g) Feature plot for GLS2 (zone 1), HAMP (zone 2), and GLUL (zone 3) markers.
Extended Data Fig. 7 |
Extended Data Fig. 7 |. RNA velocity and pseudotime analysis in mZ-HLOs.
a) Phase portrait of AFP, GLUL, and GLS2 depicting the dynamics of the gene splicing in the nuclei with the velocity and expression of AFP, GLUL, and GLS2 in nuclei as feature plots. b) SOM (Self Organizing Map) of single-nuclei transcriptome-derived zonation profiles for mZ-HLOs based on the different populations. c) Boxplot showing the pseudotime of each nuclei population in mZ-HLOs. d) Pathway enrichment analysis examining which cellular pathways represented in the hepatoblast, pericentral, periportal, and interzonal hepatocyte populations. Circles (nodes) represent pathways, sized by the number of genes included in that pathway. Related pathways, indicated by light blue lines, are grouped into a theme (black circle) and labeled. Intra-pathway and inter-pathway relationships are shown in light blue and represent the number of genes shared between each pathway. In c data is represented as boxplot where the middle line is the median, the lower and upper hinges correspond to the first and third quartiles, the upper and lower whisker extends from the hinge to the largest and smallest value respectively no further than 1.5 × IQR from the hinge (where IQR is the inter-quartile range), while data beyond the end of the whiskers are outlying points that are plotted individually.
Extended Data Fig. 8 |
Extended Data Fig. 8 |. EP300 differentially regulates zonal genes in mZ-HLOs in conjunction to distinct transcription factors.
a) Peak density plots showing EP300 bound loci, a marker of active enhancers. Profile plot of all peaks are in the top panel. b) Genome browser view of HNF4A (pan marker) showing the EP300 ChIPseq peak. c) Genome browser view of CTNNB1 (pan marker) showing the EP300 ChIPseq peak. d) Genome browser view of SLBP (zone 1 gene) showing the EP300 ChIPseq peak. e) Genome browser view of AKR1C1 (zone 2 gene) showing the EP300 ChIPseq peak. f) Genome browser view of GHR (zone 3 gene) showing the EP300 ChIPseq peak. g) Top 10 upregulated Gene Ontology terms (Biological Process) for the gene regulated bound by EP300 in the Z1-HLOs. h) Top 10 upregulated Gene Ontology terms (Biological Process) for the gene regulated bound by EP300 in the Z3-HLOs.
Extended Data Fig. 9 |
Extended Data Fig. 9 |. EP300 and partner transcription factors are important for zonal liver development.
a) Experimental timeline for testing role of EP300 in zonal liver development using Ad-shp300 (adenoviral vector for p300 shRNA, top). H&E stain for sections from rat liver injected with Ad-shSCR (adenoviral vector for scrambled shRNA, middle) and Ad-shp300 (adenoviral vector for p300 shRNA, bottom). Scale bar indicates 200 μm. (P: Portal vein, C: Central vein). b) ICH stain for PROX1, ARG1, and GLUL of sections from rat liver injected with Ad-shSCR (adenoviral vector for scrambled shRNA, top) and Ad-shp300 (adenoviral vector for p300 shRNA, bottom). Scale bar indicates 200 μm. (P: Portal vein, C: Central vein). c) RT-qPCR of ALB, ACSS2, ASL, CPS1, and OTC (zone 1) gene for Z1- and Z3-HLOs compared to freshly isolated PHH, H20 (20 um periportal hepatocytes) and H40 (40 um pericentral hepatocytes) (Data is mean ± SD, n = 9 independent experiments). d) RT-qPCR of ALDH1A2, ALDH6A1, HIF1A, SREBF1, and GLUL (zone 3) gene for Z1- and Z3-HLOs compared to freshly isolated PHH, H20 (20 um periportal hepatocytes) and H40 (40 um pericentral hepatocytes) (Data is mean ± SD, n = 9 independent experiments). e) EP300-TF ChIP-reChIP-PCR for H20 (20 um periportal hepatocytes) and H40 (40 um pericentral hepatocytes). (n = 3 independent experiments). f) EP300-TF ChIP-reChIP-qPCR for samples in (e). Data are mean ± SD, n = 9 independent experiments. g) Schematic for bilirubin and ascorbate mediated distinct epigenetic regulation leading to differential gene expression. c, d, one-way ANOVA with multiple comparisons and Tukey’s correction. f, unpaired two-tailed Student’s t-test.
Extended Data Fig. 10 |
Extended Data Fig. 10 |. Interzonal dependent lipid and glucose metabolism in mZ-HLOs.
a) Triglyceride assay for mZ-HLOs with and without Firsocostat treatment compared to Z1-, Z3-, control HLOs, and PHH (n = 9 independent experiments). b) Lipase activity assay for mZ-HLOs with and without Firsocostat treatment compared to Z1-, Z3-, control HLOs, and PHH (n = 9 independent experiments). c) Glucose assay for mZ-HLOs with and without FBPi treatment compared to Z1-, Z3-, control HLOs, and PHH (n = 9 independent experiments). d) Glucokinase activity assay for mZ-HLOs with and without FBPi treatment compared to Z1-, Z3-, control HLOs, and PHH (n = 9 independent experiments). In a, c data are represented as boxplots where the middle line is the median, the lower and upper hinges correspond to the first and third quartiles, the upper and lower whisker extends from the hinge to the largest and smallest value respectively no further than 1.5 × IQR from the hinge (where IQR is the inter-quartile range). a,c, one-way ANOVA with multiple comparisons and Tukey’s correction.
Extended Data Fig. 11 |
Extended Data Fig. 11 |. mZ-HLOs exhibit zone specific regenerative potential in response to toxins.
a) Experimental timeline for testing zonal regenerative potential of mZ-HLOs in response to zone specific toxins. b) Immunofluorescence images of mZ-HLOs for proliferative marker Ki-67, GLUL, ARG1 and HAMP in response to Allyl Alcohol (Zone 1 toxin, left). Immunofluorescence images of mZ-HLOs for proliferative marker Ki-67, GLUL and ARG1 in response to Acetaminophen (Zone 3 toxin). Scale bar indicates 200 μm. c) Comparison of Ki-67 + nuclei in different fluorescent regions in response to zone specific toxins. (Data is mean ± SD, n = 9 independent experiments). d) Comparison of length of different fluorescent regions in response to zone specific toxins. (Data is mean ± SD, n = 9 independent experiments). e) Immunofluorescence images of CPS1, TET1, GLUL, NR3C1, and mCherry in Z1-HLOs with Dox treatment and after Dox withdrawal and persistent bilirubin treatment at D20 and 25. Scale bar indicates 200 μm. f) RT-qPCR of ACSS2, CPS1, ALDH1A2 and GLUL gene for Z3-HLOs with Dox (Dox +) and with bilirubin after Dox withdrawal (Dox − Bilirubin +) compared to control HLOs (Data is mean ± SD, n = 9 independent experiments). c, d, unpaired two-tailed Student’s t-test. f, one-way ANOVA with multiple comparisons and Tukey’s correction.
Extended Data Fig. 12 |
Extended Data Fig. 12 |. mZ-HLOs invade into the liver parenchyma of RRG rats after transplantation.
a) Immunofluorescence images for human TUBA1A of mZ-HLOs transplanted in RRG rat liver. Scale bar indicates 200 μm. (n = 3 independent experiments). b) Immunofluorescence images for human ASGR1 of mZ-HLOs transplanted in RRG rat liver. Scale bar indicates 200 μm. (n = 3 independent experiments). c) Immunofluorescence images for GFP, mCherry, human ARG1 and GLUL of mZ-HLOs transplanted in RRG rat liver. Scale bar indicates 200 μm. (n = 3 independent experiments). d) Immunofluorescence images for human ASGR1 of Z1 and Z3-HLOs transplanted in RRG rat liver through the portal vein and inferior vena cava. Scale bar indicates 200 μm. Numbers on the bar indicate the ratio of the area of integrated organoids and total area of the liver parenchyma in view in 103 pixel2 (Data is mean ± SD, n = 9 independent experiments).
Fig. 1 |
Fig. 1 |. Engineering hiPS cell-derived mZ-HLOs.
a, Schematic for development of mZ-HLOs from Dox-induced Z1-HLOs and low-dose bilirubin-treated Z3-HLOs. b, Top, brightfield images of progression of bilirubin-induced fusion from day 1 to day 7. Top inset, fluorescent images of progression of organoid fusion from day 1 to day 7. Numbers on the bar indicate the ratio of correctly fused organoids to the total number of organoids. Scale bars, 200 μm. c, Heat map of fused organoids compared to Z1-HLOs, Z3-HLOs and control HLOs, depicting expression of zonally expressed genes in the fused organoids. d, Immunofluorescence images of mZ-HLOs for pan-liver, zone 1 and zone 3 markers. Scale bars, 200 μm. Numbers on the bar indicate the percentage of fused organoids that exhibit expression of one or both of the indicated antigens. In c,d, n = 3 independent experiments for each condition.
Fig. 2 |
Fig. 2 |. Single-cell analysis of mZ-HLOs.
a, Uniform manifold approximation and projection (UMAP) plot with the major populations (hepatoblasts, interzonal-like hepatocytes, pericentral-like hepatocytes and periportal-like hepatocytes) of parenchymal nuclei in mZ-HLOs. Left, Velocyto force field showing the average differentiation trajectories (velocity) for nuclei located in different parts of the UMAP plot. Right, pseudotime trajectory graph showing the differentiation trajectory for nuclei in the UMAP plot. Colours represent the pseudotime development stage. b, Feature plots for pan-hepatocyte markers TTR and SERPINA1; cholangiocyte marker KRT7; zone 1 markers mCherry, GLS2, CPS1 and OTC; zone 2 markers GSS, TERT and AKR1C1; and zone 3 markers GFP, GLUL, CYP2E1 and HIF1A. c, UMAPs for human hepatocytes from hiPS cell-derived liver organoid cell atlas coloured by organoid source and cell type. UMAPs displaying the maximum (max.) Spearman correlation of fetal liver (left) and adult liver (right) dataset. HLBO, human liver bud organoid; HO, hepatic organoid; VHLO, vascularized human liver organoid. d, Expression of genes related to zone-specific functions in each population. The size of the circle indicates the percentage of nuclei in each population expressing each gene. The colour represents the average expression level for the indicated gene.
Fig. 3 |
Fig. 3 |. Bilirubin and ascorbate regulate EP300 differentially in a spatial manner to evoke zonation.
a, Genome browser view of ACSS2 (a zone 1 gene) showing the EP300 ChIP–seq peak. b, Genome browser view of HPR (a zone 2 gene) showing the EP300 ChIP–seq peak. c, Genome browser view of ALDH6A1 (a zone 3 gene) showing the EP300 ChIP–seq peak. d, Top 10 upregulated Gene Ontology terms (biological process) for the genes bound by EP300 in the mZ-HLOs. e, Motif enrichment analysis of EP300-bound peaks analysed by MEME-ChIP. f, Venn diagram depicting the intersection between EP300-bound peaks and upregulated genes obtained from RNA-seq in Z1-HLOs and Z3-HLOs linked to motif enrichment analysis of EP300-bound peaks for upregulated genes in Dox-treated Z1-HLOs and in bilirubin-treated Z3-HLOs analysed by MEME-ChIP. g, Left, quantitative PCR with reverse transcription (RT–qPCR) of ACSS2 and CPS1 for Z1-HLOs and mZ-HLOs with and without treatment with Bobcat339 (a TET inhibitor). Right, RT–qPCR of ALDH6A1 and GLUL for Z3-HLOs and mZ-HLOs with and without treatment with KC7F2 (a HIF1A inhibitor). Data are mean ± s.d.; n = 9 independent experiments.
Fig. 4 |
Fig. 4 |. Interzonal-dependent nitrogen handling in mZ-HLOs.
a, RT–qPCR of OTC and CPS1 (zone 1 genes) for mZ-HLOs, Z1-HLOs, Z3-HLOs, control HLOs and PHH in response to 10 mM NH4Cl. b, RT–qPCR of ARG1 (zone 1 and 2 gene) and GSTA2 (zone 2 gene) for mZ-HLOs, Z1-HLOs, Z3-HLOs, control HLOs and PHH in response to 10 mM NH4Cl. c, RT–qPCR of ALDH1A2 and GLUL (zone 3 genes) for mZ-HLOs, Z1-HLOs, Z3-HLOs, control HLOs and PHH in response to 10 mM NH4Cl. d, Glutathione assay for mZ-HLOs with and without BSO treatment, compared with Z1-HLOs, Z3-HLOs, control HLOs and PHH. CTG, CellTiter-Glo. e, Ammonia assay for mZ-HLOs with and without BSO treatment, compared to Z1-HLOs, Z3-HLOs, control HLOs and PHH. f, Urea assay for mZ-HLOs with and without BSO treatment, compared to Z1-HLOs, Z3-HLOs, control HLOs and PHH. g, GST assay for mZ-HLOs with and without BSO treatment, compared to Z1-HLOs, Z3-HLOs, control HLOs and PHH. h, Glutamine synthetase activity assay for mZ-HLOs with and without BSO treatment, compared to Z1-HLOs, Z3-HLOs, control HLOs and PHH. i, Glutamine assay for mZ-HLOs with and without BSO treatment, compared to Z1-HLOs, Z3-HLOs, control HLOs and PHH. In ac, data are mean ± s.d.; n = 9 independent experiments. In d,f,i, n = 9 independent experiments; in box plots, the middle line is the median, the bottom and top hinges correspond to the first and third quartiles, and the top and bottom whiskers extend from the hinge to the largest and smallest value, respectively, no further than 1.5 times the interquartile range from the hinge. In g,h, data are mean ± s.e.m.; n = 9 independent experiments. One-way ANOVA with multiple comparisons and Tukey’s correction (af,i).
Fig. 5 |
Fig. 5 |. Orthotopic transplantation of mZ-HLOs improves multiple hepatocyte functions.
a, Schematic of orthotopic transplantation of HLOs in bile duct ligated immunocompromised RRG rats. b, Kaplan–Meier survival curve for Z1-HLO, Z3-HLO and mZ-HLO-transplanted bile duct ligated RRG rats compared to sham. n = 9 independent experiments. log-rank test. Tx, treatment group. c, Human albumin ELISA on blood serum collected from rats at different time points after transplantation. Data are mean ± s.e.m.; n = 9 independent experiments. d, Bilirubin assay on blood serum collected from rats at different time points after transplantation. Data are mean ± s.e.m.; n = 9 independent experiments. e, Ammonia assay on blood serum collected from rats at different time points after transplantation. Data are mean ± s.e.m.; n = 9 independent experiments.

Update of

References

    1. Ben-Moshe S & Itzkovitz S Spatial heterogeneity in the mammalian liver. Nat. Rev. Gastroenterol. Hepatol. 16, 395–410 (2019). - PubMed
    1. Kang J et al. Simultaneous deletion of the methylcytosine oxidases Tet1 and Tet3 increases transcriptome variability in early embryogenesis. Proc. Natl Acad. Sci. USA 112, E4236–E4245 (2015). - PMC - PubMed
    1. Kim SG et al. Bilirubin activates transcription of HIF-1α in human proximal tubular cells cultured in the physiologic oxygen content. J. Kor. Med. Sci. 29, S146–S154 (2014). - PMC - PubMed
    1. Martini T, Naef F & Tchorz JS Spatiotemporal metabolic liver zonation and consequences on pathophysiology. Annu. Rev. Pathol. Mech. Dis. 18, 439–466 (2023). - PubMed
    1. Bartl M et al. Optimality in the zonation of ammonia detoxification in rodent liver. Arch. Toxicol. 89, 2069–2078 (2015). - PubMed

MeSH terms

LinkOut - more resources