. 2025 May;641(8063):779-787.
doi: 10.1038/s41586-025-08835-0. Epub 2025 Apr 16.

Histone H1 deamidation facilitates chromatin relaxation for DNA repair

Affiliations

Histone H1 deamidation facilitates chromatin relaxation for DNA repair

Yuan Tian et al. Nature. 2025 May.

Abstract

The formation of accessible chromatin around DNA double-strand breaks is essential for their efficient repair1. Although the linker histone H1 is known to facilitate higher-order chromatin compaction2,3, the mechanisms by which H1 modifications regulate chromatin relaxation in response to DNA damage are unclear. Here we show that CTP synthase 1 (CTPS1)-catalysed deamidation of H1 asparagine residues 76 and 77 triggers the sequential acetylation of lysine 75 following DNA damage, and this dual modification of H1 is associated with chromatin opening. Mechanistically, the histone acetyltransferase p300 showed a preference for deamidated H1 as a substrate, establishing H1 deamidation as a prerequisite for subsequent acetylation. Moreover, high expression of CTPS1 was associated with resistance to cancer radiotherapy, in both mouse xenograft models and clinical cohorts. These findings provide new insights into how linker histones regulate dynamic chromatin alterations in the DNA damage response.


Conflict of interest statement

Competing interests: The authors declare no competing interests.

Figures

Fig. 1
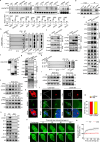
Fig. 1. H1(N76D/N77D) is required for DNA damage repair.
a, HeLa cells were exposed to 10 Gy IR and released for 2 min. Histones were analysed by immunoblotting after 2DGE (left) or regular SDS–PAGE (middle). The relative quantification of H1.4 forms (wild type (WT) and PTM) in the representative experiment (under the blot) and three independent experiments (right) is shown. Ctrl, control. b, HeLa cells were exposed to the indicated doses of IR and released for 2 min. Histones were analysed by immunoblotting after 2DGE (left) or SDS–PAGE (middle). The relative quantification of H1.4 forms is also shown (right). c, HeLa cells were micro-irradiated and analysed by immunofluorescence for γH2AX (green) and H1(N76D/N77D) (red). Scale bars, 5 μm. d, U2OS-AsiSI-ER-AID cells were treated with or without 4OHT and subjected to CUT&Tag-seq with anti-H1(N76D/N77D). e, Circle plot represents P values obtained when CUT&Tag-seq signals for HR and NHEJ DSBs were compared using an increasing window size. NS, not significant. f, U2OS-AsiSI-ER-AID cells were treated with or without 4OHT and subjected to a ChIP–re-ChIP assay with the indicated antibodies. g,h, Wild-type or H1.4-knockout (KO) HeLa cells stably expressing wild-type or mutant Flag–H1.4 were analysed by a comet assay at the indicated times post-IR (g) or post-VP16 (h). Statistical analyses of the tail moment at the indicated time points are shown. Vec, vector. i,j, Wild-type or H1.4-KO HeLa cells stably expressing wild-type or mutant Flag–H1.4 were analysed by immunofluorescence for RAD51 (i) or 53BP1 (j) foci at the indicated times post-IR. Statistical analyses of foci numbers at the indicated time points are shown. Data represent the mean ± s.d. P values were calculated using Student’s unpaired two-tailed t-tests (a,fj) or two-sample Wilcoxon test (e). n = 3 samples (a,f), n = 20 or 30 DSBs (e) and n = 50 cells (gj) from 3 independent experiments. Source data
Fig. 2
Fig. 2. CTPS1 deamidates H1 N76/N77 in response to DNA damage.
a, Wild-type or CTPS1-KO HeLa cells stably expressing wild-type or enzymatically dead (ED) Flag–CTPS1 were treated with or without 10 Gy IR. Histones and whole-cell lysates (WCLs) were analysed by immunoblotting. b, GST–H1.4 purified from Escherichia coli was incubated with or without Flag–CTPS1 purified from HEK293T cells. In vitro deamidation reactions were analysed by immunoblotting after 2DGE (left) and SDS–PAGE (right). c,d, Representative cells (c) and quantification (d) of GFP signals in HeLa and HCT116 cells that were transfected with GFP–CTPS1 and exposed to laser micro-irradiation. Scale bars, 5 μm. e, U2OS-AsiSI-ER-AID cells were treated with or without 4OHT and subjected to CUT&Tag-seq with anti-CTPS1. f, Wild-type or CTPS1-KO HeLa cells stably expressing wild-type CTPS1 or CTPS1-ED were analysed by a comet assay at the indicated times after IR. Statistical analyses of the tail moment at 4 h post-IR are shown. g, H1.4-KO HeLa cells stably expressing wild-type or mutant Flag–H1.4 were modified to express FKBP–CTPS1, treated with dTAGV-1 for 3 h, and then exposed to IR. Cells were analysed by a comet assay at the indicated times after IR. Statistical analyses of the tail moment at 4 h post-IR are shown. Data represent the mean ± s.d. P values were calculated using Student’s unpaired two-tailed t-tests (f,g). n = 8 (d) or n = 50 (f,g) cells from 3 independent experiments. Source data
Fig. 3
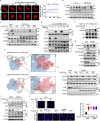
Fig. 3. H1(N76D/N77D) is a prerequisite for H1K75ac.
a, Chromatin fractions were extracted from wild-type or H1.4-KO HeLa cells stably expressing wild-type or mutant Flag–H1.4 and analysed by an MNase-sensitivity assay (top). WCLs were analysed by immunoblotting (bottom). b, HeLa cells were exposed to the indicated doses of IR and released for 2 min (top) or exposed to 10 Gy IR and released for the indicated times (bottom). Histones were extracted for immunoblotting using anti-H1K75ac or anti-H1K75ac2ND antibodies. c, H1.4-KO HeLa cells stably expressing wild-type or mutant Flag–H1.4 were exposed to IR. WCLs were extracted, immunoprecipitated using anti-Flag and analysed by immunoblotting. d,e, Wild-type or CTPS1-KO HeLa cells were analysed by immunofluorescence for H1 PTM (red) and γH2AX (green) at 5 min post-micro-irradiation. Representative images (d) and quantification (e) of 30 cells are shown. Scale bars, 5 μm. f,g, Wild-type or H1.4-KO HeLa cells stably expressing wild-type or mutant Flag–H1.4 were analysed by a comet assay at the indicated times post-IR (f) or post-VP16 (g). Statistical analyses of the tail moment at the indicated time points post-treatment are shown. h,i, Wild-type or H1.4-knockout HeLa cells stably expressing wild-type or mutant Flag–H1.4 were analysed by immunofluorescence for RAD51 (h) or 53BP1 (i) foci at the indicated times post-IR. Statistical analyses of foci numbers at the indicated time points post-IR are shown. Data represent the mean ± s.d. P values were calculated using Student’s unpaired two-tailed t-tests (ei). n = 30 (e) and n = 50 (fi) cells from 3 independent experiments. Source data
Fig. 4
Fig. 4. H1(N76D/N77D) promotes p300 binding to chromatin and H1K75ac.
a, HeLa cells were transfected with the indicated siRNAs, followed by plasmid transfection for 48 h, and exposed or not to 10 Gy IR. Histones and WCLs were analysed by immunoblotting. b, HeLa cells were transfected with Flag–H1.4 for 48 h and exposed or not to 10 Gy IR. WCLs were extracted, immunoprecipitated using anti-Flag and analysed by immunoblotting. c, Recombinant GST or GST–p300 fragments (top) were incubated with His–H1.4 for GST pull-down assays (bottom). Coomassie brilliant blue (CBB) staining is shown. The asterisks indicate specific protein bands. FL, full-length. d, GST or GST–p300 HAT was subjected to in vitro acetylation assays using free histones extracted from HeLa cells. eg, H1.4-KO HeLa cells stably expressing wild-type or mutant Flag–H1.4 were modified to express FKBP–CTPS1, treated with dTAGV-1 for 3 h, and exposed or not to 10 Gy IR. Chromatin was analysed by immunoblotting (e), or proximity ligation assay was performed using anti-H1.4 and anti-p300, with representative images (f) and quantification of 50 cells (g) shown. Scale bars, 5 μm. h, Recombinant GST–p300 HAT protein was incubated with His–H1.4, His–H1.4-2ND, His–H1.4-2NA or His–H1.4-2NR for the GST pull-down assay (top). CBB staining is also shown (bottom). The asterisks indicate specific protein bands. Exp., exposure. Data represent the mean ± s.d. P values were calculated using Student’s unpaired two-tailed t-tests (g). n = 50 cells from 3 independent experiments (g). Source data
Fig. 5
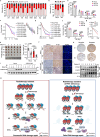
Fig. 5. Sequential H1(N76D/N77D) and H1K75ac promote chromatin relaxation and maintain genome stability.
a, Chromatin fractions or WCLs were extracted from H1.4-KO HeLa cells that were transfected with the indicated plasmids, and analysed by an MNase assay (top) or immunoblotting (middle), and the intensity of each lane was quantified (bottom). b, H1.4-KO U2OS-AsiSI-ER-AID cells were transfected with wild-type H1.4 or H1.4-RAA plasmids and treated with or without 4OHT. Cells were subjected to ATAC-seq. Normalized signals of 80 sensitive DSB sites were plotted. c, U2OS-AsiSI-ER-AID cells were treated with or without 4OHT and subjected to ATAC-seq or CUT&Tag-seq with the indicated antibodies. Normalized signals of a representative DSB site is shown. d, H1.4-KO HeLa cells expressing wild-type or mutant Flag–H1.4 were modified to express FKBP–CTPS1, and treated with or without VP16 after being treated with or without dTAGV-1 for 3 h. Chromatin fractions or WCLs were analysed by an MNase assay (top) or immunoblotting (middle). The intensity of each lane was also quantified (bottom). e, The affinity between purified His–H1.4 or His–H1.4-KQ proteins and synthesized DNAs was analysed by an MST assay. f, Wild-type or CTPS1-KO HeLa cells were injected into nude mice, with or without (Ctrl) exposure to IR (n = 6 per group). Growth curves of xenografts are shown. g, Quantification of CTPS1 expression in cervical cancer tissues (n = 58). Blue indicates sensitive patients who survived 5 years after radiotherapy, and red denotes resistant patients who had died within 5 years of radiotherapy. h, Overall survival of patients with survival information in g (n = 48). Blue indicates low CTPS1expression, red denotes high CTPS1 expression. i, Correlation of CTPS1 and H1(N76D/N77D) expression in cervical tumour and para-tumour tissues (n = 57). Data represent the mean ± s.d. (f,g). P values were calculated using Student’s unpaired two-tailed t-tests (f,g), log-rank (Mantel–Cox) test (h) or Pearson r test (i). Source data
Extended Data Fig. 1
Extended Data Fig. 1. DNA damage induces Deamidation of H1.
a, HeLa cells were exposed to 10 Gy IR and released for 2 min. Histones were extracted for 2DGE. b, HeLa cells were transfected with the indicated siRNAs for 48 h and treated with or without VP16. Cell lysates were extracted using 1 M NaCl and analyzed by immunoblotting and CBB (top). WCLs were extracted and analyzed by immunoblotting (bottom). c, WCLs of WT or H1.4-KO HeLa cells were extracted and analyzed by immunoblotting. d, WT or H1.4-KO HeLa cells were treated with or without VP16. Chromatin fractions were extracted and analyzed by MNase sensitivity assay. e, WT or H1.4-KO HeLa cells were treated with or without VP16. Cell lysates were extracted using 1 M NaCl and analyzed by immunoblotting (top) and CBB (bottom). f, HeLa cells were exposed to 10 Gy IR and released for the indicated times. Histones were extracted for immunoblotting after 2DGE (left) or SDS-PAGE (middle). The relative quantification of H1.4 forms (WT and PTM) in the representative experiment is shown (right). g, HeLa cells were exposed to 20 μM VP16 for 2 h. Histones were extracted for 2DGE. h, HeLa cells were exposed to the indicated doses of VP16 for 2 h. Histones were extracted for immunoblotting after 2DGE (left) or regular SDS-PAGE (right). i,j, HeLa cells were exposed to 10 Gy IR or not (Ctrl) and released for 2 min. Histones were extracted and deamidated peptides were identified by mass spectrometry (MS). Ratio (i) and relative quantification (j) of deamidated peptides are shown. k, The identification of N76 and N77 deamidated peptides by MS is shown. The product ions y3 (377.18) and y4 (492.20) indicated the deamidation of the asparagine at the 3rd and 4th position from the C terminus of the peptide. l, H1.4- KO HeLa cells transfected with the indicated FLAG-tagged plasmids (WT or 2NA) for 48 h were exposed to 10 Gy IR or not (Ctrl). Histones were extracted for immunoblotting after 2DGE (left) or regular SDS-PAGE (right). Three independent experiments were performed in (a-j, l). Source data
Extended Data Fig. 2
Extended Data Fig. 2. Deamidation of H1 N76/77 is increased after DNA damage.
a, Dot blot analysis of the indicated amounts of peptides using a purified H1N76/77D antibody diluted 1:1,000. The sensitivity of the purified anti-H1N76/77D antibody was <1 ng. Dot blot using indicated peptides showing that anti-H1N76/77D only recognized 2ND peptides, not WT peptides. b, ELISA confirmation that the specificity of the purified anti-H1N76/77D antibody against the immunogens was 27-fold higher than of unmodified (WT) peptide. c, WCLs of H1.4-KO HeLa cells with stable expression of WT or mutant FLAG-H1.4 were extracted, immunoprecipitated using anti-FLAG, and analyzed by immunoblotting. The H1N76/77D antibody specifically recognized double-deamidated H1 and did not interact with single-deamidated H1.4. d, H1.4-KO HeLa cells with stable expression of H1.4-WT or vector control were treated with 10 Gy IR. WCLs were extracted, immunoprecipitated using anti-FLAG, and analyzed by immunoblotting. The H1N76/77D antibody specifically recognized double-deamidated H1 and did not interact with FLAG-Vector immunoprecipitants. e, WT or quadruple H1 variant-knockout (H1.1-H1.4 KO; 4KO) HeLa cells were micro-irradiated and analyzed by immunofluorescence at 5 min post-irradiation. Scale bars, 5 μm. f, WT or 4KO HeLa cells were exposed to 10 Gy IR and released for 5 min. Histones were extracted for immunoblotting. g, HeLa cells were exposed to the indicated doses of IR and released for 2 min (top), or exposed to 10 Gy IR and released for the indicated times (bottom). Histones were extracted for immunoblotting. h, HeLa cells were exposed to the indicated doses of VP16 for 2 h (top) or exposed to 20 μM VP16 for 2 h and released for indicated times (bottom). Histones were extracted for immunoblotting. i, U2OS-AsiSI-ER-AID cells were treated with or without 4OHT (500 nM) for 4 h and subjected to chromatin immunoprecipitation (ChIP) with anti-IgG or anti-H1N76/77D followed by real-time PCR analysis. j, HeLa cells were exposed to ultraviolet radiation C (UVC, 20 J/cm2), then released for the indicated times. Histones were extracted for immunoblotting. k, HeLa cells were exposed to 8 mM hydroxyurea (Hu) for 3 h, 0.2 mM palmitic acid (PA) for 24 h, or 0.1 μg/mL TNF-α for 5 h. Histones and WCLs were extracted for immunoblotting. Data represent the means ± s.d. n = 3 samples (i) from three independent experiments. P values were calculated using Student unpaired two-tailed t-tests (i). Three independent experiments were performed (a-k). Source data
Extended Data Fig. 3
Extended Data Fig. 3. CTPS1 deamidates H1 N76/77 in response to DNA damage.
a, HeLa cells were transfected with control siRNA (siCtrl) or siRNA targeting individual GATs for 48 h and then exposed or not to 10 Gy IR. Histones were extracted for immunoblotting (top). RNA from cells without IR was extracted for real-time PCR to validate the knockdown efficiency (bottom). b, HeLa cells expressing FKBP-CTPS1 were treated with dTAGV-1 (1 mM) for 3 h and then exposed to 10 Gy IR. WCLs or histones were extracted for immunoblotting after 2DGE (left) or regular SDS-PAGE (right). c,d, HeLa cells were transfected with FLAG-CTPS1 (c left) or FLAG-H1.4 (c right) with or without 10 Gy IR (c) or all exposed to 10 Gy IR (d). WCLs were immunoprecipitated using anti-FLAG (c) or anti-IgG, anti-H1.4, or anti-CTPS1 (d) and analyzed by immunoblotting. e, HeLa cells were transfected with FLAG-CTPS1 for 48 h and exposed or not to 10 Gy IR. WCLs were extracted, immunoprecipitated with anti-FLAG, and analyzed by immunoblotting. The relative quantifications of the binding intensities are indicated below each band. f, GST or GST-H1.4 recombinant proteins were incubated with HIS-CTPS1 for GST pull-down assays; *indicates specific protein bands. g, Histone octamer and GST-H1.4 recombinant proteins were mixed and incubated with HIS-CTPS1 for pull-down assay using HIS beads (top). CBB staining shows the input (bottom). h, HIS-H1.4-WT purified from E. coli was incubated with or without FLAG-CTPS1-WT or FLAG-CTPS1-ED purified from HEK293T cells. Immunoblots of in vitro deamidation reactions analyzed after 2DGE (left) and regular SDS-PAGE (right) are shown. i, HeLa cells were exposed to the indicated doses of IR and released for 2 min (left), or exposed to 10 Gy IR and released for indicated times (right). Chromatin was extracted for immunoblotting. j, HeLa cells were exposed to 20 μM VP16 for 2 h and released for the indicated times (top) or to the indicated doses of VP16 for 2 h (bottom). Chromatin was extracted for immunoblotting. k, HeLa cells were micro-irradiated, fixed at 5 min post-irradiation, and analyzed by immunofluorescence using anti-CTPS1 (red) and anti-γH2AX (green). l,m, U2OS-265 reporter cells were transfected with GFP-CTPS1 plasmid (left) or GFP vector (right) for 48 h and treated with 4OHT (500 nM) and shield Ι (30 ng/mL) for 6 h. Co-localization of FokI-mCherry (red) and GFP-CTPS1 (green) was analyzed by immunofluorescence (l). Quantifications of 40 cells from three independent experiments are shown (m). n, WT or 4KO HeLa cells were exposed to 10 Gy IR and released for 5 min. Chromatin fractions were extracted for immunoblotting. o,p, WT or 4KO HeLa cells were transfected with GFP-CTPS1 for 48 h, then micro-irradiated. Images were captured every 10 s for 5 min. Representative images (o) and quantification of 30 cells from three independent experiments (p) are shown. Data represent the means ± s.d. (a, p) and values (m). n = 3 samples (a), n = 40 cells (m) or n = 30 cells (p) from three independent experiments. P values were calculated using Student unpaired two-tailed t-tests (a). Scale bars, 5 μm (k,l,o). Three independent experiments were performed in (a-k,m,n). Source data
Extended Data Fig. 4
Extended Data Fig. 4. CTPS1 deamidated-H1 N76/77 is required for DNA damage repair.
a, WT or CTPS1-KO HeLa cell lines stably expressing WT or mutant CTPS1 were exposed to VP16 and analyzed by comet assay at the indicated times post-treatment. Statistical analyses of the tail moment at 6 h post treatment are shown. b, pDR-GFP (top) or pEJ5-GFP (bottom) U2OS cells were transfected with the indicated siRNAs and then plasmids, and then infected with a retrovirus expressing I-SceI, before flow cytometric analysis of GFP expression. c,d, WT or CTPS1-KO HeLa cell lines stably expressing WT or mutant CTPS1 were exposed to 10 Gy IR and analyzed by immunofluorescence at the indicated times post-treatment. Statistical analyses of RAD51 (c) and 53BP1 (d) foci numbers at indicated time points post-IR are shown. e, WT or CTPS1-KO HeLa cell lines were treated with or without 200 μM CTP for 2 h. Cells were collected and analyzed by mass spectrometry to determine CTP levels. f,g, WT or CTPS1-KO HeLa cell lines were treated with or without 200 μM CTP for 2 h and exposed to 10 Gy IR and analyzed by comet assays (f) or immunofluorescence to detect 53BP1 foci (g) post-IR. Statistical analyses of the tail moment at 4 h (f) or foci numbers at the 1 h (g) post-IR are shown. h, H1.4-KO HeLa cells stably expressing WT or mutant FLAG-H1.4 were modified to express FKBP-CTPS1, and treated with dTAGV-1 for 3 h. WCLs were extracted and analyzed by immunoblotting. i, pDR-GFP (left) or pEJ5-GFP (right) U2OS cells were transfected with the indicated siRNAs, then with plasmids, and flow cytometric analysis of GFP expression was performed. j,k, H1.4-KO HeLa cells stably expressing WT or mutant FLAG-H1.4 were modified to express FKBP-CTPS1, treated with dTAGV-1 for 3 h, and exposed to 10 Gy IR. Cells were fixed and analyzed by immunofluorescence at the indicated times post-treatment. Statistical analyses of RAD51 (j) and 53BP1 (k) foci numbers at 2 h or 1 h post-treatment are shown. Data represent the means ± s.d. (a-g, i-k). n = 3 samples (b, e, i) or n = 50 cells (a,c,d,f,g,j,k) each group from three independent experiments. P values were calculated using Student unpaired two-tailed t-tests (a-g, i-k). Three independent experiments were performed (a-g). Source data
Extended Data Fig. 5
Extended Data Fig. 5. DNA damage induces H1K75 acetylation.
a, WT or H1.4-KO HeLa cells with stable expression of FLAG-tagged WT or mutant H1.4 were treated with or without VP16. Cell lysates were extracted using 1 M NaCl and analyzed by immunoblotting (top) and CBB (middle). WCLs were analyzed by immunoblotting (bottom). b, HeLa cells were exposed to 10 Gy IR, released for 2 min, and histones were extracted. K75 acetylated and N76/N77 deamidated peptides were simultaneously identified by MS. c, Dot blot analysis of the indicated amounts of peptides using purified anti-H1K75ac (left) or anti-H1K75ac2ND (right) antibody diluted 1:1,000. The sensitivities of the purified antibodies were <1 ng. d, ELISA confirmation that the specificity of the purified H1K75ac (left) and H1K75ac2ND (right) antibodies against the immunogens was >4-fold higher than that of unmodified peptides. e, WT or 4KO HeLa cells were micro-irradiated and analyzed by immunofluorescence at 5 min post-irradiation. f, WT or 4KO HeLa cells were exposed or not to 10 Gy IR and released for 5 min. Histones were extracted for immunoblotting. g, HeLa cells were exposed to the indicated doses of VP16 for 2 h (top) or to 20 μM VP16 for 2 h and released for the indicated times (bottom). Histones were extracted for immunoblotting. h, HeLa cells were analyzed for γH2AX (green) and H1 PTM (red) by immunofluorescence at 5 min post-micro-irradiation. i, U2OS-AsiSI-ER-AID cells were treated with or without 4OHT and subjected to CUT&Tag-seq with anti-H1K75ac or anti-H1K75ac2ND. j, U2OS-AsiSI-ER-AID cells were treated with or without 4OHT and subjected to ChIP-re-ChIP with indicated antibodies. Data represent the means ± s.d. (j). n = 3 samples from three independent experiments (j). P values were calculated using Student unpaired two-tailed t-tests (j). Three independent experiments were performed in (a, c-j). Scale bars, 5 μm (e, h). Source data
Extended Data Fig. 6
Extended Data Fig. 6. H1K75 acetylation does not influence H1N76/77 deamidation.
a, H1.4-KO HeLa cells transfected with the indicated plasmids for 48 h and then exposed to 10 Gy IR. Histones were extracted for immunoblotting after 2DGE (left) or regular SDS-PAGE (right). b, H1.4-KO HeLa cells were transfected with H1.4-WT, -2ND, or -2NR plasmids for 48 h and exposed to 10 Gy IR. WCLs were extracted, immunoprecipitated using anti-FLAG, and analyzed by immunoblotting. c, WT or CTPS1-KO HeLa cells were exposed to 10 Gy IR. Histones or WCLs were extracted and analyzed by immunoblotting. Three independent experiments were performed in (a-c).
Extended Data Fig. 7
Extended Data Fig. 7. p300 acetylates H1K75 in response to DNA damage.
a, HeLa cells were transfected with the indicated siRNAs for 48 h, and exposed or not to 10 Gy IR. Histones and WCLs were extracted and analyzed by immunoblotting. b, HeLa cells were exposed to 10 Gy IR. WCLs were extracted; immunoprecipitated using anti-IgG, anti-H1.4, or anti-p300; and analyzed by immunoblotting. c, Recombinant GST or GST-p300-HAT proteins were incubated with HIS-H1.4 for GST pull-down assays; *indicates specific protein bands identified by CBB staining. d, p300-HAT protein was incubated with or without HIS-H1.4-2ND for 1 h and subjected to native PAGE. Bovine serum albumin (BSA) was loaded as a molecular weight reference. e, U2OS-265 reporter cells were transfected with GFP-p300-HAT plasmid for 48 h, and treated with 4OHT (500 nM) and shield Ι (30 ng/ml) for 6 h. The co-localization of FokI-mCherry (red) and GFP-p300-HAT (green) was analyzed by immunofluorescence. Scale bars, 5 μm. f, GST or GST-p300-HAT was subjected to in vitro acetylation assay using HIS-H1.4-K75R protein purified from E. coli as substrate. g, H1.4-KO HeLa cells stably expressing WT or mutant H1.4 were transfected with the indicated siRNAs, exposed to 10 Gy IR, and analyzed by comet assay at the indicated times post-IR. (h) pDR-GFP (top) or pEJ5-GFP (bottom) U2OS cells were transfected with the indicated siRNAs, followed by plasmids, and flow cytometric analysis of GFP expression was performed. i,j, H1.4-KO HeLa cells stably expressing WT or mutant H1.4 were transfected with the indicated siRNAs, exposed to 10 Gy IR, and analyzed by immunofluorescence at the indicated times post-IR. Quantifications of RAD51 (i) and 53BP1 (j) foci numbers per cell from 50 cells are shown. Data represent the means ± s.d. (g-j). n = 3 samples (h) and n = 50 cells (g, i,j) in each group from three independent experiments (g-j). P values were calculated using Student unpaired two-tailed t-tests (g-j). Three independent experiments were performed in (a-j). Source data
Extended Data Fig. 8
Extended Data Fig. 8. H1N76/77 deamidation promotes p300 binding to chromatin and H1K75 acetylation.
a, WT or CTPS1-KO HeLa cells were transfected with an mCherry-p300-HAT plasmid and exposed to laser micro-irradiation. Images were captured every 10 sec for 5 min (left), and the irradiated path signal intensity in cells was calculated (right). b, WT or CTPS1-KO HeLa cells were exposed to 10 Gy IR and released for the indicated times. Chromatin was extracted and analyzed by immunoblotting. c, WT or CTPS1-KO HeLa cells were transfected with the indicated plasmids and exposed or not to 10 Gy IR. Chromatin was extracted and analyzed by immunoblotting. d, H1.4-KO HeLa cells stably expressing WT or mutant FLAG-H1.4 were modified to express FKBP-CTPS1, treated with dTAGV-1 for 3 h, and exposed to 10 Gy IR, WCLs were extracted, immunoprecipitated using anti-H1.4, and analyzed by immunoblotting. e, Recombinant GST-p300-HAT protein was subjected to in vitro acetylation assay using HIS-H1.4-WT or HIS-H1.4-2ND proteins purified from E. coli as substrates. f, Molecular-docking-predicted 3D structural image of interaction between p300 and H1.4 by GRAMM (gramm.compbio.ku.edu) in H.14-WT (top) and H1.4-2ND (bottom) contexts. Locations of the main interacting amino acids are shown, and residues 75, 76, and 77 are marked. Blue, p300-HAT domain; red, H1.4 globular domain; light red, H1.4 C and N terminals. g, HeLa cells were transfected with indicated siRNAs for 48 h and exposed to 10 Gy IR. Extracted histones or WCLs were analyzed by immunoblotting. h, H1.4-KO HeLa cells were transfected with the indicated siRNAs and then plasmids for 48 h, and exposed to 10 Gy IR. Chromatin and WCLs were extracted and analyzed by immunoblotting. i, H1.4-KO HeLa cells were transfected with siRNA and the indicated plasmids for 48 h and exposed to 10 Gy IR. WCLs were extracted, immunoprecipitated using anti-FLAG, and analyzed by immunoblotting. j, H1.4-KO HeLa cells were transfected with the indicated siRNA and plasmids for 48 h, and exposed to 10 Gy IR. PLAs were performed using anti-FLAG or/and anti-CTPS1. Representative images (left) and quantification of 50 cells each group (right) are shown. Data represent the means ± s.d. (a, j). n = 8 (a) or n = 50 (j) cells in each group from three independent experiments. P values were calculated using Student unpaired two-tailed t-tests (j). Three independent experiments were performed in (a-e, g-i). Scale bars, 5 μm (a, j). Source data
Extended Data Fig. 9
Extended Data Fig. 9. Sequential H1N76/77 deamidation and H1K75 acetylation promotes chromatin relaxation and maintains genome stability.
a, H1.4-KO HeLa cells were transfected with the indicated plasmids for 48 h and treated with or without VP16. Chromatin fractions were extracted and analyzed by MNase sensitivity assay (top). WCLs were extracted and analyzed by immunoblotting (middle). The intensity of each lane was quantified (bottom). b, H1.4-KO HeLa cells stably expressing FLAG-tagged WT or mutant H1.4 were treated with or without VP16. Cell lysates were extracted using 1 M NaCl and analyzed by immunoblotting (top) and CBB (middle). WCLs were extracted and analyzed by immunoblotting (bottom). c, HeLa cells were transfected with the indicated siRNAs and plasmids for 48 h and treated or not with VP16. Cell lysates were extracted using the indicated dose of NaCl buffer and analyzed by immunoblotting (top) and CBB (middle). WCLs were extracted and analyzed by immunoblotting (bottom). d, H1.4-KO HeLa cells were transfected with the indicated siRNAs and plasmids for 48 h and treated with or without VP16. Cell lysates were extracted using 1 M NaCl and analyzed by immunoblotting (top) and CBB (middle). WCLs were extracted and analyzed by immunoblotting (bottom). e, U2OS-AsiSI-ER-AID cells were transfected with the indicated siRNAs for 48 h and then treated with or without 4OHT. Cells were collected and subjected to ATAC-seq, and 80 sensitive DSB sites were plotted. f,g, H1.4-KO HeLa cells were transfected with siRNA control (siCtrl) or sip300, then plasmids for 48 h, and treated with or without VP16. Chromatin fractions were extracted and analyzed by MNase sensitivity assay (f top). WCLs were extracted and analyzed by immunoblotting (f bottom). The intensity of each lane was quantified (g). Three independent experiments were performed in (a-f). Source data
Extended Data Fig. 10
Extended Data Fig. 10. CTPS1 is a potential therapeutic target for cancer.
a, H1.4-KO HeLa cells with stable expression of H1.4 WT or mutants were exposed or not to 3 Gy IR and subjected to metaphase assay. Chromosomes were counterstained with Giemsa and the aberrations were quantified. b, WT or CTPS1-KO HeLa cells were exposed or not to IR and subjected to metaphase assay. Chromosomes were counterstained with Giemsa and the aberrations were quantified. c,d, WT or H1.4-KO HeLa cell lines stably expressing WT or mutant H1.4 were subjected to colony formation assay after IR (c) or VP16 (d) exposure. Statistical analyses of survival rates at the last dose are shown. e,f, WT or two CTPS1-KO HeLa cell lines were subjected to colony formation assay after VP16 (e) or IR (f) exposure and the survival rate was quantified. g, WT or CTPS1-KO HeLa cell lines were treated with or without 200 μM CTP for 2 h and exposed to IR. Cells were sub-seeded for colony formation assay and the survival rate was quantified. h-j, WT or CTPS1-KO HeLa cells were injected into nude mice, followed by treatment with or without IR (n = 6 per group). Tumor images (h left) and tumor weights (h right) of xenografts are shown. Immunoblots of extracted histones (i), and representative immunohistochemistry and TUNEL staining images of xenografts (j) are shown. Scale bars, 50 μm. k, Representative immunohistochemistry images of CTPS1 expression in cervical cancer tissues isolated from patients before exposure to radiotherapy. Sensitive, patients who were survived after 5 years post radiotherapy; Resistant, patients who were dead within 5 years post radiotherapy. l, Representative western blot images of CTPS1 and H1N76/77D expression in 8 cervical cancer tissues isolated from patients after exposure to radiotherapy. m, Model of H1N76/77D-mediated regulation of chromatin structure in the context of DNA damage. Deamidation of H1N76/77 catalyzed by CTPS1 is prerequisite for a sequential binding of histone acetyltransferase p300 to the reaction site of H1K75. This specific H1K75 acetylation is well associated with an opening structure of damaged chromatin and is therefore beneficial for DNA damage repair factors loading onto the DNA damage sites. The working model was created using BioRender (https://biorender.com). Data represent the means ± s.d. (a-c, e-h) or means (d). n = 5 fields (a,b), n = 3 samples (c, g), n = 2 (d) samples, or n = 4 samples (e,f) from three independent experiments. P values were calculated using Student unpaired two-tailed t-tests (c-h). Scale bars, 50 μm (j). Source data

References

    1. Mohan, C., Das, C. & Tyler, J. Histone and chromatin dynamics facilitating DNA repair. DNA Repair107, 103183 (2021). - PMC - PubMed
    1. Song, F. et al. Cryo-EM study of the chromatin fiber reveals a double helix twisted by tetranucleosomal units. Science344, 376–380 (2014). - PubMed
    1. Fan, Y. et al. Histone H1 depletion in mammals alters global chromatin structure but causes specific changes in gene regulation. Cell123, 1199–1212 (2005). - PubMed
    1. Bird, A. W. et al. Acetylation of histone H4 by Esa1 is required for DNA double-strand break repair. Nature419, 411–415 (2002). - PubMed
    1. Chen, C. C. et al. Acetylated lysine 56 on histone H3 drives chromatin assembly after repair and signals for the completion of repair. Cell134, 231–243 (2008). - PMC - PubMed

LinkOut - more resources