. 2025 Jun;642(8067):508-518.
doi: 10.1038/s41586-025-08915-1. Epub 2025 Apr 16.

Perturbing LSD1 and WNT rewires transcription to synergistically induce AML differentiation

Affiliations

Perturbing LSD1 and WNT rewires transcription to synergistically induce AML differentiation

Amir Hosseini et al. Nature. 2025 Jun.

Abstract

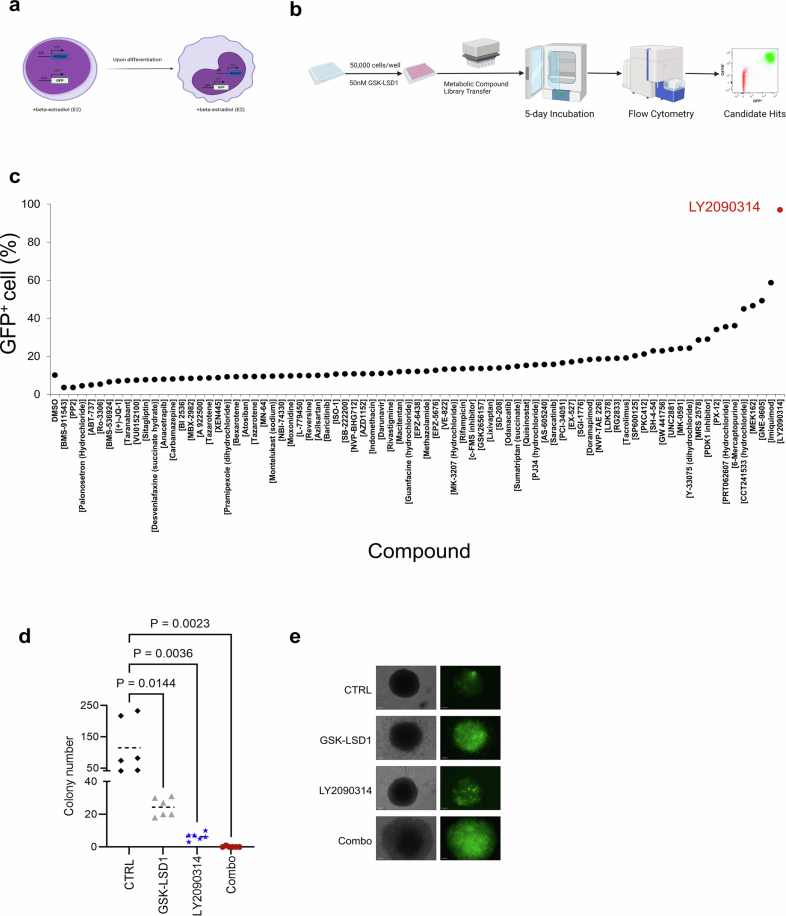
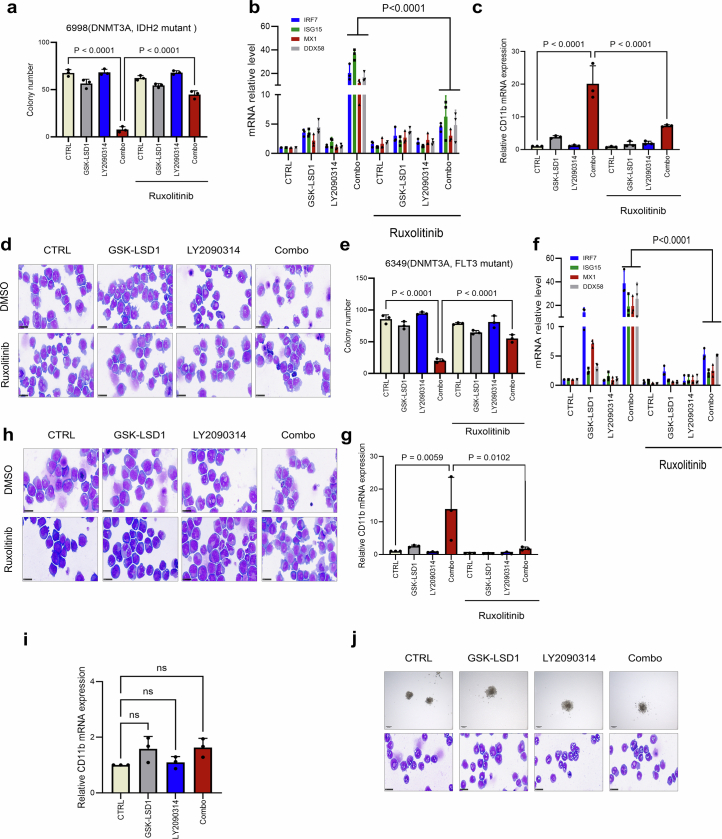
Impaired differentiation is a hallmark of myeloid malignancies1,2. Therapies that enable cells to circumvent the differentiation block, such as all-trans retinoic acid (ATRA) and arsenic trioxide (ATO), are by and large curative in acute promyelocytic leukaemia3, but whether 'differentiation therapy' is a generalizable therapeutic approach for acute myeloid leukaemia (AML) and beyond remains incompletely understood. Here we demonstrate that simultaneous inhibition of the histone demethylase LSD1 (LSD1i) and the WNT pathway antagonist GSK3 kinase4 (GSK3i) robustly promotes therapeutic differentiation of established AML cell lines and primary human AML cells, as well as reducing tumour burden and significantly extending survival in a patient-derived xenograft mouse model. Mechanistically, this combination promotes differentiation by activating genes in the type I interferon pathway via inducing expression of transcription factors such as IRF7 (LSD1i) and the co-activator β-catenin (GSK3i), and their selective co-occupancy at targets such as STAT1, which is necessary for combination-induced differentiation. Combination treatment also suppresses the canonical, pro-oncogenic WNT pathway and cell cycle genes. Analysis of datasets from patients with AML suggests a correlation between the combination-induced transcription signature and better prognosis, highlighting clinical potential of this strategy. Collectively, this combination strategy rewires transcriptional programs to suppress stemness and to promote differentiation, which may have important therapeutic implications for AML and WNT-driven cancers beyond AML.


Conflict of interest statement

Competing interests: Y. Shi is a co-founder of K36 Therapeutics, Alternative Bio (ABio); a member of the Scientific Advisory Boards of K36 Therapeutics, ABio, Epigenica AB and Epic Bio; a board member of ABio and Epigenica AB; holds equity in Active Motif, K36 Therapeutics, Epic Bio, ABio and Epigenica AB; and serves on the Scientific Advisory Boards of School of Life Sciences, Westlake University and Westlake Laboratory of Life Sciences and Biomedicine, and Norway Centre for Embryology and Healthy Development. C.A.H. has received funding from Kronos Bio, Novartis, Oncopeptides, WNTResearch and Zentalis Pharmaceuticals for research unrelated to this study; and speaker and advisory fees from Amgen and Autolus. B.P. is a cofounder and equity holder in Alethiomics, a spin-out company from the University of Oxford; has received research funding from Alethiomics, Incyte and Galecto; and honoraria for consulting and/or paid speaking engagements from Incyte, Constellation Therapeutics, Blueprint Medicines, Novartis, GSK and BMS. All other authors declare no competing interests.

Figures

Fig. 1
Fig. 1. Combination of GSK–LSD1 and LY2090314 inhibits proliferation and impairs clonogenic activity of AML cell lines by inducing differentiation.
a, Time course measurement of monocyte differentiation markers in the ER-HOXA9 cell line treated with vehicle, GSK–LSD1 (50 nM), LY2090314 (100 nM) and a combination of both inhibitors for 5 days. Data are presented as mean ± s.d. from three biological independent experiments. P values were determined using two-way analysis of variance (ANOVA). CTRL, control. b, Time course measurement of ER-HOXA9 cell proliferation as in panel a. Data are presented as mean ± s.d. from three biological independent experiments. P values were determined using two-way ANOVA. c, Survival of human AML cell lines treated with different concentrations of LY2090314 (black) and a combination of LY2090314 with 50 nM GSK–LSD1 (red) for 3 days. The luminescence signal was normalized, and dose–response curves and EC50 values were calculated using a non-linear regression curve fit. d, Quantification of colonies formed by the indicated human cell lines treated with DMSO, GSK–LSD1 (50 nM), LY2090314 (100 nM) and a combination of both inhibitors. Data are presented as mean ± s.d. from three biological independent experiments. P values were determined using two-way ANOVA. e, Analysis of the clonogenic activity of THP-1 cells by a serial replating assay. Data are presented as mean ± s.d. from three biological independent experiments. P values were determined using two-way ANOVA. f, Representative images of Kasumi-1, THP-1 and U937 cells treated with the indicated inhibitors for 5 days and stained with Wright–Giemsa. Scale bars, 25 μm. The experiment was repeated three times with similar results.
Fig. 2
Fig. 2. Combo treatment specifically inhibits proliferation of leukaemia cells in vitro and in vivo.
a, Mouse AML cells treated with 50 nM GSK–LSD1 and different concentrations of LY2090314 for 5 days; cell growth was determined by the Cell-Titer-Glo assay. Data are presented as mean ± s.d. from two biological independent experiments. BMDM, bone marrow-derived macrophage; RLU, relative light unit. b, Quantification of colonies formed by normal mouse LSK cells treated with the indicated inhibitors. Data are presented as mean ± s.d. from three biological independent experiments. P values were determined using two-way ANOVA. NS, not significant. c, Flow-cytometric quantification of CD11b and Gr-1 expression in the cells harvested from methylcellulose in panel b. d, Analysis of cell viability in THP-1 cells treated with the indicated inhibitors for 5 days by the Cell-Titer-Glo assay. Data are presented as mean ± s.d. from three biological independent experiments. P values were determined using two-way ANOVA. e, Analysis of CD11b mRNA relative level in THP-1 cells treated with the indicated inhibitors for 5 days. Values were normalized against GAPDH. Data are presented as mean ± s.d. from three biological independent experiments. P values were determined using two-way ANOVA. f, Quantification of colonies formed by THP-1 cells treated with the indicated inhibitors. Data are presented as mean ± s.d. from three biological independent experiments. P values were determined using two-way ANOVA. g,h, Tumour burden (g) and Kaplan–Meier survival curves (h) of mice treated with vehicle (n = 15), GSK–LSD1 (n = 9), LY2090314 (n = 11) or a combination of both inhibitors (n = 20) in a syngeneic model of a HOXA9–MEIS1-driven AML model. P values were determined using the log-rank test. The error bars represent mean ± s.e.m. (g). P values were determined using two-way ANOVA. Source data
Fig. 3
Fig. 3. Combo treatment triggers alterations in the transcriptional and chromatin accessibility profiles associated with myeloid differentiation and IFN response in ER-HOXA9 cells.
a, PCA of RNA sequencing (RNA-seq) of ER-HOXA9 cells treated with vehicle (VEH), GSK–LSD1, LY2090314 (LY) and a combination of both inhibitors (COMBO). b, GSEA of myeloid maturation signatures in drug-treated ER-HOXA9 cells. NES, normalized enrichment score. c, GSEA of additional myeloid maturation signatures in ER-HOXA9 cells treated with combo versus vehicle. d, Expression of genes relating to myeloid differentiation in drug-treated ER-HOXA9 cells. Data are presented as mean ± s.d. from three independent biological replicates. P values indicate the significance of unpaired, two-tailed Student’s t-tests. See source data for individual P values. e, Heatmap of expression of genes synergistically upregulated or downregulated upon combo treatment. f, Expression of genes relating to the type I IFN response in drug-treated ER-HOXA9 cells. Data are presented as mean ± s.d. from three independent biological replicates. See source data for individual P values. g, EnrichR database pathways enriched in upregulated combo synergy signature genes. Significance of enrichment z scores is shown as q values (corresponding to P values adjusted for significance by the Benjamini–Hochberg method). ChIP–seq, chromatin immunoprecipitation followed by sequencing; GO, Gene Ontology; TF, transcription factor. h, PCA of ATAC-seq in drug-treated ER-HOXA9 cells. i, ATAC-seq signal at promoters of type I IFN response genes in combo-treated and vehicle-treated ER-HOXA9 cells. j, Tracks showing ATAC-seq signal at the Mx1 promoter in drug-treated cells. The asterisks indicate significance: *P < 0.05, **P < 0.01, ***P < 0.001, ****P < 0.0001 and NS (P > 0.05). Source data
Fig. 4
Fig. 4. Combo treatment induces selective co-occupancy of IRF7 and β-catenin at the promoter of the type I IFN signalling pathway genes.
a, PCA of IRF7 and β-catenin CUT&RUN in THP-1 cells treated with vehicle, GSK–LSD1, LY2090314 and a combination of both inhibitors. b, Heatmaps showing global signal intensity of IRF7, β-catenin and H3K4me1 CUT&RUN in THP-1 cells treated with vehicle, GSK–LSD1, LY2090314 or a combination of both inhibitors. c, Venn diagrams showing overlap between IRF7 and β-catenin binding in LY2090314-treated and combo-treated THP-1 cells (top), and genomic distributions of singly and co-bound peaks shown for combo-treated cells (below). UTR, untranslated region. d, CUT&RUN signal of IRF7 and β-catenin at promoters of type I IFN response genes (left two panels) and myeloid differentiation signature genes (right two panels) after drug treatments. TES, transcription end site; TSS, transcription start site. e, Enrichment of top motifs relating to myeloid differentiation in genomic regions co-bound by IRF7 and β-catenin. Motif enrichment significance was determined via hypergeometric tests. f, Tracks of IRF7, β-catenin and H3K4me1 CUT&RUN at the STAT1 and STAT2 loci in drug-treated THP-1 cells. Gene expression of each gene after drug treatments is shown to the right of the corresponding CUT&RUN track. Data are presented as mean ± s.d. from three independent biological replicates. P values indicate the significance of unpaired, two-tailed Student’s t-tests.
Fig. 5
Fig. 5. Combo treatment promotes differentiation, reduces the clonogenic potential of human primary AML cells ex vivo and enhances survival in vivo.
ac, Fold change induction of CD11b+ cells in primary AML samples (n = 16 biologically independent samples) cultured with varying concentrations of GSK–LSD1 (a) or LY2090314 (b) or a combination of both inhibitors (c) relative to the vehicle (dashed line). Each dot represents one primary sample. See the note for statistical analyses in the statistical analysis section in the Methods. df, Quantification of colonies formed by DNMT3A-mutant primary AML samples treated with the indicated inhibitors. Data are presented as mean ± s.d. from three biological independent experiments. P values were determined using two-way ANOVA. g, Quantification of colonies formed by normal haematopoietic progenitor cells treated with the indicated inhibitors. P values were determined using two-way ANOVA. Data are mean ± s.d. from six biologically independent experiments. h, Kaplan–Meier survival curves of mice treated with vehicle (n = 8), GSK–LSD1 (n = 8), LY2090314 (n = 8) or a combination of both inhibitors (n = 8) in the OCI-AML3 model. P values were determined using the log-rank test. *P = 0.0306 and ***P = 0.0003. i, Kaplan–Meier survival curves of mice treated with vehicle (n = 5), GSK–LSD1 (n = 5), LY2090314 (n = 5) or a combination of both inhibitors (n = 5) in the DNMT3A-mutant AML-579 PDX model. P values were determined using the log-rank test. **P = 0.0025. j, Correlations between OHSU patient combo synergy enrichment scores, type I IFN response gene enrichment scores, WNT pathway gene enrichment scores and LSC signature gene enrichment scores in the OHSU patient cohort. r refers to the Pearson correlation coefficient. k, Kaplan–Meier plot showing overall survival of OHSU patients stratified by above and below the median combo synergy signature scores. P values were determined using the log-rank test. Source data
Extended Data Fig. 1
Extended Data Fig. 1. High-throughput screening identifies LY2090314 as an enhancer of LSD1i-mediated differentiation.
a, ER-HoxA9 as a cellular model for a phenotypic screen of AML differentiation. upon differentiation, ER-HoxA9 cells upregulate GFP fluorescence. The illustrations of the cells were created using BioRender (https://biorender.com). b, The small molecule library was pin-transferred into 96-well plates containing ER-HoxA9 cells in media with 50 nM GSK-LSD1. Plates were incubated for 5 days, and differentiation was evaluated by GFP expression and cell-surface marker CD11b. The schematic was created using BioRender (https://biorender.com). c, The GSK3 inhibitor, LY2090314, showed the strongest synergy with 50 nM GSK-LSD1 to induce differentiation in ER-HoxA9 cells over 5 days of in vitro culture. d, Quantification of colonies formed by ER-HoxA9 cells treated with indicated inhibitors. Data are ± SD of six biological independent experiments. P-values were determined using two-way analysis of variance (ANOVA). e, Morphology of ER-HoxA9 colonies treated with indicated inhibitors. Representative micrographs from (d). Scale bars, 50 μm. The experiment was repeated three times with similar results.
Extended Data Fig. 2
Extended Data Fig. 2. LSD1 and GSK3 inhibitors potently synergize in different AML cell lines.
a. Synergy plot using an HSA model for THP-1, Kasumi-1, U937, MOLM-13, OCI-AML3 and OCI-AML2 cells treated with different concentrations of GSK-LSD1 and LY2090314 for 5 days. b, Analysis of CD11b mRNA relative levels in U937 cells treated with the indicated inhibitors for 5 days. Values were normalized against GAPDH. Data are presented as mean ± SD of 3 biological independent experiments (n = 3). P-values were determined using two-way analysis of variance (ANOVA). c, Analysis of CD11b cell-surface protein relative levels in U937 cells treated with the indicated inhibitors for 5 days. Data are presented as mean ± SD of 3 biological independent experiments (n = 3). P-values were determined using two-way analysis of variance (ANOVA). d, Analysis of CD11b mRNA relative levels in human AML cells treated with the indicated inhibitors for 5 days. Values were normalized against GAPDH. Data are presented as mean ± SD of 3 biological independent experiments (n = 3). P-values were determined using two-way analysis of variance (ANOVA). e, Analysis of THP-1 cell viability after treatment with IMG-7289, LY2090314 or combination of both inhibitors for 5 days by Cell-Titer-Glo assay. Data are presented as mean ± SD of 3 biological independent experiments (n = 3). P-values were determined using two-way analysis of variance (ANOVA). f, Analysis of CD11b mRNA relative levels in THP-1 cells treated with IMG-7289, LY2090314 or combination of both inhibitors for 5 days. Values were normalized against GAPDH. Data are presented as mean ± SD of 3 biological independent experiments (n = 3). P-values were determined using two-way analysis of variance (ANOVA). g, Analysis of THP-1 cell viability after treatment with TAK-418, LY2090314 or combination of both inhibitors for 5 days by Cell-Titer-Glo assay. Data are presented as mean ± SD of 3 biological independent experiments (n = 3). P-values were determined using two-way analysis of variance (ANOVA). h, Analysis of CD11b mRNA relative levels in THP-1 cells treated with TAK-418 or LY2090314 and combination of both inhibitors for 5 days. Values were normalized against GAPDH. Data are presented as mean ± SD of 3 biological independent experiments (n = 3). P-values were determined using two-way analysis of variance (ANOVA).
Extended Data Fig. 3
Extended Data Fig. 3. Combo treatment triggers transcriptional changes associated with myeloid differentiation and interferon response in AML cells.
a, GSEA of 47-gene leukemia stem cell (LSC) signature in ER-HoxA9 cells treated with drug combo vs. vehicle. b, PCA of RNA-seq of THP-1 cells treated with vehicle, GSK-LSD1, LY2090314 or combination of both inhibitors. c, GSEA of myeloid maturation signatures in drug-treated THP-1 cells. d, GSEA of additional myeloid maturation signatures in THP-1 cells treated with combo vs. vehicle. e, GSEA of Somervaille leukemia stem cell (LSC) signatures in THP-1 cells treated with combo vs. vehicle. f, Western immunoblots for β-catenin, phospho-GSK3α/β (Y279/Y216), IRF7 and vinculin after treatment with the indicated inhibitors for 3 days in THP-1 cells. Vinculin was used as a loading control. The experiment was repeated three times with similar results. g, GSEA of Wnt and β-catenin signaling genes in ER-HoxA9 cells treated with drug combo vs. vehicle. h, GSEA of Wnt and β-catenin signaling genes in THP-1 cells treated with drug combo vs. vehicle. i, Expression of TCF7 (TCF1) in drug-treated ER-HoxA9 cells. Data are presented as mean values ± SD from three independent biological replicates. P-values indicate the significance of unpaired, two-tailed Student t-tests. “ns” indicates not significant. j, Heatmap of expression of genes synergistically upregulated or downregulated upon combo treatment (left), and type I interferon signature genes (right). k, Expression of genes relating to the type I interferon response in drug-treated THP-1 cells. Data are presented as mean values ± SD from three independent biological replicates. P-values indicate the significance of unpaired, two-tailed Student t-tests. See source data for individual P-values. Asterisks indicate significance at these levels: *P < 0.05, **P < 0.01, ***P < 0.001, ****P < 0.0001, “ns” indicates not significant. l, EnrichR database pathways enriched in upregulated combo synergy signature genes. Significance of enrichment z-scores is shown as q-values (corresponding to p-values adjusted for significance by Benjamini-Hochberg method). m, Dot blot for dsRNA using total RNA from THP-1 cells treated with indicated inhibitors for 3 days. Total RNA extract treated with mock, RNase T1, RNase III, or RNase A (350 mM NaCl) was dotted on Hybond N+ membranes, visualized by methylene blue staining and immunoblotted with J2 antibody. n, Table shows rank and P-value of enrichment of top transcription factor (TF) motifs in accessible chromatin of ER-HoxA9 cells treated with vehicle, GSK-LSD1, LY2090314 or combination of both inhibitors. Motifs shown in all treatments are the top 10 motifs from combo-treated cells. Enrichment rank and P-values of TCF7 (TCF1) and LEF motifs are also shown. Motif enrichment significance was determined via hypergeometric tests. Source data
Extended Data Fig. 4
Extended Data Fig. 4. Combo treatment activates type I interferon signaling in AML cells.
a, b, c, Analysis of ISG15 and MX1 mRNA relative levels in THP-1 (a), MOLM-13 (b) and U937 (c) cells treated with indicated inhibitors. Values were normalized against GAPDH. Data are presented as mean ± SD of 3 biological independent experiments (n = 3). P-values were determined using two-way analysis of variance (ANOVA). d, CUT&RUN-qPCR occupancy analysis of β-catenin on promoter of STAT1, IFIH1 and STAT2 in OCI-AML3 cell treated with indicated inhibitors. Data are presented as mean ± SD of 3 biological independent experiments (n = 3). P-values were determined using two-way analysis of variance (ANOVA). e, CUT&RUN-qPCR occupancy analysis of IRF7 on promoter of STAT1, IFIH1 and STAT2 in OCI-AML3 cell treated with indicated inhibitors. Data are presented as mean ± SD of 3 biological independent experiments (n = 3). P-values were determined using two-way analysis of variance (ANOVA). f, CUT&RUN-qPCR occupancy analysis of β-catenin on promoter of STAT1, IFIH1 and STAT2 in MOLM-13 cell treated with indicated inhibitors. Data are presented as mean ± SD of 3 biological independent experiments (n = 3). P-values were determined using two-way analysis of variance (ANOVA). g, CUT&RUN-qPCR occupancy analysis of IRF7 on promoter of STAT1, IFIH1 and STAT2 in MOLM-13 cell treated with indicated inhibitors. Data are presented as mean ± SD of 3 biological independent experiments (n = 3). P-values were determined using two-way analysis of variance (ANOVA). h, Scatter correlation plot of H3K4me1 and mRNA expression in THP-1 cells treated with combo. R indicates Pearson correlation value. “ns” indicates not significant.
Extended Data Fig. 5
Extended Data Fig. 5. The impact of combo treatment is significantly diminished by the inhibition of STAT1 activation.
a, Western blot analysis of p-STAT1 (Y701) and total STAT1 from THP-1 cells treated with indicated inhibitors in the presence or absence of ruxolitinib for 5 days. Tubulin was used as a loading control. The experiment was repeated three times with similar results. b, Analysis of IRF7, ISG15, MX1 and DDX58 mRNA relative levels in THP-1 cells treated with indicated inhibitors in the presence or absence of ruxolitinib for 5 days. Values were normalized against GAPDH. Data are presented as mean ± SD of 3 biological independent experiments (n = 3). P-values were determined using two-way analysis of variance (ANOVA). c, Analysis of cell viability in THP-1 cells treated with the indicated inhibitors in the presence or absence of ruxolitinib for 5 days by Cell-Titer-Glo assay. Data are presented as mean ± SD of 3 biological independent experiments (n = 3). P-values were determined using two-way analysis of variance (ANOVA). d, Analysis of CD11b mRNA relative levels in THP-1 cells treated with the indicated inhibitors in the presence or absence of ruxolitinib for 5 days. Data are presented as mean ± SD of 3 biological independent experiments (n = 3). P-values were determined using two-way analysis of variance (ANOVA). e, Representative images of THP-1 cells treated with indicated inhibitors in the presence or absence of ruxolitinib for 5 days and stained with Wright-Giemsa. Scale bars, 25 μm. The experiment was repeated three times with similar results. f, Analysis of ISG15 and MX1 mRNA relative levels in MOLM-13 cells treated with indicated inhibitors in the presence or absence of ruxolitinib for 5 days. Values were normalized against GAPDH. Data are presented as mean ± SD of 3 biological independent experiments (n = 3). P-values were determined using two-way analysis of variance (ANOVA). g, Analysis of cell viability in MOLM-13 cells treated with the indicated inhibitors in the presence or absence of ruxolitinib for 5 days by Cell-Titer-Glo assay. Data are presented as mean ± SD of 3 biological independent experiments (n = 3). P-values were determined using two-way analysis of variance (ANOVA). h, Analysis of CD11b mRNA relative levels in MOLM-13 cells treated with the indicated inhibitors in the presence or absence of ruxolitinib for 5 days. Values were normalized against GAPDH. Data are presented as mean ± SD of 3 biological independent experiments (n = 3). P-values were determined using two-way analysis of variance (ANOVA). i, Western blot analysis of STAT1 protein level in THP-1 cells. Two independent clones were used for STAT1-KO. Tubulin was used as a loading control. The experiment was repeated three times with similar results. j, Analysis of IRF7, ISG15, MX1 and DDX58 mRNA relative levels in STAT1-KO THP-1 cells treated with indicated inhibitors for 5 days. Values were normalized against GAPDH. Data are presented as mean ± SD of 3 biological independent experiments (n = 3). P-values were determined using two-way analysis of variance (ANOVA). k, Analysis of cells viability in STAT1-KO THP-1 cells treated with indicated inhibitors for 5 days by Cell-Titer-Glo assay. Data are presented as mean ± SD of 3 biological independent experiments (n = 3). P-values were determined using two-way analysis of variance (ANOVA). l, Analysis of CD11b mRNA relative levels in STAT1-KO THP-1 cells treated with indicated inhibitors for 5 days. Data are presented as mean ± SD of 3 biological independent experiments (n = 3). P-values were determined using two-way analysis of variance (ANOVA). m, Analysis of β-catenin and IRF7 interactions by co-immunoprecipitation in THP-1 cells treated with indicated inhibitors for 5 days. Vinculin was used as a loading control. The experiment was repeated three times with similar results. n, CUT&RUN tracks of IRF7 and β-catenin at the MYC locus in drug-treated THP-1 cells. o, Enrichment of E2F motifs in genomic regions co-bound by IRF7 and β-catenin in combo-treated THP-1 cells. Motif enrichment significance was determined via hypergeometric tests. p, Top 7 ChipEnrich Hallmark database pathway enrichments in genes mapping to genomic regions co-bound by IRF7 and β-catenin in combo-treated THP-1 cells. P-values were determined via ChIP-Enrich method.
Extended Data Fig. 6
Extended Data Fig. 6. GSK3α and GSK3β depletion have distinct effects on β-catenin stabilization and their synergy with LSD1 inhibitor.
a, Western blot analysis of GSK3α and GSK3β and β-Catenin protein level in THP-1 cells. Two independent clones were used for GSK3A-KD and GSK3B-KD. Vinculin was used as a loading control. The experiment was repeated three times with similar results. b, Analysis of cell viability in GSK3α- and GSK3β-depleted THP-1 cells using the Cell-Titer-Glo assay. Data are presented as mean ± SD of 3 biological independent experiments (n = 3). P-values were determined using two-way analysis of variance (ANOVA). c, Analysis of CD11b mRNA relative levels in GSK3α- and GSK3β-depleted THP-1 cells. Values were normalized against GAPDH. Data are presented as mean ± SD of 3 biological independent experiments (n = 3). P-values were determined using two-way analysis of variance (ANOVA). d, Representative images of GSK3α- and GSK3β-depleted THP-1 cells stained with Wright-Giemsa. Scale bars, 25 μm. The experiment was repeated three times with similar results. e, Western blot analysis of β-Catenin, IRF7, Vinculin, β-Actin and GSK3β protein level in THP-1 cells infected with shCTRL and shGSK3B and treated with indicated inhibitors for 3 days. Vinculin and β-Actin were used as loading controls. The experiment was repeated three times with similar results. f, Analysis of cell viability in THP-1 cells infected with shCTRL and shGSK3B and treated with indicated inhibitors for 5 days using the Cell-Titer-Glo assay. Data are presented as mean ± SD of 3 biological independent experiments (n = 3). P-values were determined using two-way analysis of variance (ANOVA). g, Analysis of CD11b mRNA relative levels in THP-1 cells infected with shCTRL and shGSK3B and treated with indicated inhibitors for 5 days. Values were normalized against GAPDH. Data are presented as mean ± SD of 3 biological independent experiments (n = 3). P-values were determined using two-way analysis of variance (ANOVA). h, Western blot analysis of β-Catenin, IRF7, Vinculin, β-Actin, GSK3β and GSK3α protein level in THP-1 cells infected with shCTRL and shGSK3A and treated with indicated inhibitors for 3 days. Vinculin and β-Actin were used as loading controls. The experiment was repeated three times with similar results. i, Analysis of cell viability in THP-1 cells infected with shCTRL and shGSK3A and treated with indicated inhibitors for 5 days using the Cell-Titer-Glo assay. Data are presented as mean ± SD of 3 biological independent experiments (n = 3). P-values were determined using two-way analysis of variance (ANOVA). j, Analysis of CD11b mRNA relative levels in THP-1 cells infected with shCTRL and shGSK3A and treated with indicated inhibitors for 5 days. Values were normalized against GAPDH. Data are presented as mean ± SD of 3 biological independent experiments (n = 3). P-values were determined using two-way analysis of variance (ANOVA). k, Representative images of THP-1 cells infected with shCTRL, shGSK3B or shGSK3A, treated with the indicated inhibitors for 5 days, and stained with Wright-Giemsa. Scale bars, 25 μm. The experiment was repeated three times with similar results. “ns” indicates not significant.
Extended Data Fig. 7
Extended Data Fig. 7. Effect of the combo treatment in different primary AML samples.
a, Quantification of colonies formed by a NPM1-mutant primary AML sample treated with DMSO, GSK-LSD1 (50 nM), LY2090314 (100 nM) or combination of both inhibitors. Data are presented as mean ± SD of 3 biological independent experiments (n = 3). P-values were determined using two-way analysis of variance (ANOVA). b, Quantification of colonies formed by two different DNMT3A-WT primary AML samples treated with DMSO, GSK-LSD1 (50 nM), LY2090314 (100 nM) or combination of both inhibitors. Data are presented as mean ± SD of 3 biological independent experiments (n = 3). P-values were determined using two-way analysis of variance (ANOVA). c, Quantification of colonies formed by two different TP53-mutant primary AML samples treated with DMSO, GSK-LSD1 (50 nM), LY2090314 (100 nM) and combination of both inhibitors. Data are presented as mean ± SD of 3 biological independent experiments (n = 3). P-values were determined using two-way analysis of variance (ANOVA). d, Wright-Giemsa-stained cytospins for primary AML samples treated with DMSO, GSK-LSD1 (50 nM), LY2090314 (100 nM) and combination of both inhibitors. Scale bars, 25 μm. The experiment was repeated three times with similar results. e, Wright-Giemsa-stained cytospins for a DNMT3A-mutant primary AML sample treated with DMSO, IMG-7289 (50 nM), 9-ING-41 (100 nM) and combination of both inhibitors. Scale bars, 25 μm. The experiment was repeated three times with similar results. f, Fold change induction of β-catenin-positive cells in primary AML samples (n = 5 biologically independent samples) treated with Vehicle, GSK-LSD1 (50 nM), LY2090314 (100 nM) or combination of both inhibitors. For statistical analyses two-sided Mann Whitney U tests were used * = P < 0.05. Comparisons: DMSO - LY2090314 p-value = 0.042, DMSO – Combo p-value = 0.042, GSK-LSD1 - LY2090314 p-value = 0.048, GSK-LSD1- Combo p-value 0.048. P-values were adjusted with Bonferroni method. In the boxplot, the middle line represents the median, the lower and upper hinges represent the 25th and 75th percentiles, the lower whisker extends from the lower hinge to the smallest value at most 1.5*inter-quartile range (IQR) of the hinge, the upper whisker extends from the upper hinge to the largest value no further than 1.5*IQR of the hinge. Data beyond the whiskers are outliers that are plotted individually. g, Analysis of IRF7, ISG15, DDX58 and MX1 mRNA relative levels in DNMT3A-mutant primary AML samples treated with DMSO, GSK-LSD1 (50 nM), LY2090314 (100 nM) or combination of both inhibitors. Values were normalized against GAPDH. Each dot represents one primary sample and n = 3 biological independent experiments. P-values were determined using two-way analysis of variance (ANOVA). h, Analysis of ERVs mRNA relative levels in DNMT3A-WT vs DNMT3A-mutant primary AML samples. Each dot represents one primary sample and n = 3 biological independent experiments. P-values were determined using two-way analysis of variance (ANOVA). i, Analysis of IRF7, ISG15, DDX58 and MX1 mRNA relative levels in a DNMT3A-WT vs DNMT3A-mutant primary AML samples. Values were normalized against GAPDH. Each dot represents one primary sample and n = 3 biological independent experiments. P-values were determined using two-way analysis of variance (ANOVA). “ns” indicates not significant.
Extended Data Fig. 8
Extended Data Fig. 8. Ruxolitinib treatment abrogates the effect of the combo treatment in primary AML samples.
a, Quantification of colonies formed by a primary AML sample (6998) treated with DMSO, GSK-LSD1 (50 nM), LY2090314 (100 nM) or combination of both inhibitors in the presence or absence of ruxolitinib. Data are presented as mean ± SD of 3 biological independent experiments (n = 3). P-values were determined using two-way analysis of variance (ANOVA). b, Analysis of IRF7, ISG15, MX1 and DDX58 mRNA relative levels in the primary sample (6998) treated with indicated inhibitors in the presence or absence of ruxolitinib. Values were normalized against GAPDH. Data are presented as mean ± SD of 3 biological independent experiments (n = 3). P-values were determined using two-way analysis of variance (ANOVA). c, Analysis of CD11b mRNA relative levels in the primary sample (6998) treated with the indicated inhibitors in the presence or absence of ruxolitinib. Values were normalized against GAPDH. Data are presented as mean ± SD of 3 biological independent experiments (n = 3). P-values were determined using two-way analysis of variance (ANOVA). d, Representative images of the AML primary sample (6998) treated with indicated inhibitors in the presence or absence of ruxolitinib and stained with Wright-Giemsa. Scale bars, 25 μm. The experiment was repeated three times with similar results. e, Quantification of colonies formed by a primary AML sample (6349) treated with DMSO, GSK-LSD1 (50 nM), LY2090314 (100 nM) and combination of both inhibitors in the presence or absence of ruxolitinib. Data are presented as mean ± SD of 3 biological independent experiments (n = 3). P-values were determined using two-way analysis of variance (ANOVA). f, Analysis of IRF7, ISG15, MX1 and DDX58 mRNA relative levels in the primary sample (6349) treated with indicated inhibitors in the presence or absence of ruxolitinib. Values were normalized against GAPDH. Data are presented as mean ± SD of 3 biological independent experiments (n = 3). P-values were determined using two-way analysis of variance (ANOVA). g, Analysis of CD11b mRNA relative levels in the primary sample (6349) treated with the indicated inhibitors in the presence or absence of ruxolitinib. Values were normalized against GAPDH. Data are presented as mean ± SD of 3 biological independent experiments (n = 3). P-values were determined using two-way analysis of variance (ANOVA). h, Representative images of the AML primary sample (6349) treated with indicated inhibitors in the presence or absence of ruxolitinib and stained with Wright-Giemsa. Scale bars, 25 μm. P-values were determined using two-way analysis of variance (ANOVA). The experiment was repeated three times with similar results. i, Analysis of CD11b mRNA relative levels in CD34+ cells treated with the indicated inhibitors. Values were normalized against GAPDH. Data are presented as mean ± SD of 3 biological independent experiments (n = 3). P-values were determined using two-way analysis of variance (ANOVA). “ns” indicates not significant. j, Morphology of CD34+ cells and their colonies treated with indicated inhibitors. Scale bars, 50 μm for colonies morphology and 25 μm for morphology of cells. The experiment was repeated three times with similar results.
Extended Data Fig. 9
Extended Data Fig. 9. Combo treatment efficacy in vivo.
a, Related to Fig. 5h. Representative images of spleen harvested from mice at the end of treatment in OCI-AML3 model. b, c, d, related to Fig. 5i. Body weight variance (b), representative bioluminescence images (c) and quantitative bioluminescence imaging data (d) for mice treated with indicated inhibitor in DNMT3A-mutant PDX sample, AML-579. **** = p < 0.0001. e, f, g, Kaplan–Meier survival curves (e), tumor burden (f) and body weight variance (g) of vehicle (n = 4), GSK-LSD1 (n = 4), LY2090314 (n = 4) or combination of both inhibitors (n = 4)–treated mice in the DNMT3A-WT PDX sample, AML-372. Treatment was initiated 13 days after transplantation for two weeks. P-values were determined using the log-rank test. * = p = 0.0344, ** = p = 0.0096. h, Fold change in CD11b+ cells among patient-derived cells isolated from human organoids after 5 days of treatment with vehicle, GSK-LSD1, LY2090314 or combination therapy. Data are presented as mean ± SD of 3 biological independent experiments (n = 3). P-values were determined using two-way analysis of variance (ANOVA). Source data
Extended Data Fig. 10
Extended Data Fig. 10. Combo treatment suppresses the Wnt pathway in AML and colorectal cells.
a, Number of DNMT3A-WT and DNMT3A-mutant OHSU patients with high (upper quartile) combo synergy scores and low (quartiles 1-3) combo synergy scores. b, data in (a) shown via bar graph. P-value reports significance of overrepresentation of DNMT3A mutant patients in the synergy score high population using one-proportion z-tests. “ns” indicates not significant. c, Analyzing the TCF/LEF reporter activity in THP-1 cells following treatment with indicated inhibitors, with and without the presence of WNT3a. Data are presented as mean ± SD of 3 biological independent experiments (n = 3). P-values were determined using two-way analysis of variance (ANOVA). d, Analyzing the TCF/LEF reporter activity in HCT-116 cells following treatment with indicated inhibitors, with and without the presence of WNT3a. Data are presented as mean ± SD of 3 biological independent experiments (n = 3). P-values were determined using two-way analysis of variance (ANOVA).

References

    1. DiNardo, C. D., Erba, H. P., Freeman, S. D. & Wei, A. H. Acute myeloid leukaemia. Lancet401, 2073–2086 (2023). - PubMed
    1. Döhner, H. et al. Diagnosis and management of AML in adults: 2022 recommendations from an international expert panel on behalf of the ELN. Blood140, 1345–1377 (2022). - PubMed
    1. De Thé, H. Differentiation therapy revisited. Nat. Rev. Cancer18, 117–127 (2018). - PubMed
    1. Liu, J. et al. Wnt/β-catenin signalling: function, biological mechanisms, and therapeutic opportunities. Signal Transduct Target Ther.7, 3 (2022). - PMC - PubMed
    1. Yi, M. et al. The global burden and attributable risk factor analysis of acute myeloid leukemia in 195 countries and territories from 1990 to 2017: estimates based on the global burden of disease study 2017. J. Hematol. Oncol.13, 72 (2020). - PMC - PubMed

MeSH terms