. 2025 Jun;642(8068):814-821.
doi: 10.1038/s41586-025-08890-7. Epub 2025 Apr 16.

Structure of the ATP-driven methyl-coenzyme M reductase activation complex

Affiliations

Structure of the ATP-driven methyl-coenzyme M reductase activation complex

Fidel Ramírez-Amador et al. Nature. 2025 Jun.

Abstract

Methyl-coenzyme M reductase (MCR) is the enzyme responsible for nearly all biologically generated methane1. Its active site comprises coenzyme F430, a porphyrin-based cofactor with a central nickel ion that is active exclusively in the Ni(I) state2,3. How methanogenic archaea perform the reductive activation of F430 represents a major gap in our understanding of one of the most ancient bioenergetic systems in nature. Here we purified and characterized the MCR activation complex from Methanococcus maripaludis. McrC, a small subunit encoded in the mcr operon, co-purifies with the methanogenic marker proteins Mmp7, Mmp17, Mmp3 and the A2 component. We demonstrated that this complex can activate MCR in vitro in a strictly ATP-dependent manner, enabling the formation of methane. In addition, we determined the cryo-electron microscopy structure of the MCR activation complex exhibiting different functional states with local resolutions reaching 1.8-2.1 Å. Our data revealed three complex iron-sulfur clusters that formed an electron transfer pathway towards F430. Topology and electron paramagnetic resonance spectroscopy analyses indicate that these clusters are similar to the [8Fe-9S-C] cluster, a maturation intermediate of the catalytic cofactor in nitrogenase. Altogether, our findings offer insights into the activation mechanism of MCR and prospects on the early evolution of nitrogenase.


Conflict of interest statement

Competing interests: The authors declare no competing interests.

Figures
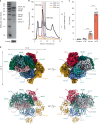
Fig. 1
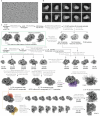
Fig. 1. Composition, ATP-dependent in vitro activation and molecular architecture of the MCR activation complex.
a, Purified subunits of the MCR activation complex and western blotting of Twin-Strep McrC using an anti-Twin-Strep-tag antibody. At least three independent polyacrylamide gels exhibited the same separation pattern (for uncropped gels, see Supplementary Fig. 1). b, Separation of the MCR activation complex and MCR core by SEC (Extended Data Fig. 2b,c). c, CH4 production assays showing the ATP-dependent activation of MCR in vitro. Control, reaction with no protein; −ATP, depletion of ATP with alkaline phosphatase (Quick CIP; Methods); As iso, ‘as isolated’ protein; +ATP, external addition of ATP. All data points are presented as mean values ± s.e.m. (error bars) from three independent biological replicates, each with three technical replicates. Statistical analysis was performed using an unpaired t-test to compare the reaction without ATP (−ATP) versus ‘As iso’ (significance level P ≤ 0.0001) and +ATP versus ‘As iso’ (significance level P ≤ 0.0001). d, Segmented cryo-EM map (top) and corresponding protein model (bottom) of the MCR activation complex. Source Data
Fig. 2
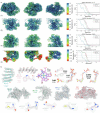
Fig. 2. Interactions between MCR and the activation complex proteins.
a, Bottom view of the disordered N-terminal helix of McrA relative to McrC and the activation complex. Owing to the high flexibility, residues 31–58 of McrA are missing in the electron density (dashed line). The MCR core is depicted as a surface; only the unfolded region of McrA and the activation subunits are shown as cartoons. The electron density is depicted as a mesh (contour level σ of 0.04). b, Overlay of McrA and McrA′ (proximal and distal to the activation complex, respectively) showing the displacement and loss of secondary structure from the N-terminal section of McrA. c, Hydrophobic patches formed by the C-terminal domain of Mmp3 and the A2 component to hold the disordered N-terminal helix of McrA. d, A2 component (cartoon) sitting on the backside of MCR (surface). ATP molecules bind within both active sites, suggesting a pre-hydrolytic state (contour level σ of 0.08). Mg ions are shown as pink spheres.
Fig. 3
Fig. 3. Asymmetric catalytic sites during the activation of MCR.
a, Distal active site showing the substrates CoB–SH and CoM–SH. b, Proximal active site containing the CoMS–SCoB by-product. Key residues rearranged to expand the pocket surrounding CoMS–SCoB. All distances between relevant atoms (dashed lines) are in angstrom (Å). c,d, Comparison of the structural arrangements at the distal (′) (c) and proximal (d) catalytic sites of MCR. MCR is depicted as a surface. e, Superposition of distal (orange) and proximal MCR subunits relative to the activation complex. The indicated loops in McrA and McrB are reoriented when McrC and the activation complex bind.
Fig. 4
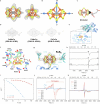
Fig. 4. Nitrogenase-like FeS clusters are coordinated by McrC and Mmp7.
a, Edge-to-edge distances between the FeS clusters and F430 at the proximal active site. b, FeS clusters in their electron density and coordinating residues (contour levels σ of 0.168 for FeSI and 0.235 for FeSII and FeSIII). c, Electron density cloud of sulfur atoms in FeSII at a contour level σ of 0.32. Selected bond lengths are shown as dashed lines, and colour depends on the atom pair (Fe–Fe in orange, Fe–S in black and Fe–C in grey). In b and c, distances are in angstrom (Å). d, Temperature-dependent EPR spectra of the ‘as isolated’ MCR activation complex recorded with 1-mW microwave power. Source Data
Extended Data Fig. 1
Extended Data Fig. 1. Integration of DNA sequence encoding for N-terminal Twin-Strep (TS) tag in the genome of M. maripaludis.
a, mcr operon in M. maripaludis. The N-terminal TS-tag was inserted before mcrC. b, Plasmid map of pMM002p/TS-mcrC (see Supplementary Table 2). The dashed line shows the homology overhangs covering 750 bp of the upstream and downstream sequences from the TS insertion site via the CRISPR/Cas12a system (see Methods). c, PCR confirmation of the TS-tag integration before mcrC in 1% agarose gel. At least three independent gels showed the same separation pattern (for uncropped gel see Supplementary Fig. 1). d, Growth curve of M. maripaludis JJ Δupt (black circles) and cells carrying TS-mcrC (white circles). Datapoints are the mean ± s.e.m of two independent biological replicates, measured in duplicates. e, Sanger sequencing with genome-specific primers (see Supplementary Table 1).
Extended Data Fig. 2
Extended Data Fig. 2. Characterization of the MCR activation complex.
a, MS analysis of post-translational modifications in McrA. Left: structures of the amino acid modifications (residue number in McrA). Middle: peptide fragmentation. Right: daughter ion assignments for digested peptides. mHis261 and mArg275 were found in a unique peptide, as well as tGly448 and mCys455. b, Fractions obtained by SEC and calibration curve. Standard proteins are shown as red circles [ovalbumin (Ov), 44 kDa; conalbumin (Co), 75 kDa; aldolase (Al), 158 kDa; ferritin (Fe), 440 kDa] and the sample fractions as gray triangles [EF1-α (F3), 47 kDa; MCR (F2), 298 kDa; MCR + activation complex (F1), 551 kDa – out of calibration limit]. c, SDS-gel with fractions obtained from b (for uncropped gel see Supplementary Fig. 1). At least two gels were tested for confirmation. d, UV-Vis absorption spectra of MCR + activation complex (F1) and MCR core (F2); see b and c. Dashed lines denote wavelengths at 386, 412 (red), 420 and 447 nm. At least three independent biological replicates were carried out, taking one representative to plot. e, Electronic spectrum of the ‘as isolated’ MCR + activation complex (F1). Data fitted with a minimum of three Voigt functions and a single-order polynomial “baseline”, χ2 = 0.009 (residuals are multiplied x10 for visualization). The spectrum agrees with a broad component at 412 nm (blue, FWHM = 40) and more narrow components at 424 nm (magenta, FWHM = 18) and 447 nm (cyan, FWHM = 24). The envelope (red) accounts for the sum of these three bands and the polynomial baseline. All fits were performed with Global Gauss Fit v7.0 (courtesy of Dr. Petko Chernev, Uppsala University). Tentatively, the highest energy band is assigned to an oxidized iron-sulfur cofactor, i.e., similar to [4Fe-4S]+2. The bands at lower energies likely represent the F430 cofactor in the Ni(II) state (424 nm and 447 nm, MCRsilent). Contributions from Ni(I)-F430 (386 nm, MCRred1) cannot be excluded but did not increase the fit quality. f, Activity assays showing CH4 per µg of total protein including complementary experiments [(AMP-PNP, DTT instead of Ti(III)-citrate, and without pre-activation (*, see Methods)]. All data values are shown as mean ± s.e.m. (error bars) from two (AMP-PNP, not pre-activated) or three (DTT) independent biological replicates, with three technical replicates each. Two-sided unpaired t-tests performed to compare the reactions with AMP-PNP vs ‘as iso’ (p = 0.004); ATP vs ‘as iso’ (p < 0.0001); ATP vs DTT (p < 0.0001) and ATP vs ATP* (p < 0.0001). g, Mass photometry histograms of MCR+activation complex ‘as isolated’ (left), and after incubation with 20 mM Ti(III)-citrate plus 5 mM ATP (middle) or 5 mM AMP-PNP (right). Source Data
Extended Data Fig. 3
Extended Data Fig. 3. CryoEM data processing workflow of MCR + activation complex ‘as isolated’.
a, Representative micrograph (total micrographs = 17,548; scale bar = 50 nm) showing the MCR activation complex vitrified under anaerobic conditions (see Methods). b, Reference-free 2D classes from combined (non- and 20° tilted datasets) of MCR and its activation complex showcasing different orientations. c, Processing tree for determining the structure of the MCR activation complex and its peripheral parts (see Methods).
Extended Data Fig. 4
Extended Data Fig. 4. CryoEM data processing workflow after incubating sample with ATP.
a, Representative micrograph (total micrographs = 30,000; scale bar = 25 nm) showing the MCR activation complex vitrified under anaerobic conditions in the presence of ATP (see Methods). b, Reference-free 2D classes from a 25° tilted dataset of MCR and its activation complex showcasing different orientations. c, Processing tree for determining the high-resolution structure of the MCR activation complex and its peripheral parts (see Methods).
Extended Data Fig. 5
Extended Data Fig. 5. CryoEM maps resolution and quality.
a, CryoEM maps colored by their local resolution calculated by GSFSC (plots). Two orthogonal views (left and middle) and a central cut-open view (right) are shown for (1) the complex with the A2 component, as well as the locally refined regions for (2) subunits carrying FeS clusters, (3) the A2 component and (4) Mmp3. (1–3) correspond to the dataset after the incubation with ATP, whereas (4) was obtained from the ‘as isolated’ sample. Lower resolution in the N-terminal domain of Mmp3 suggests increased motion. b, Electron-density maps of representative domains, secondary structure, ligands and post-translational modifications. The contour level is shown between brackets. The density map of the flexible CoMS-SCoB is shown for both the sample incubated with ATP (left) and ‘as isolated’ (right).
Extended Data Fig. 6
Extended Data Fig. 6. Main features of the MCR activation complex components.
a, CryoEM segmented map of MCR’s activation complex ‘as isolated’ with (left) and without (right) the A2 subunit. The disordered N-terminal region of McrA is enclosed in a square. b, Top: incomplete Mmp17 domain (green) as obtained from the electron-density maps and AlphaFold2 model of full Mmp17 (magenta, Uniprot A0A2L1C8U1). RMSD = 1.15 Å when aligned. The rest of the model is shown in dark gray surface. Bottom: front and bottom views of two overlayed sets of the activation complex (clear and dark gray surfaces) binding upon the MCR core (cartoon). The overlapping Mmp17 subunits (clear and dark green) avoid the simultaneous binding of the activation machinery on both halves of MCR. c, Secondary structure topology of the McrC domain. The α-helices and β-sheets are depicted as squares and arrows, respectively. Dashed lines represent loops interacting with McrA (pink) and DUF2098 (gray). Residues coordinating FeS clusters are shown as orange dots. d, Structure of the A2 component, composed by two antiparallel ABC domains (magenta and purple) joined together by a linker (green). Zn is depicted as a gray sphere. The dashed square is a zoom-in of the Zn-binding motif with coordinating cysteines depicted as sticks. e, Electrostatic interactions between the A2 component (cartoon) and the proximal McrG (surface). The positively charged residues from A2 are shown as blue spheres, while McrG is colored from the more negative (red) to the more positive (blue) charges. f, Multiple-sequence-alignment (MSA) showing conservation of the Zn-binding motif (dashed square) in the A2 component of methanotrophic (ANME-1, ANME-2) and methanogenic species (all others). The arrow indicates the model methanogen utilized in this study (M. maripaludis). The MSA was built in MUSCLE and rendered with ESPript 3.0.
Extended Data Fig. 7
Extended Data Fig. 7. Conformational changes in the active site of MCR binding to the activation complex.
a, Close-up of the active sites in X-ray crystallographic structures of MCR showing an alternative product-bound state,. b, Superposition of models of the protein vitrified ‘as isolated’ (gray) and after incubating with ATP. High flexibility of the CoB moiety in CoMS-SCoB and the K244-E249McrA’ loop are shown. c, Zoom-in of McrC wedging towards McrA’. Salt bridges between McrA’ (E156) and McrC (R177) stabilize the opening. d, Superposition of distal (orange) and proximal McrG subunits showing the displacement caused by the interactions with McrC.
Extended Data Fig. 8
Extended Data Fig. 8. Topological analysis and EPR of the FeS clusters in the activation complex.
a, Different views of the FeS clusters found in the activation complex of MCR. The electron-density clouds were obtained at a contour level of 0.23 σ. b, Structure of an L-cluster depicted as a coordinate system. Modified from. c and d, Structure and electron-densities of the M-cluster, respectively, taken from cryoEM resolved structures of nitrogenases. The homocitrate moiety is shown in gray sticks and the black sphere represents molybdenum, vanadium or iron. e, Superposition of McrC (cyan) and the McrC-like domain of Mmp7 (blue, RMSD = 2.5 Å). For clarity, only the amino acid residues composing the second coordination sphere of FeSI (McrC) and FeSIII (Mmp7) are shown. f, Amino acid residues composing the second coordination sphere around the M-cluster in the molybdenum- (green, 8CRS), vanadium- (pink, 6FEA) and iron-only nitrogenases (tan, 8OIE). The ligand and residue numbering correspond to those in the Mo-nitrogenase from A. vinelandii. g, Alternative coordination of the FeSII cluster by C90Mmp7 possibly bridging between Fe3 and Fe7. The side chain of Cys90Mmp7 was reoriented manually and S5A was deleted for visualization. Contour level 0.2 σ. h, EPR wide-field scans of the as-isolated (1), sodium dithionite (2) and thionine (3) treated samples recorded at 10 K. i, Power-dependent saturation curves of the EPR signals from F430 and the FeS clusters recorded at 15 K between 8 µW and 126 mW. The normalized experimental data were fitted using the empirical relation from Portis and Castner, describing the expected power saturation behavior. S is the signal intensity, P1/2 is the power of half-saturation and b corresponds to inhomogeneous (b ≈ 1) or homogenous (1 > b > 3) broadening of the signals. A value for b < 1 is characteristic for dipolar interaction with a paramagnetic site in the vicinity. The paramagnetic nickel species (g = 2.23) was saturated over the entire monitored power range. The power saturation curve from the FeS cluster signal at g = 1.91 clearly shows a decreased saturation, which indicates an enhanced spin relaxation rate, suggesting a dipolar coupling. This is confirmed by the calculated b-value of 0.3. j and k, Temperature-dependent EPR spectra of the complex incubated with sodium dithionite and thionine, respectively. The weak signal at g = 1.77 (*) in the sample reduced with dithionite (j) does not exhibit an unambiguous temperature dependence and could not be assigned to any specific species. The field positions for the power saturation experiments (i) are labelled with arrows. The sharp line at g = 2.003 in k (#) is presumably related to a minor population of an organic radical formed during thionine treatment. Source Data
Extended Data Fig. 9
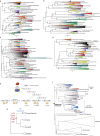
Extended Data Fig. 9. Maximum likelihood phylogenetic trees of McrC (a), Mmp7 (b), NifB (c), CfbD (d) and phylogeny of Nif members (e, f, g).
Trees a, b and d were rooted between Proteoarchaeota [including TACK archaea (Thermoproteati, Methanomethylicota and Bathyarchaeota)], Asgard archaea (Helarchaeota) and Euryarchaeota. The Proteoarchaeota group contains several Euryarchaeal sequences (Syntropharchaeum, Methanoliparia, Archaeoglobi and Methanofastidiosa), which are horizontal acquisitions also observed in the phylogeny of MCR. In c, the phylogeny of NifB was arbitrarily rooted. The root was placed between one group containing most Proteoarchaeota sequences and another containing most Euryarchaeota sequences, implying several horizontal transfer events from Proteoarchaeaota to Euryarchaeota, and from Proteoarchaeota to Bacteria or vice versa. The exact root position is unclear on this tree, but NifB is clearly widely distributed in TACK, Asgard, and Euryarchaeaota. Ultrafast boostrap are indicated at the key nodes. e, Gene duplication events from the homodimeric ancestor CfbD. CfbD is the only homodimeric member of the Nif family, likely representing the outgroup to all other heterotetrameric members comprising two different paralogs (usually designated D and K for complexes that function as reductases, or E and N for maturase complexes). The exact order of divergence between group VI and VnfE/N is unresolved (dashed arrows) and whether either group binds L- or M- clusters is not currently known. f, Reconstructed phylogenetic tree of Nif proteins. This tree was rooted between the D and K paralogs. The D clade is expanded to show Proteoarchaeota (TACK/Asgard, red), Euryarchaeaota (blue) and Bacteria (gray) sequences within each paralog. Proteoarchaeal sequences are very scattered across the tree, implying later horizontal acquisitions of cluster-bearing Nif proteins in this group, rather than an origin in the last common ancestor of Euryarchaeota and Proetoarchaeota. Ultrafast bootstrap support is shown at the key nodes. g, Simplified scheme on the origin of L-cluster binding proteins, mapped on a simplified archaeal species phylogeny. MCR and its associated maturation machinery are present in the last common ancestor of TACK, Asgard and Euryarchaeota. L-cluster bearing Nif-reductases only appear in methanogenic members of Euryarchaeota, no earlier than the last common ancestor of this group.

References

    1. Jackson, R. B. et al. Human activities now fuel two-thirds of global methane emissions. Environ. Res. Lett.19, 101002 (2024).
    1. Ermler, U., Grabarse, W., Shima, S., Goubeaud, M. & Thauer, R. K. Crystal structure of methyl-coenzyme M reductase: the key enzyme of biological methane formation. Science278, 1457–1462 (1997). - PubMed
    1. Grabarse, W. et al. On the mechanism of biological methane formation: structural evidence for conformational changes in methyl-coenzyme M reductase upon substrate binding. J. Mol. Biol.309, 315–330 (2001). - PubMed
    1. Evans, P. N. et al. An evolving view of methane metabolism in the Archaea. Nat. Rev. Microbiol.17, 219–232 (2019). - PubMed
    1. Scheller, S., Goenrich, M., Boecher, R., Thauer, R. K. & Jaun, B. The key nickel enzyme of methanogenesis catalyses the anaerobic oxidation of methane. Nature465, 606–608 (2010). - PubMed

MeSH terms

LinkOut - more resources