. 2025 Apr 16;16(1):3306.
doi: 10.1038/s41467-025-57238-2.

Elevated mitochondrial membrane potential is a therapeutic vulnerability in Dnmt3a-mutant clonal hematopoiesis

Affiliations

Elevated mitochondrial membrane potential is a therapeutic vulnerability in Dnmt3a-mutant clonal hematopoiesis

Kira A Young et al. Nat Commun. .

Abstract

The competitive advantage of mutant hematopoietic stem and progenitor cells (HSPCs) underlies clonal hematopoiesis (CH). Drivers of CH include aging and inflammation; however, how CH-mutant cells gain a selective advantage in these contexts is an unresolved question. Using a murine model of CH (Dnmt3aR878H/+), we discover that mutant HSPCs sustain elevated mitochondrial respiration which is associated with their resistance to aging-related changes in the bone marrow microenvironment. Mutant HSPCs have DNA hypomethylation and increased expression of oxidative phosphorylation gene signatures, increased functional oxidative phosphorylation capacity, high mitochondrial membrane potential (Δψm), and greater dependence on mitochondrial respiration compared to wild-type HSPCs. Exploiting the elevated Δψm of mutant HSPCs, long-chain alkyl-TPP molecules (MitoQ, d-TPP) selectively accumulate in the mitochondria and cause reduced mitochondrial respiration, mitochondrial-driven apoptosis and ablate the competitive advantage of HSPCs ex vivo and in vivo in aged recipient mice. Further, MitoQ targets elevated mitochondrial respiration and the selective advantage of human DNMT3A-knockdown HSPCs, supporting species conservation. These data suggest that mitochondrial activity is a targetable mechanism by which CH-mutant HSPCs gain a selective advantage over wild-type HSPCs.


Conflict of interest statement

Competing interests: A.D.S. has received research funding from Takeda Pharmaceuticals, BMS and Medivir AB, and consulting fees/honorarium from Takeda, Novartis, Jazz, and Otsuka Pharmaceuticals. A.D.S. is named on a patent application for the use of DNT cells to treat AML. A.D.S. is a member of the Medical and Scientific Advisory Board of the Leukemia and Lymphoma Society of Canada. S.M.C. has received research funding from the Centre for Oncology and Immunology in Hong Kong, Celgene/BMS, AbbVie Pharmaceuticals, Agios Pharmaceuticals, and Servier Laboratories. M.R.M. is on the Scientific Advisory Board for Peptone and performed consultancy for Nuage Therapeutics. G.A.C. has performed consulting and received research funding from Incyte, Ajax Therapeutics and ReNAgade Therapeutics Management, and is a co-founder, member of the scientific advisory board and shareholder of Pairidex, Inc. J.J.T. has received research funding from H3 Biomedicine, Inc and patent royalties from Fate Therapeutics. The remaining authors declare no competing financial interests.

Figures

Fig. 1
Fig. 1. Dnmt3aR878H/+ enhances oxidative phosphorylation in HSPCs.
A Experimental design. B, C Frequency of donor-derived (CD45.2+) cells in peripheral blood (B), frequency of hematopoietic stem cells (HSCs) in CD45.2+ bone marrow at 28 weeks post-transplant (c, left) and total number of CD45.2+ HSCs in BM (C, right) of recipient mice. Symbols represent mean ± SEM, bars represent mean ± SEM with points from biological replicate mice (n = 5 control into Igf1 + /+, n = 4 control into Igf1−/−, n = 8 R878H/+ into Igf1 + /+, n = 7 R878H/+ into Igf1−/−). Statistical analyses used two-way ANOVA with Tukey’s multiple comparisons test (B) or Brown-Forsythe and Welch one-way ANOVA (C). D Experimental design. e Oxygen consumption rate plot (left) used to quantify basal and maximal respiration (right) and (F), spare respiratory capacity in control and Dnmt3aR878H/+ HSPCs with and without IGF1. E, F Symbols represent mean ± SEM, bars represent mean ± SEM with points from biological replicate mice (n = 4). Statistical analyses used two-way ANOVA with Sidak’s multiple comparisons test (E) or one-way ANOVA with Tukey’s multiple comparisons test (F). G OCR plot (left) used to quantify basal and maximal respiration (right) and (H), spare respiratory capacity in control and Dnmt3aR878H/+ HSPCs after 16 h in vitro culture. G, H Symbols represent mean ± SEM, bars represent mean ± SEM with points from biological replicate mice (n = 4). Statistical analyses used two-way ANOVA with Sidak’s multiple comparisons test (G) or one-way ANOVA with Tukey’s multiple comparisons test (H). I Extracellular acidification rate plot of control and Dnmt3aR878H/+ HSPCs after 16 h in vitro culture. Symbols represent mean ± SEM from biological replicate mice (n = 3). J Experimental design. K OCR profile plot (left) used to quantify basal and maximal respiration (right) and (l), spare respiratory capacity in de novo control and Dnmt3aR878H/+ HSPCs. K, L Symbols represent mean ± SEM, bars represent mean ± SEM with points from biological replicate mice (n = 4). Statistical analyses used two-way ANOVA with Sidak’s multiple comparisons test (K) and unpaired two-tailed t test with Welch’s correction (l). Source data are provided as a Source Data file.
Fig. 2
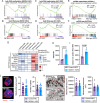
Fig. 2. DNA hypomethylation and increased expression of electron transport chain machinery and elevated mitochondrial membrane potential in Dnmt3a-mutant HSPCs.
AF Enrichment analysis of an oxidative phosphorylation gene signature in DNA methylation data (A, C, E) and RNA-seq data (B, D, F) comparing Dnmt3aR878H/+ vs. control HSC (A, B), Dnmt3a KO versus control HSC (C, D), DNMT3AR882 CD34+ cells versus DNMT3A+/+ CD34+ cells (E, F). Includes data from Jeong et al and Nam et al.. G DNA methylation and expression heatmap of oxidative phosphorylation genes in Dnmt3a-KO and Dnmt3aR878H/+ BM and HSCs. Includes data from Li et al and Jeong et al.. H TMRE mean fluorescence intensity in control and Dnmt3aR878H/+ HSCs. Bars represent mean ± SEM with points from biological replicate mice (n = 6). Statistical analysis used unpaired, two-tailed t test. I Calcium ion uptake in control and Dnmt3aR878H/+ HSCs. Bars represent mean ± SEM with points from biological replicate mice (n = 4). Statistical analysis used unpaired, two-tailed t test. J Representative images (left) of control and Dnmt3aR878H/+ HSCs stained with TOM20 (red) and DAPI (blue). Scale bar denotes 2 μm. Mitochondrial volume (center) and mitochondrial number (right) in control and Dnmt3aR878H/+ HSCs. Bars represent mean ± SEM with data points from biological replicate HSCs (n = 30) from three mice per genotype. Statistical analysis used unpaired, two-tailed t test. K Representative transmission electron microscopy images (left) of control and Dnmt3aR878H/+ HSPCs. Scale bar denotes 0.5 μm. Red squares denote zoomed region. Mitochondrial area (center) and mitochondrial cristae area (right) in control and Dnmt3aR878H/+ HSPCs. Bars represent mean ± SEM with points are from biological replicate HSPCs (n = 23 control HSPC, n = 32 R878H/ + HSPC) from three mice per genotype. Statistical analysis used unpaired, two-tailed t test. Source data are provided as a Source Data file.
Fig. 3
Fig. 3. Mouse and human Dnmt3a-mutant HSPCs are sensitive to electron transport chain inhibitors.
A Quantification of puromycin incorporation in control and Dnmt3aR878H/+ HSCs treated with vehicle control (DMSO), 2-deoxygluocse (2-DG), oligomycin (Oligo) or 2-DG + Oligo using SCENITH assay. Bars represent mean ± SEM with points from biological replicate mice (n = 5 DMSO, n = 5 2-DG, n = 5 Oligo, n = 6 2-DG+Oligo). Statistical analyses used two-way ANOVA with Tukey’s multiple comparisons test. B Quantification of metabolic function in control and Dnmt3aR878H/+ HSCs after treatment with MitoQ using SCENITH assay. Bars represent mean ± SEM with points from biological replicate mice (n = 4 DMSO, n = 7 MitoQ). Statistical analyses used two-way ANOVA with Dunnett’s multiple comparisons test. C Experimental design. D OCR profile plot (left) used to quantify basal and maximal respiration (right) and (E), spare respiratory capacity. D, E Symbols represent mean ± SEM, bars represent mean ± SEM with points from biological replicate mice (n = 4). Statistical analyses used two-way ANOVA with Tukey’s multiple comparisons test (D) and one-way ANOVA with Tukey’s multiple comparisons test (E). F Experimental design. G OCR profile plot (left) used to quantify basal and maximal respiration (right) and (H), spare respiratory capacity. FH Symbols represent mean ± SEM, bars represent mean ± SEM with points from biological replicates (n = 4). Statistical analyses used two-way ANOVA with Tukey’s multiple comparisons test (G) and one-way ANOVA with Fisher’s LSD (H). Source data are provided as a Source Data file.
Fig. 4
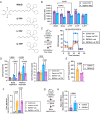
Fig. 4. Dnmt3aR878H/+ HSPCs have greater uptake and accumulation of long-chain alkyl-TPP molecules.
A Chemical structures of TPP+ derivatives MitoQ, d-TPP, h-TPP and m-TPP. Created in BioRender: https://BioRender.com/j69r060. B Quantification of puromycin incorporation in control and Dnmt3aR878H/+ HSCs treated with vehicle control (DMSO), MitoQ, d-TPP, h-TPP, or m-TPP. Bars represent mean ± SEM, points from biological replicate mice (n = 7 Control DMSO, n = 6 R878H/ + DMSO, n = 5 Control MitoQ, n = 6 R878H/+ MitoQ, n = 5 Control d-TPP, n = 6 R878H/+ d-TPP, n = 3 Control h-TPP, n = 3 R878H/+ h-TPP, n = 3 Control m-TPP, n = 3 R878H/+ m-TPP). Statistical analysis used two-way ANOVA with Dunnett’s multiple comparisons test. C Experimental design (left) and OCR plot (right) used to quantify (D), basal and maximal respiration (left) and spare respiratory capacity (right) in d-TPP treated control and Dnmt3aR878H/+ HSPCs. E Quantification of d-TPP induced ECAR in d-TPP treated control and Dnmt3aR878H/+ HSPCs. F Proton-leak driven respiration in d-TPP treated control and Dnmt3aR878H/+ HSPCs. DF Bars represent mean ± SEM, points are from biological replicate mice (n = 4). Statistical analyses used two-way ANOVA with Sidak’s multiple comparisons test (D, left), one-way ANOVA with Tukey’s multiple comparisons test (D, right, F), and unpaired, two-tailed t test (E). G Experimental design. H Ratio of MitoQ in the mitochondria vs. cytoplasm of control and Dnmt3aR878H/+ HSPCs. Bars represent mean ± SEM, points from biological replicate mice (n = 4). Statistical analysis used ratio paired, two-tailed t test. Source data are provided as a Source Data file.
Fig. 5
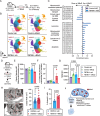
Fig. 5. MitoQ induces activation of the mitochondrial apoptotic pathway selectively in Dnmt3aR878H/+ HSPCs.
A Experimental design for single-cell RNA-seq from biological replicate mice (n = 4). B UMAP plots of scRNA-seq showing 9 cell clusters from a total of 134,844 cells. C Negative and positive enrichment of gene ontology terms in control and Dnmt3aR878H/+ HSCs treated with MitoQ vs. vehicle. D Experimental design. E Quantification of loss of calcein retention in control and Dnmt3aR878H/+ HSCs treated with MitoQ vs. vehicle. F Quantification of JC-1 exclusion in control and Dnmt3aR878H/+ HSC treated with MitoQ vs. vehicle. E, F Bars represent mean ± SEM, points from biological replicate mice (n = 4). Statistical analyses used one-way ANOVA with Sidak’s multiple comparisons test. G Quantification of mitochondrial membrane potential in control and Dnmt3aR878H/+ HSC treated with MitoQ vs. vehicle. Bars represent mean ± SEM, points from biological replicate mice (n = 3). Statistical analysis used one-way ANOVA with Sidak’s multiple comparisons test. H Representative images (left) of Dnmt3aR878H/+ HSPCs treated with MitoQ or vehicle using TEM. Scale bar denotes 0.5 μm. Red squares denote zoomed area. Quantification of mitochondrial cristae width (right) in Dnmt3aR878H/+ HSPCs treated with MitoQ or vehicle. Bars represent mean ± SEM, points from biological replicate HSPCs (n = 32 R878H/+ veh, n = 35 R878H/+ +MitoQ) from three mice per genotype. Statistical analysis used unpaired, two-tailed t test. I Frequency of AnnexinV+ Dnmt3aR878H/+ HSPCs after treatment with MitoQ or vehicle. Bars represent mean ± SEM, points from biological replicate mice (n = 3). Statistical analysis used unpaired, two-tailed t test. J Model of MitoQ uptake in Dnmt3aR878H/+ HSPCs leading to increased permeability transition pore, increased swelling, depolarization, decreased MMP, cytochrome C release and apoptosis. Created in Biorender: https://BioRender.com/m381057. Source data are provided as a Source Data file.
Fig. 6
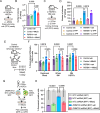
Fig. 6. Long-chain alkyl-TPP molecules ablate the competitive advantage of mouse and human Dnmt3a-mutant HSPCs and their progeny.
A Experimental design. B Number of myeloid CFU in secondary plating of control and Dnmt3aR878H/+ BM cells. Bars represent mean ± SEM, points from biological replicate mice (n = 5 control veh, n = 5 control +MitoQ, n = 6 R878H/+ veh, n = 6 R878H/+ +MitoQ). Statistical analysis used one-way ANOVA with Sidak’s multiple comparisons test. C Experimental design. D Number of myeloid CFU in secondary plating of control and Dnmt3aR878H/+ BM cells. Bars represent mean ± SEM, points from biological replicate mice (n = 3). Statistical analysis used one-way ANOVA with Sidak’s multiple comparisons test. E Experimental design. F Frequency of donor-derived tdTomato+ CD45.2+ cells in PB, BM and HSPCs of control and Dnmt3aR878H/+ recipient mice after treatment with MitoQ. Bars represent mean ± SEM, points from biological replicate mice (n = 11 control veh, n = 5 control +MitoQ, n = 10 R878H/+ veh, n = 5 R878H/+ +MitoQ). The transplant was performed 3 independent times. Statistical analysis used two-way ANOVA with Fisher’s LSD test. G Experimental design. H Frequency of DNMT3A-knockdown human CD34+ cells after 14 days of MitoQ treatment. Bars represent mean ± SEM, points are from one human sample with technical replicates (n = 6). Statistical analysis used two-way ANOVA with Tukey’s multiple comparisons test. Source data are provided as a Source Data file.

References

    1. Fuster, J. J. & Walsh, K. Somatic Mutations and Clonal Hematopoiesis: Unexpected Potential New Drivers of Age-Related Cardiovascular Disease. Circ. Res.122, 523–532 (2018). - PMC - PubMed
    1. Genovese, G. et al. Clonal hematopoiesis and blood-cancer risk inferred from blood DNA sequence. N. Engl. J. Med.371, 2477–2487 (2014). - PMC - PubMed
    1. Xie, M. et al. Age-related mutations associated with clonal hematopoietic expansion and malignancies. Nat. Med.20, 1472–1478 (2014). - PMC - PubMed
    1. Jaiswal, S. et al. Age-related clonal hematopoiesis associated with adverse outcomes. N. Engl. J. Med.371, 2488–2498 (2014). - PMC - PubMed
    1. Wang, H. et al. Clonal hematopoiesis driven by mutated DNMT3A promotes inflammatory bone loss. Cell187, 3690–3711.e3619 (2024). - PMC - PubMed

MeSH terms

Substances

Grants and funding

LinkOut - more resources