. 2025 Apr;14(4):e70069.
doi: 10.1002/jev2.70069.

Nanobody Engineered and Photosensitiser Loaded Bacterial Outer Membrane Vesicles Potentiate Antitumour Immunity and Immunotherapy

Affiliations

Nanobody Engineered and Photosensitiser Loaded Bacterial Outer Membrane Vesicles Potentiate Antitumour Immunity and Immunotherapy

Peng Xia et al. J Extracell Vesicles. 2025 Apr.

Abstract

Bacterial outer membrane vesicles (OMVs) are promising as antitumour agents, but their clinical application is limited by toxicity concerns and unclear mechanisms. We engineered OMVs with cadherin 17 (CDH17) tumour-targeting nanobodies, enhancing tumour selectivity and efficacy while reducing adverse effects. These engineered OMVs function as natural stimulator of interferon genes (STING) agonists, activating the cyclic GMP-AMP synthase (cGAS)-STING pathway in cancer cells and tumour-associated macrophages (TAMs). Loading engineered OMVs with photoimmunotherapy photosensitisers further enhanced tumour inhibition and STING activation in TAMs. Combining nanobody-engineered OMV-mediated photoimmunotherapy with CD47 blockade effectively suppressed primary and metastatic tumours, establishing sustained antitumour immune memory. This study demonstrates the potential of nanobody-engineered OMVs as STING agonists and provides insights into novel OMV-based immunotherapeutic strategies harnessing the innate immune system against cancer. Our findings open new avenues for OMV applications in tumour immunotherapy, offering a promising approach to overcome current limitations in cancer treatment.

Keywords: CDH17; STING pathway; bacterial outer membrane vesicle; nanobody; photoimmunotherapy; tumour‐associated macrophages.


Conflict of interest statement

The authors declare no conflicts of interest.

Figures
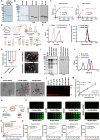
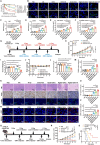
FIGURE 1
FIGURE 1
Preparation and characterisation of CDH17 nanobody engineered OMVs. (A) SDS‐PAGE gel analysis of purified human (H) and murine (M) CDH17 Domains 1–3. (B) Purified control (Con‐Nb) and Nb289 were confirmed with VHH and HA tag antibodies by western blot. (C) Binding activity of Nb289 to human and murine CDH17 determined by ELISA (n = 3). (D) Nanobody (Nb)‐OMV isolation procedure. (E) Flow cytometry analysis of Nb‐engineered MG1655 using fluorescein isothiocyanate (FITC)‐labelled HA antibody (n = 3). (F) Average particle size of Nb‐OMVs measured by nanoparticle tracking analysis (NTA). (G) Zeta potentials of Nb‐OMVs determined by NTA (n = 3). (H) Representative images of Nb‐OMVs visualised by transmission electron microscopy (TEM). Scale bars, 40 nm. (I) Detection of Nb‐OMVs by western blot using VHH and HA antibodies. (J) Surface expression of Nbs in engineered OMVs analysed by nanoflow cytometry using an FITC‐labelled HA antibody. (K) Visualisation of engineered OMVs using HA magnetic beads by immunoelectron microscopy. Red and black arrows indicate the OMVs and the HA magnetic beads attached to the OMVs, respectively. Scale bars, 100 nm. (L) Fluorescent western blot analysis of increasing concentrations of Nbs and engineered OMVs using IRDye 680RD‐conjugated anti‐rabbit IgG (n = 3). (M) Standard curve established based on the fluorescent intensity–concentration correlation (black dots) from (L) and the determination copy number of displayed Nbs per OMV (blue and red dots). (N) Schematic diagram of ELISA and in‐cell ELISA to measure Nb‐OMVs binding. (O) Binding activity of Nb289‐OMVs to CDH17 determined by ELISA (n = 3). (P) Binding activity of Nb289‐OMVs to CDH17 determined by in‐cell ELISA (n = 3). (Q) Statistical results of (P). Data are represented as mean ± SD. Statistical significance was calculated using two‐tailed unpaired t test analysis (G) or two‐way ANOVA with Tukey's posttest (C, O, Q). ns, no significance. *p < 0.05, **p < 0.01 and ***p < 0.001. ANOVA, analysis of variance; CDH17, cadherin 17; ELISA, enzyme‐linked immunosorbent assay; OMV, outer membrane vesicle; SD, standard deviation.
FIGURE 2
FIGURE 2
Nanobodies engineered onto OMVs improve the tumour homing ability and safety profile of OMV‐based tumour therapies. (A) Immunofluorescence analysis of CDH17‐associated cancer cells with PKH67‐labelled Nb‐OMVs (green). Scale bars, 10 µm. (B) Quantification of immunofluorescence intensity in (A). (C) Internalisation analysis of Nb‐OMVs in cancer cells overexpressing or lacking CDH17. Scale bars, 25 µm (n = 3). (D) OMVs treatment schedule. Colon26 tumour‐bearing mice were treated with PBS (200 µL), OMV‐High (1 × 1012 particles/injection), OMV‐Low (1 × 1011 particles/injection), Nb289‐OMV‐High (1 × 1012 particles/injection) or Nb289‐OMV‐Low (1 × 1011 particles/injection) injected via the tail vein at the indicated timepoints. (E) Survival rates of mice treated with different doses of nonengineered or engineered OMVs (n = 5). (F) Incidence of diarrhoea in OMV‐treated mice (n = 5). (G) Tumour weight at the end of the experiment (n = 5). (H) Tumour growth curves of different treatment groups (n = 5). (I) In vivo tumour imaging to determine the tumour targeting efficiency of IR700@Nb289‐OMVs (corresponding IR700 dose: 100 µg in each group; n = 3). Colon26 tumour‐bearing mice were imaged at four time points (n = 3). (J) Quantification of tumour fluorescence intensity in (I). (K) Ex vivo imaging of major organs and tumours collected from mice in (I). (L) Quantification of fluorescence intensity of the various organs in (K) (n = 3). (M) Nb‐OMV detection via VHH antibody binding in tumour tissues dissected from mice in (K) (n = 3). (N) Quantification of Nb‐OMV fluorescence intensity in (M). (O) Distribution of Nb289‐OMVs in the main organs after 24 h circulation (n = 3). The data are presented as mean ± SD. Statistical significance was calculated using two‐tailed unpaired t test analysis (B) or one‐way ANOVA with Tukey's post‐test (G, N) or two‐way ANOVA (H, J, L). *p < 0.05, **p < 0.01 and ***p < 0.001. ANOVA, analysis of variance; CDH17, cadherin 17; OMV, outer membrane vesicle; SD, standard deviation.
FIGURE 3
FIGURE 3
IR700‐loaded nanobody‐engineered OMVs effectively inhibit the growth of colorectal and pancreatic tumours in mice. (A) Viability of Colon26 cells measured by CCK‐8 assay upon treatment with PBS (200 µL), NIR (20 J/cm2), IR700 (10 µg/mL), IR700 (10 µg/mL) + NIR (20 J/cm2), Nb289‐OMVs (1 × 1010 particles/mL), IR700@Nb289‐OMVs (1 × 1010 particles/mL) and IR700@Nb289‐OMVs (1 × 1010 particles/mL) + NIR (20 J/cm2) (n = 3 per treatment). (B) Immunofluorescent analysis of translocated CRT and ERp57 in Colon26 cancer cells upon the same treatments as in (A). (C) Quantification of fluorescence intensity of CRT surface expression in (B). (D) Quantification of fluorescence intensity of ERp57 translocation in (B). (E, F) Quantification of ATP (E) and HMGB1 (F) released from Colon26 cancer cells after the indicated treatments (n = 3). (G) Treatment schedule of Colon26 tumour‐bearing mice with PBS (200 µL), NIR (50 J/cm2), IR700 (100 µg), IR700 (100 µg) + NIR (50 J/cm2), Nb289‐OMVs (1 × 1011 particles/injection), IR700@Nb289‐OMVs (1 × 1011 particles/injection) or IR700@Nb289‐OMVs (1 × 1011 particles/injection) + NIR (50 J/cm2). (H) Growth curves of Colon26 tumours upon treatment (n = 5). (I) Tumour weight at the end of the experiment upon different treatments (n = 5). (J) Body weight changes of mice during the treatment period (n = 5). (K) H&E, Ki67 and TUNEL staining of tumours from the different treatment groups (n = 5). (L) Quantification of Ki67‐positive cells in tumour samples. (M) Quantification of TUNEL staining in (L). (N) Immunofluorescent staining for the detection of CRT and ERp57 in cell membranes (n = 5). (O, P) Quantification of surface‐expressed CRT (O) and ERp57 (P) in (N). (Q) Treatment schedule of Panc02 tumour‐bearing mice with PBS (200 µL), IR700 (100 µg) + NIR (50 J/cm2), Nb289‐OMVs (1 × 1011 particles/injection) or IR700@Nb289‐OMVs (1 × 1011 particles/injection) + NIR (50 J/cm2). (R) Growth curves of Panc02 tumours upon treatment (n = 5). (S) Survival curves of Panc02 tumour‐bearing mice in different treatment groups (n = 5). The data are presented as mean ± SD. Statistical significance was calculated using two‐way ANOVA (A, H, J, R) or one‐way ANOVA with Tukey's post‐test (C–F, I, L, M, O, P) or Mantel–Cox test (S). *p < 0.05, **p < 0.01 and ***p < 0.001. ANOVA, analysis of variance; CRT, calreticulin; ERp57, endoplasmic reticulum protein 57; H&E, haematoxylin and eosin; NIR, near‐infrared; OMV, outer membrane vesicle; PBS, phosphate buffered saline; SD, standard deviation.
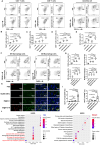
FIGURE 4
FIGURE 4
IR700@Nb289‐OMVs‐mediated photoimmunotherapy reprograms the TME. (A) Flow cytometry analysis of CD4+ T, CD8+ T and dendritic cells (DCs) in tumour tissues following treatment with PBS (200 µL), Nb289‐OMVs (1 × 1011 particles/injection), IR700@Nb289‐OMVs (1 × 1011 particles/injection) or IR700@Nb289‐OMVs (1 × 1011 particles/injection) + NIR (50 J/cm2) (n = 5 per treatment). The tissue samples were collected after three cycles of treatment. (B–E) Quantification of total T (CD3+), CD4+ T, CD8+ T and mature DCs within the tumours in (A). (F) Flow cytometry analysis of total and polarised Mφ (M1 and M2) in tumour tissues following different treatments (n = 5). (G) Quantification of total Mφ (F4/80+), M1 (F4/80+CD86+), M2 (F4/80+CD206+) and the ratio of M1/M2 in (F). (H) Expression and colocalisation of Iba1 and F4/80+ Mφ in tumour tissues after various treatments detected by immunofluorescence (n = 5). Scale bars, 20 or 10 µm as indicated. (I) Quantification for F4/80+ Mφ and Iba1+ staining. (J) KEGG pathway enrichment analysis of the upregulated and downregulated genes (n = 3). Enriched upregulated (left) and downregulated (right) pathways are shown. Data are presented as mean ± SD. Statistical significance was calculated using one‐way ANOVA with Tukey's post‐test (B–E, G, I). *< 0.05, **< 0.01 and ***< 0.001. ANOVA, analysis of variance; NIR, near‐infrared; KEGG, Kyoto Encyclopedia of Genes and Genomes; OMV, outer membrane vesicle; PBS, phosphate buffered saline; SD, standard deviation; TME, tumour microenvironment.
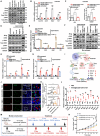
FIGURE 5
FIGURE 5
cGAS‐STING pathway is crucial for Nb289‐OMVs and IR700@Nb289‐OMVs‐initated tumour suppression. (A) Western blot analysis of the STING pathway in cancer cells treated overnight with PBS, Nb289‐OMVs (1 × 1010 particles/mL) or Nb289‐OMVs (1 × 1010 particles/mL) + H151 (2 µM). (B) mRNA expression of STING pathway downstream genes in Colon26 cells treated with Nb289‐OMVs alone or in combination with H151 (n = 3). (C) Changes in ATP and HMGB1 release in Colon26 cancer cells treated with Nb289‐OMVs alone or in combination with H151 (n = 3). (D) Assessment of the STING pathway in macrophages treated with preconditioned supernatants collected from Colon26 cells upon the indicated treatments (Ctrl + N: PBS plus NIR irradiation alone; IR@N‐O: IR700@Nb289‐OMVs alone; IR@N‐O + N: combo IR700@Nb289‐OMVs plus NIR irradiation) (n = 3). (E) mRNA expression of STING pathway downstream genes in macrophages upon the indicated treatments (n = 3). (F) Western blot analysis of the STING pathway in macrophages treated with various preconditioned supernatants containing DNase I or H151 (n = 3). (G, H) mRNA expression of STING pathway downstream genes in macrophages treated with various preconditioned supernatants containing DNase I or H151 as described in (E) (n = 3). (I) Schematic diagram of the activation of the STING pathway by Nb289‐OMVs or IR700@Nb289‐OMVs plus NIR. (J) Immunofluorescence analysis of p‐IRF3 and F4/80 marker in tumour tissues after various OMV‐related treatments. The inlets show the colocalisation of p‐IRF3 and F4/80+ Mφ. (K) Quantification of total expression of p‐IRF3 and the colocalisation of p‐IRF3 and F4/80+ Mφ for (J). (L) Relative expression of ISGs in tumours after treatment with IR700@Nb289‐OMVs plus NIR (n = 5). (M) Treatment schedule for macrophage depletion and STING inhibition in tumour‐bearing mice treated with PBS, IR700@Nb289‐OMVs (1 × 1011 particles/injection) + NIR (50 J/cm2) + clodronate (200 µL, 5 mg/mL, peritumoural injection for 7 consecutive days), IR700@Nb289‐OMVs (1 × 1011 particles/injection) + NIR (50 J/cm2) + H151 (10 mg/kg, intraperitoneal injection for 7 consecutive days) and IR700@Nb289‐OMVs (1 × 1011 particles/injection) + NIR (50 J/cm2) (n = 5 per group). (N) Tumour growth curves upon the indicated treatments coupled with macrophage depletion and STING inhibition (n = 5 per treatment). Data are presented as mean ± SD. Statistical significance was calculated using two‐tailed unpaired t test analysis (L) or one‐way ANOVA with Tukey's post‐test (B, C, E, G, H, K) or two‐way ANOVA (N). *p < 0.05, **p < 0.01 and ***p < 0.001. ANOVA, analysis of variance; cGAS, cyclic GMP‐AMP synthase; HMGB1, high‐mobility group B1; NIR, near‐infrared; OMV, outer membrane vesicle; PBS, phosphate buffered saline; SD, standard deviation; STING, stimulator of interferon genes; TME, tumour microenvironment.
FIGURE 6
FIGURE 6
One cycle of engineered OMVs‐mediated photoimmunotherapy significantly augments the antitumour efficacy of immune checkpoint blockade therapies. (A) Schematic representation of the combo treatment schedule with PBS (200 µL), PD‐1 antibodies (12.5 mg/kg)/Nb‐CD47 (10 mg/kg), IR700@Nb289‐OMVs (1 × 1011 particles/injection) + NIR (50 J/cm2), and IR700@Nb289‐OMVs (1 × 1011 particles/injection) + NIR (50 J/cm2) + PD‐1 antibodies (12.5 mg/kg)/Nb‐CD47 (10 mg/kg). The mice were treated with NIR for one cycle, followed by two injections of PD‐1 antibodies or Nb‐CD47 (n = 5 per group). (B) Sizes of the tumours collected at the end of the experiment with PD‐1 antibodies (n = 5). (C) Tumour growth curves under various treatments regiments with the PD‐1 antibody (n = 5). (D) Individual tumour growth curves at the end of the experiment with the PD‐1 antibody (n = 5). (E) Tumour weights of the different treatment groups with the PD‐1 antibody (n = 5). (F) Survival analysis of tumour‐bearing mice receiving OMV‐based photoimmunotherapy and/or PD‐1 antibody (n = 5). (G) H&E, Ki67 and TUNEL staining of the tumours from (B) (n = 5). (H) Tumour appearance at the end of the experiment with the CD47 nanobodies (n = 5). (I) Tumour growth curves for various treatments with the CD47 nanobodies (n = 5). (J) Individual tumour growth curves at the end of the experiment with the CD47 nanobodies (n = 5). (K) Tumour weights of the different groups with the CD47 nanobodies from (H) (n = 5). (L) Survival analysis of the tumour‐bearing mice receiving OMV‐based photoimmunotherapy and/or CD47 nanobodies (n = 5). (M) H&E, Ki67 and TUNEL staining of the tumours from (H) (n = 3–5). (N) Changes in the macrophage populations within the TME at the end of the experiment were determined by flow cytometry (n = 5). Three days after the end of the treatment, the tumour tissues were collected for flow cytometry analysis. Data are presented as mean ± SD. The data are presented as mean ± SD. Statistical significance was calculated using one‐way ANOVA with Tukey's post‐test (E, K, N) or two‐way ANOVA (C, I) or Mantel–Cox test (G, M). *p < 0.05, **p < 0.01 and ***p < 0.001. ANOVA, analysis of variance; H&E, haematoxylin and eosin; OMV, outer membrane vesicle; PBS, phosphate buffered saline; SD, standard deviation; TME, tumour microenvironment.
FIGURE 7
FIGURE 7
Engineered OMVs‐mediated photoimmunotherapy with CD47 nanobody synergistically inhibits the progression of metastatic CRC and elicits sustained immune memory. (A) Schematic representation of the combination treatment schedule with PBS (200 µL), IR700@Nb289‐OMVs (1 × 1011 particles/injection) + NIR (50 J/cm2), Nb‐CD47 (10 mg/kg) and IR700@Nb289‐OMVs (1 × 1011 particles/injection) + NIR (50 J/cm2) + Nb‐CD47 (10 mg/kg). Mice were treated with NIR irradiation for one cycle, followed by two injections of Nb‐CD47. (B) Bioluminescence imaging of abdominal metastatic colorectal tumours with various treatments (n = 5). (C) Quantification of bioluminescent signals to estimate abdominal metastatic tumour burden. (D) Survival curves of abdominal metastatic tumour‐bearing mice receiving different treatments (n = 5). (E) Bioluminescence imaging of metastatic lung colorectal tumours treated with various regimens (n = 5). (F) Quantification of the bioluminescent signal to estimate the lung metastatic tumour burden (n = 5). (G) Survival curves for lung metastatic tumour‐bearing mice upon different treatment regimens (n = 5). (H) Tumour growth curves for mice rechallenged with Colon26‐Luc cancer cells 90 days after tumour eradication (n = 5). (I) Flow cytometry analysis of effector memory T cells (CD62LCD44+) in the spleens of rechallenged or age‐matched control mice at the end of the experiment (n = 5). (J) Flow cytometry analysis of central memory T cells (CD62L+CD44+) in the spleens of rechallenged or age‐matched control mice at the end of the experiment (n = 5). Data are presented as mean ± SD. Statistical significance was calculated using two‐tailed unpaired t test analysis (I, J) or two‐way ANOVA (H) or Mantel–Cox test (D, J). *< 0.05, **< 0.01 and ***< 0.001. ANOVA, analysis of variance; CRC, colorectal; NIR, near‐infrared; OMV, outer membrane vesicle; PBS, phosphate buffered saline; SD, standard deviation; TME, tumour microenvironment.

Similar articles

References

    1. Ahn, J. , Xia T., Rabasa Capote A., Betancourt D., and Barber G. N.. 2018. “Extrinsic Phagocyte‐Dependent STING Signaling Dictates the Immunogenicity of Dying Cells.” Cancer Cell 33: 862–873.e5. - PMC - PubMed
    1. Arnold, M. , Abnet C. C., Neale R. E., et al. 2020. “Global Burden of 5 Major Types of Gastrointestinal Cancer.” Gastroenterology 159: 335–349.e15. - PMC - PubMed
    1. Bitto, N. J. , Chapman R., Pidot S., et al. 2017. “Bacterial Membrane Vesicles Transport Their DNA Cargo into Host Cells.” Scientific Reports 7: 7072. - PMC - PubMed
    1. Brown Harding, H. , Kwaku G. N., Reardon C. M., et al. 2024. “ Candida albicans Extracellular Vesicles Trigger Type I IFN Signalling via cGAS and STING.” Nature Microbiology 9: 95–107. - PMC - PubMed
    1. Chen, X. , Meng F., Xu Y., Li T., Chen X., and Wang H.. 2023. “Chemically Programmed STING‐Activating Nano‐Liposomal Vesicles Improve Anticancer Immunity.” Nature Communications 14: 4584. - PMC - PubMed

Grants and funding

LinkOut - more resources