

Combining machine learning and dynamic system techniques to early detection of respiratory outbreaks in routinely collected primary healthcare records
- PMID: 40241011
- PMCID: PMC12004868
- DOI: 10.1186/s12874-025-02542-0
Combining machine learning and dynamic system techniques to early detection of respiratory outbreaks in routinely collected primary healthcare records
Abstract
Background: Methods that enable early outbreak detection represent powerful tools in epidemiological surveillance, allowing adequate planning and timely response to disease surges. Syndromic surveillance data collected from primary healthcare encounters can be used as a proxy for the incidence of confirmed cases of respiratory diseases. Deviations from historical trends in encounter numbers can provide valuable insights into emerging diseases with the potential to trigger widespread outbreaks.
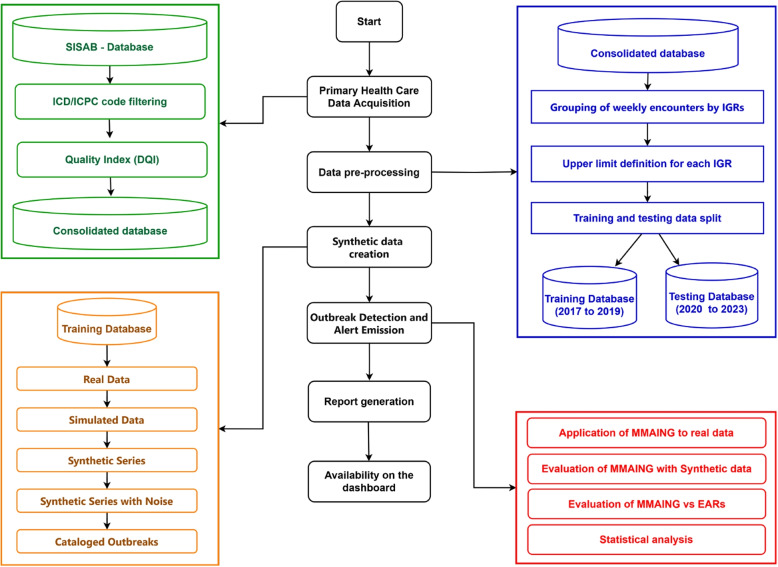
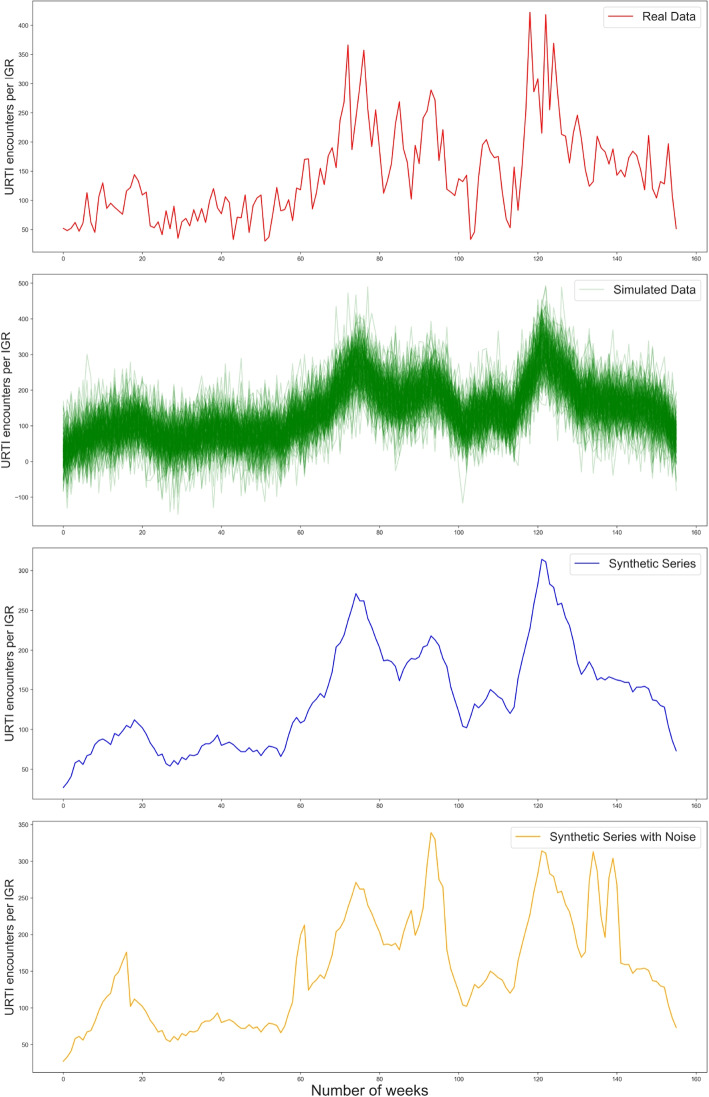
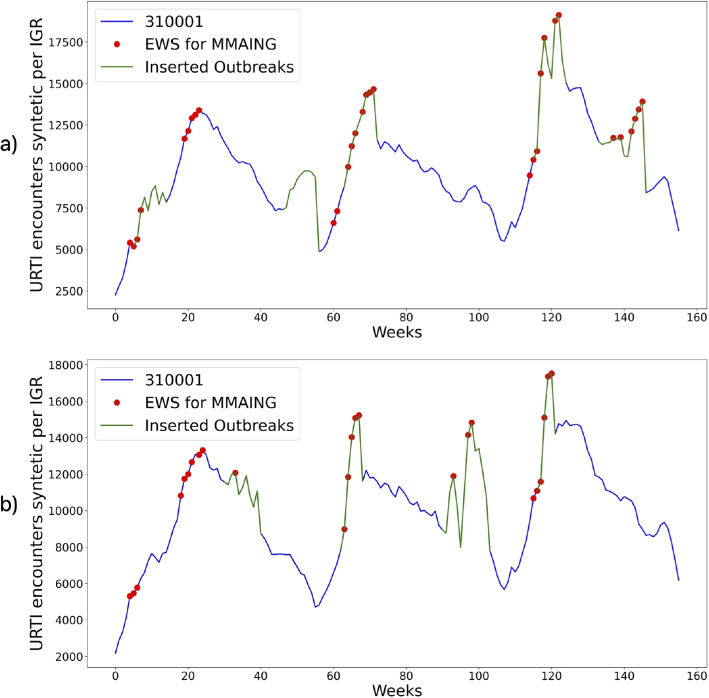
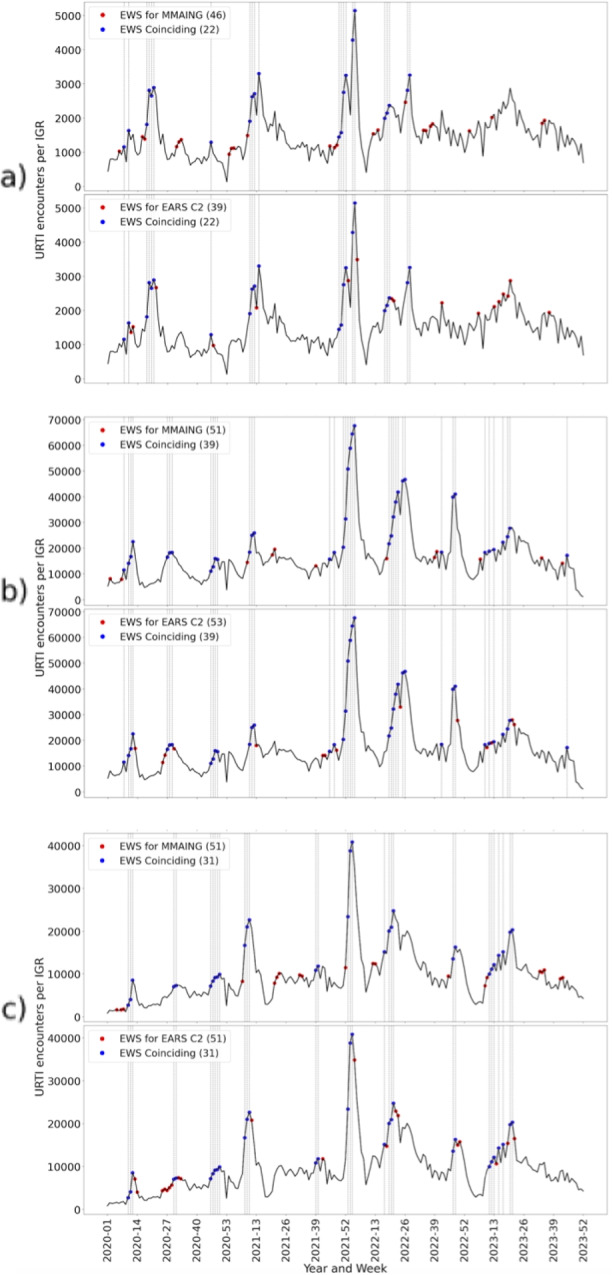
Methods: Unsupervised machine learning methods and dynamical systems concepts were combined into the Mixed Model of Artificial Intelligence and Next-Generation (MMAING) ensemble, which aims to detect early signs of outbreaks based on primary healthcare encounters. We used data from 27 Brazilian health regions, which cover 41% of the country's territory, from 2017-2023 to identify anomalous increases in primary healthcare encounters that could be associated with an epidemic onset. Our validation approach comprised (i) a comparative analysis across Brazilian capitals; (ii) an analysis of warning signs for the COVID-19 period; and (iii) a comparison with related surveillance methods (namely EARS C1, C2, C3) based on real and synthetic labeled data.
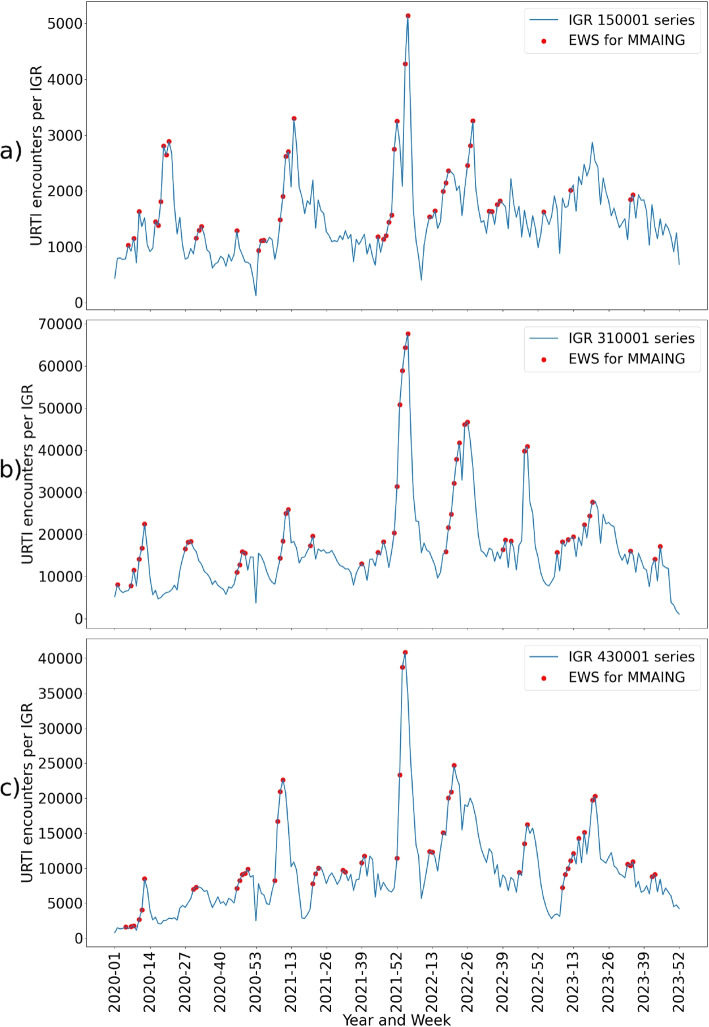
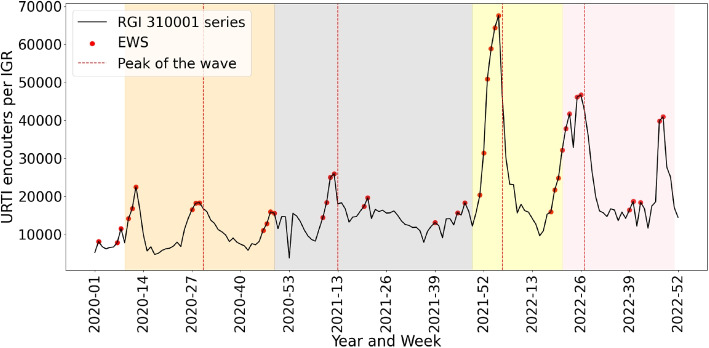
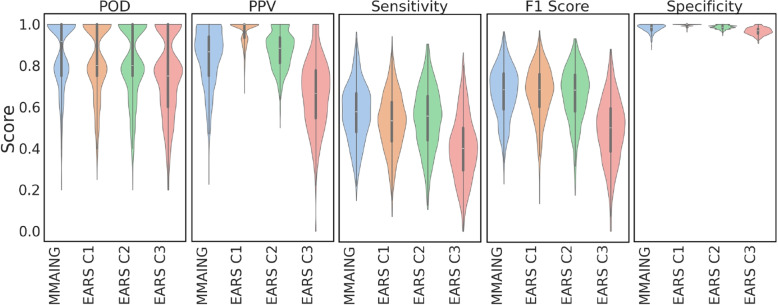
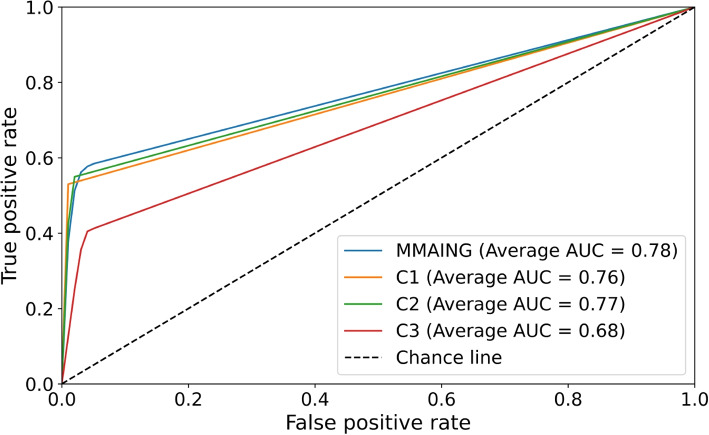
Results: The MMAING ensemble demonstrated its effectiveness in early outbreak detection using both actual and synthetic data, outperforming other surveillance methods. It successfully detected early warning signals in synthetic data, achieving a probability of detection of 86%, a positive predictive value of 85%, and an average reliability of 79%. When compared to EARS C1, C2, and C3, it exhibited superior performance based on receiver operating characteristic (ROC) curve results on synthetic data. When evaluated on real-world data, MMAING performed on par with EARS C2. Notably, the MMAING ensemble accurately predicted the onset of the four waves of the COVID-19 period in Brazil, further validating its effectiveness in real-world scenarios.
Conclusion: Identifying trends in time series data related to primary healthcare encounters indicated the possibility of developing a reliable method for the early detection of outbreaks. MMAING demonstrated consistent identification capabilities across various scenarios, outperforming established reference methods.
Keywords: Machine learning; Outbreak detection; Primary healthcare data; Reproduction number; Syndromic surveillance.
© 2025. The Author(s).
Conflict of interest statement
Declarations. Ethics approval and consent to participate: The study is based on secondary, aggregated, non-identified data, and was approved by the Ethical Review Board of Oswaldo Cruz Foundation - Fiocruz Bahia Regional Office, CAAE 61444122.0.0000.0040. Consent for publication: Not applicable. Competing interests: The authors declare no competing interests.
Figures
References
-
- Madhav N, Oppenheim B, Gallivan M, Mulembakani P, Rubin E, Wolfe N. 17. In: Pandemics: Risks, Impacts, and Mitigation. 2017. pp. 315–345. 10.1596/978-1-4648-0527-1_ch17. - PubMed
-
- Buehler JW, Hopkins RS, Overhage JM, Sosin DM, Tong V. Framework for evaluating public health surveillance systems for early detection of outbreaks: recommendations from the CDC Working Group. MMWR Recomm Rep. 2004;53(RR-5):1–11. - PubMed
-
- Farrington CP, Andrews NJ, Beale AD, Catchpole MA. A Statistical Algorithm for the Early Detection of Outbreaks of Infectious Disease. J R Stat Soc Ser A Stat Soc. 1996;159(3):547–63.
MeSH terms
Grants and funding
LinkOut - more resources
Full Text Sources
Medical
Miscellaneous
