. 2025 Apr 16;22(1):107.
doi: 10.1186/s12974-025-03435-1.

A central role for CCR2 in monocyte recruitment and blood-brain barrier disruption during Usutu virus encephalitis

Affiliations

A central role for CCR2 in monocyte recruitment and blood-brain barrier disruption during Usutu virus encephalitis

Emily Slowikowski et al. J Neuroinflammation. .

Abstract

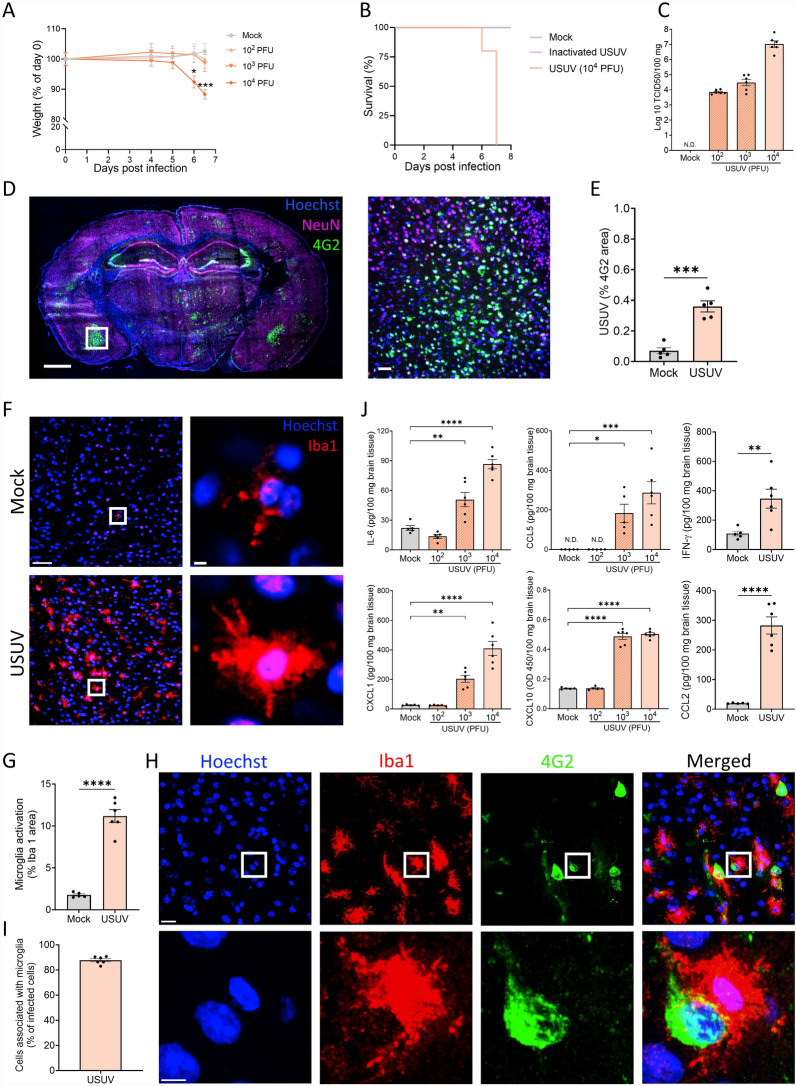
Usutu virus (USUV) is an emerging neurotropic flavivirus capable of causing encephalitis in humans. Here, our main goal was to characterize the innate immune response in the brain during USUV encephalitis and to identify strategies to control disease severity. Using an immunocompetent mouse model of USUV encephalitis, we showed that microglia activation, blood-brain barrier (BBB) disruption and inflammatory monocyte recruitment are hallmarks of disease 6 days post infection. Activated microglia were in close association to USUV-infected cells, concomitantly with elevated levels of IL-6, IFN-γ, CCL2, CCL5, CXCL10 and CXCL1 in the brain. Monocyte recruitment was CCR2-dependent and driven by IFN-γ and CCL2 production beneath the brain vasculature. Moreover, CCR2 deficiency inhibited microglia activation and BBB disruption, showing the central role of CCR2 in USUV encephalitis. Accordingly, treatment with dexamethasone prevented pro-inflammatory mediator production and reduced leukocyte recruitment significantly, restraining encephalitis severity. Concluding, USUV encephalitis is driven by CCR2-mediated monocyte recruitment and BBB disruption, and blocked therapeutically by glucocorticoids.

Keywords: Blood–brain barrier; CCR2; Encephalitis; Glucocorticoid; Microglia; Monocyte; Usutu virus.


Conflict of interest statement

Declarations. Ethics approval and consent to participate: Experimental procedures were approved and performed following the guidelines of the Animal Ethics Committee from KU Leuven (registry number: P084/2022). Consent for publication: All authors consent the publication. Competing interests: The authors declare no competing interests.

Figures

Fig. 1
Fig. 1
USUV infection in the brain induces acute encephalitis in immunocompetent mice. a Changes in body weight of mock or USUV-infected (102–104 PFU) mice. N = 6 per group. b Survival of C57BL/6J mice inoculated with vehicle (mock), heat-inactivated or infective USUV. N = 5 per group. c Infectious virus in the brain was measured at 6 dpi and is expressed as the log10-transformed 50% tissue culture infectious dose (TCID50) per 100 mg of brain tissue. d Confocal images showing immunostaining of brain cryosections from USUV-infected mice (104 PFU) at 6 dpi, showing USUV infection (4G2, green), neurons (NeuN, magenta) and nuclei (Hoechst, blue). White square indicates the area zoomed. Scale bars = 1000 µm and 50 µm (zoom). e USUV infection is displayed as percentage of 4G2 stained area. f Representative images of microglia activation (Iba1, red) and nuclei (Hoechst, blue) in brain cryosections of mock and USUV-infected mice (104 PFU) at 6 dpi. Scale bars = 50 µm and 5 µm (zoom). g Quantification of microglia activation, displayed as % of Iba1 stained area in the cortex. h Representative images of immunostained USUV-infected cells (4G2, green) in the brain and microglia (Iba1, red). White squares indicate the zoomed areas. Scale bars = 20 μm and 5 μm. i Quantification of the percentage of infected cells that are associated with at least one microglial cell. j Levels of IL-6, CXCL1, CCL5, CXCL10, IFN-γ and CCL2 in full brain homogenates of mock and USUV-infected (102–104 PFU) mice at 6 dpi. Protein levels are displayed in pg per 100 mg of brain tissue or OD450 value (CXCL10). See also Additional file 1: Fig. S1 for TNF-α levels. Data are shown as mean ± SEM. N.D. = not detected. Image quantifications were pooled from minimum 5 pictures per mouse brain. Each dot in the graphs represents a single mouse. p values were obtained with two-way ANOVA (a), Student’s t test (e, g, j) or one-way ANOVA followed by Dunnett’s multiple comparisons test (j). Significant differences compared to mock-infected mice are indicated with *p < 0.05, **p < 0.01, ***p < 0.001, ****p < 0.0001
Fig. 2
Fig. 2
USUV increases glycolysis and cytokine release in bone marrow-derived macrophages. Bone marrow-derived macrophages (BMDM) were stimulated with medium (mock), LPS (100 ng/mL), poly I:C (100 ng/mL) or Usutu virus (USUV) at multiplicity of infection (MOI) 1 or 10 for 24 h. a Kinetic extracellular acidification rate (ECAR) of BMDMs in response to glucose, oligomycin and 2-deoxy-D-glucose (2-DG) measured by a Seahorse XF96 analyzer. b–d Glycolysis parameters calculated from ECAR values: glycolysis; glycolytic capacity; non-glycolytic acidification. e–g Levels of CCL2, CCL5 and IL-6 in supernatants of BMDMs after 24 h of stimulation. Data are shown as mean ± SEM. Each dot in the graphs represents a single mouse. p values were obtained with one-way ANOVA followed by Dunnett’s multiple comparisons test. Significant differences compared to mock-infected cells are indicated with *p < 0.05, **p < 0.01, ***p < 0.001, ****p < 0.0001
Fig. 3
Fig. 3
Inflammatory monocytes are abundantly recruited to the brain following USUV infection. Flow cytometry of cells isolated from the brain of mock and Usutu virus (USUV)-infected (104 PFU) mice at 6 dpi. a Representative flow cytometry plots with labels that are indicative for cell populations, see Additional file 1: Fig. S6 for the gating strategy. Percentages of b total leukocytes (CD45high), c inflammatory monocytes (CD45high, Ly6G, CD3, Ly6C+, CD11b+), d T cells (CD45high, CD3+), e neutrophils (CD45high, Ly6G+), f B cells (CD45high, CD19+) and g NK cells (CD45high, NK1.1+) within the live cell population are shown. h Representative confocal brain intravital microscopy (IVM) images (Additional file 2: Video S1) showing the cortical region of mock and USUV-infected (104 PFU) mice at 6 dpi. Brain vasculature (dextran, green), monocytes (CCR2, blue), neutrophils (Ly6G, cyan) and CD11b+ cells (CD11b, red) were visualized by intravenous injection of dextran and antibodies one hour prior to imaging. White square indicates the zoomed area. Scale bars = 50 μm. Data are shown as mean ± SEM. Each dot in the graphs represents a single mouse. P values were obtained with student’s t test. Significant differences compared to mock-infected mice are indicated with *p < 0.05, **p < 0.01, ***p < 0.001, ****p < 0.0001
Fig. 4
Fig. 4
Inflammatory monocyte recruitment to the brain is CCR2 dependent. a Flow cytometry of cells isolated from the brain of wild-type (WT) and CCR2−/− Usutu virus (USUV)-infected (104 PFU) mice at 6 dpi. Percentages of total leukocytes (CD45high), inflammatory monocytes (CD45high, Ly6G, CD3, Ly6C+, CD11b+), T cells (CD45high, CD3+), neutrophils (CD45high, Ly6G+), B cells (CD45high, CD19+) and NK cells (CD45high, NK1.1+) within the live cell population are shown. b Mean fluorescence intensity (MFI) of CD11b on inflammatory monocytes by flow cytometry. c Representative confocal brain intravital microscopy images (Additional file 3: Video S2) showing the cortical region of WT and CCR2−/− USUV-infected (104 PFU) mice at 6 dpi. Brain vasculature (dextran, green), monocytes (CCR2, blue), neutrophils (Ly6G, cyan) and CD11b+ cells (CD11b, red) were visualized by intravenous injection of dextran and antibodies one hour prior to imaging. Scale bar = 50 μm. d Quantification of monocyte adherence state in the brain vasculature from intravital videos, displayed as the percentage of adhered and rolling monocytes. e Quantification of microglia activation in mock, WT and CCR2−/− USUV-infected mice, displayed as percentage of Iba1 stained area in the cortex. f Representative confocal images of immunostaining on brain cryosections, showing microglia (Iba1, red) and nuclei (Hoechst, blue). Scale bar = 50 μm. g Representative confocal brain intravital microscopy images from Ccl2-RFPfl/fl mice inoculated with vehicle (mock) or USUV (104 PFU) at 6 dpi. Brain vasculature (dextran, green), CCL2-producing cells (RFP, white) and CD11b+ cells (CD11b, red) were visualized. Scale bar = 50 μm. Data are shown as mean ± SEM. Each dot in the graphs represents a single mouse. p values were obtained with student’s t test (a, b, d) or one-way ANOVA followed by Dunnett’s multiple comparisons test  (f). Significant differences compared to mock or WT-infected mice are indicated with *p < 0.05, **p < 0.01, ***p < 0.001, ****p < 0.0001
Fig. 5
Fig. 5
CCR2−/− mice are protected against BBB disruption during USUV encephalitis. a Representative intravital images from mock, WT and CCR2−/− USUV-infected mice, showing the brain vasculature and dextran leakage (dextran, green) after one hour. Scale bar = 50 μm. Quantification of vascular permeability from cortical intravital images in b mock, WT, CCR2−/− and c WT and MMP9−/− USUV-infected mice. Dextran (150 kDa) leakage was measured by the ratio of dextran mean fluorescence intensity (MFI) outside versus inside the vessels. Data are shown as mean ± SEM. Each dot in the graphs represents a single mouse. p values were obtained with one-way ANOVA followed by Dunnett’s multiple comparisons test (b) or student’s t test (c). Significant differences compared to mock or WT-infected mice are indicated with *p < 0.05, **p < 0.01, ***p < 0.001, ****p < 0.0001
Fig. 6
Fig. 6
IFN-γ stimulates CCL2 production and inflammation in the brain. a Cytokine levels of CCL2, IL-6, CXCL1 and CXCL10 in full brain homogenates of WT and IFN-γ−/− USUV-infected (104 PFU) mice at 6 dpi. Protein levels are displayed in pg per 100 mg of brain tissue. b Flow cytometry of cells isolated from the brain of WT and IFN-γ−/− USUV-infected mice. Percentages of total leukocytes (CD45high), inflammatory monocytes (CD45high, Ly6G, CD3, Ly6C+, CD11b+) and T cells (CD45high, CD3+) within the live cell population are shown. c Quantification of monocyte adherence state in the brain vasculature from intravital videos, displayed as the percentage of adhered and rolling monocytes. d Quantification of microglia activation in mock, WT and IFN-γ−/− USUV-infected mice, displayed as percentage of Iba1 stained area in the cortex. Mock and WT groups are identical to Fig. 4E. e Quantification of vascular permeability from cortical intravital images. Dextran (150 kDa) leakage was measured by the ratio of dextran mean fluorescence intensity (MFI) leaked outside the vessel over inside the vessel, one hour after injection. Mock and WT groups are identical to Fig. 5b. Data are shown as mean ± SEM. Each dot in the graphs represents a single mouse. Image quantifications were pooled from minimum 5 pictures per mouse brain. p values were obtained with student’s t test (a–c) or one-way ANOVA followed by Dunnett’s multiple comparisons test (d, e). Significant differences compared to mock or WT-infected mice are indicated with *p < 0.05, **p < 0.01, ***p < 0.001, ****p < 0.0001
Fig. 7
Fig. 7
Dexamethasone reduces USUV-induced encephalitis and disease symptoms. a C57BL/6 mice were inoculated intracranially with USUV (104 PFU) and treated subcutaneously with vehicle (PBS), aspirin (100 mg/kg), dexamethasone (50 mg/kg) or minocycline (40 mg/kg) at 4, 5 and 6 dpi. Cytokine and chemokine levels of b IL-6, c CCL2, d IFN-γ and e CXCL10 in brain homogenates at 6 dpi. Protein levels are displayed in pg per 100 mg of brain tissue. Flow cytometry of cells isolated from the brain of USUV-infected mice post-treatment. f Percentages of total leukocytes (CD45high), g inflammatory monocytes (CD45high, Ly6G, CD3, Ly6C+, CD11b+), h T cells (CD45high, CD3+) and i neutrophils (CD45high, Ly6G+) within the live cell population are shown. j Clinical score was monitored daily starting at 5 dpi. N = 9 per group. k Body weight at 6 dpi of mice treated with vehicle or dexamethasone, shown as percentage of 0 dpi. l Quantification of vascular permeability from cortical intravital images. Dextran (150 kDa) leakage was measured by the ratio of dextran mean fluorescence intensity (MFI) leaked outside the vessel over inside the vessel, one hour after injection. m Quantification of microglia activation in vehicle and dexamethasone-treated USUV-infected mice, displayed as percentage of Iba1 stained area in the cortex. n Infectious virus in the brain was measured at 6 dpi and is expressed as the log10-transformed 50% tissue culture infectious dose (TCID50) per 100 mg of tissue. Data are shown as mean ± SEM. Each dot in the graphs represents a single mouse. Image quantifications were pooled from minimum 5 pictures per mouse brain. p values were obtained with one-way ANOVA followed by Dunnett’s multiple comparisons test (b–k) or student’s t test (e, l–o). Significant differences compared to vehicle-treated mice are indicated with *p < 0.05, **p < 0.01, ***p < 0.001, ****p < 0.0001

References

    1. Morens DM, Folkers GK, Fauci AS. The challenge of emerging and re-emerging infectious diseases. Nature. 2004;430(6996):242–9. - PMC - PubMed
    1. Pierson TC, Diamond MS. The continued threat of emerging flaviviruses. Nat Microbiol. 2020;5(6):796–812. - PMC - PubMed
    1. Sips GJ, Wilschut J, Smit JM. Neuroinvasive flavivirus infections. Rev Med Virol. 2012;22(2):69–87. - PubMed
    1. Vilibic-Cavlek T, Petrovic T, Savic V, Barbic L, Tabain I, Stevanovic V, et al. Epidemiology of Usutu virus: the European Scenario. Pathogens. 2020;9(9):699. - PMC - PubMed
    1. Angeloni G, Bertola M, Lazzaro E, Morini M, Masi G, Sinigaglia A, et al. Epidemiology, surveillance and diagnosis of Usutu virus infection in the EU/EEA, 2012 to 2021. Eurosurveillance. 2023;28(33):2200929. - PMC - PubMed

LinkOut - more resources