. 2025 Apr;14(4):e70067.
doi: 10.1002/jev2.70067.

Use of the Malaria Protein VAR2CSA for the Detection of Small Extracellular Vesicles to Diagnose Adenocarcinoma

Affiliations

Use of the Malaria Protein VAR2CSA for the Detection of Small Extracellular Vesicles to Diagnose Adenocarcinoma

Yaru Zhao et al. J Extracell Vesicles. 2025 Apr.

Abstract

Pancreatic ductal adenocarcinoma (PDAC) poses a significant challenge for early diagnosis due to the lack of sensitive and specific biomarkers. This encouraged us to explore the diagnostic value of cancer-derived small extracellular vesicles (sEVs) as early detection biomarkers. We previously showed that the recombinant malaria protein VAR2CSA (rVAR2) selectively binds to oncofetal chondroitin sulfate (ofCS) on the surfaces of cancer cells, which might be useful for identifying cancer-derived sEVs. Indeed, flow cytometry revealed strong ofCS expression in PDAC cell-derived sEVs, as evidenced by the presence of mutant KRAS, a common genetic alteration in PDAC. Plasma from PDAC patients showed significantly higher ofCS+ sEV levels compared to healthy donors and patients with benign gastrointestinal diseases. ROC analysis for ofCS+ sEVs revealed an AUC of 0.9049 for the detection of all-stage and 0.9222 for early-stage PDAC. Notably, mutant KRAS was also detected in these patient-derived sEVs. Most intriguingly, combining ofCS+ sEVs and CA19-9 resulted in an AUC of 0.9707 for the detection of early PDAC. Our study demonstrates that rVAR2 is suitable for detecting ofCS+ cancer-derived sEVs in plasma, thereby providing high efficiency for identifying PDAC patients among a diverse population. These findings suggest that rVAR2-based sEV detection could serve as a powerful diagnostic tool to improve patient survival through early detection.

Keywords: Early diagnosis; extracellular vesicles; oncofetal chondroitin sulfate; pancreatic ductal adenocarcinoma; recombinant malaria protein.


Conflict of interest statement

M.Ø.A., T.M.C. T.G.T. and A.S. are shareholders in VAR2 Pharma ApS holding a patent on utilising rVAR2 for diagnosing cancer and were not involved in the data analysis. All other authors have no conflict of interest to disclose.

Figures

FIGURE 1
FIGURE 1
rVAR2 specifically targets oncofetal chondroitin sulfate. (A) Representative flow cytometry staining for five distinct primary human PDAC models (SiC002, SiC003, SiC005, SiC007 and SiC020) are shown in the upper panel. Results for white blood cells (WBCs) are presented in the lower panel. (B) Schematic depicting the expression of a variety of proteoglycans with long chains of oncofetal chondroitin sulfate (ofCS) on the surface. The staining strategy using biotinylated rVAR2 followed by PE‐labelled streptavidin is illustrated. The workflow for harvesting the culture medium from PDAC cell cultures and isolating sEVs via differential ultracentrifugation is depicted.
FIGURE 2
FIGURE 2
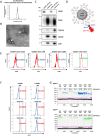
rVAR2 specifically binds PDAC cell‐derived sEVs. (A) Representative size determination using ZetaView nanoparticle tracking analysis (NTA) in sEVs derived from SiC003 primary PDAC cultures. (B) Representative transmission electron microscopy images of sEVs derived from SiC003 PDAC cultures. Arrows highlight the typical cup‐shaped morphology of sEVs. (C) Western blot analysis was conducted to detect the protein expression of exosome markers, including CD63, TSG101, Syntenin‐1 (SDCBP) and CD9, as well as the exclusion marker Calnexin (CANX) in primary PDAC cells (SiC003 and SiC007) and their respective sEVs. (D) Schematic illustrating ofCS detection in sEVs captured by latex beads using flow cytometry. (E) Flow cytometry analyses using latex beads to assess the expression of EV markers (CD63, CD9, and CD81) and the universal cancer marker ofCS in sEVs derived from SiC007 primary PDAC cultures. (F) Flow cytometry analyses, based on latex beads, for the expression of ofCS through VAR2 binding in sEVs derived from PDAC cultures (SiC003 and SiC007), in the absence or presence of Chondroitinase ABC (ChABC). BSA served as a negative control. (G) Droplet Digital PCR analysis was conducted to measure the KRAS mutational status in DNA extracted from PDAC cultures and their respective sEVs. Droplets were generated from various samples, including DNA extracted from 293T cells as a negative control, as well as DNA isolated from sEVs derived from three distinct primary PDAC cultures (SiC002, SiC003, and SiC005), along with the DNA from the corresponding parental cells. The copies per microliter are provided in the insert.
FIGURE 3
FIGURE 3
Detection of PDAC‐derived sEVs in human plasma.  (A) Workflow for the isolation and purification of plasma derived‐sEVs by differential ultracentrifugation. (B) Representative sEV size determination using ZetaView nanoparticle tracking analysis (NTA) for EVs derived from PDAC patients and healthy donors (HD). (C) Representative transmission electron microscopy (TEM) images of sEVs collected from the plasma of healthy donors (upper). Expression of the EV marker proteins CD63 and CD81 by Western blot analysis using sEVs derived from PDAC patients and healthy donors (lower). Calnexin (CANX) was used as a negative control. (D) Droplet Digital PCR analysis was performed to evaluate the KRAS mutational status in DNA extracted from sEVs derived from the plasma of PDAC patients (stage I, II, III, and IV) and the plasma from a healthy donor (HD). PDAC cells (SiC003) served as a positive control for KRAS mut, and 293T cells acted as the negative control. The number of copies per microliter is indicated in each ddPCR column. (E) Flow cytometry analyses, employing latex beads, to assess the expression of ofCS in sEVs derived from the plasma of two PDAC patients in the absence or presence of Chondroitinase ABC (ChABC).
FIGURE 4
FIGURE 4
Specificity of rVAR2 binding for detecting PDAC‐derived sEVs in plasma. (A) Latex bead‐based flow cytometry to assess the expression of ofCS in sEVs derived from the plasma of 14 healthy donors (HD) using rVAR2 binding. (B) ofCS expression in sEVs derived from the plasma of patients with non‐malignant gastrointestinal diseases (non‐malignant GID). (C) ofCS expression in sEVs derived from the plasma of patients with non‐malignant pancreatic diseases (non‐malignant PD). For panel A, B, and C, gating for the calculation of ofCS+ sEVs was based on indvidual controls (SpyC + SAV‐PE only, no rVAR2) for each sample. Fluorescence values are normalized to the highest signal, set as 100%, and expressed as % of max. (D) Quantification of ofCS expression in plasma‐derived sEVs across the three study cohorts.
FIGURE 5
FIGURE 5
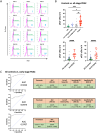
Diagnostic performance of ofCS+ sEVs for detecting PDAC. (A) Representative flow cytometry analyses, using latex beads, illustrating the expression of ofCS in sEVs derived from the plasma of 12 PDAC patients. Their respective stages (I–IV) of disease are indicated within each flow cytometry plot. (B) Quantification of ofCS expression in sEVs from PDAC patients at different stages (all stages, early‐stage [I + II], advanced‐stage [III + IV]) compared to various controls, including healthy donors (HD), patients with non‐malignant gastrointestinal diseases (GID), and non‐malignant pancreatic diseases (PD), as determined by rVAR2 binding analysis. (C) ROC curves for ofCS expression in sEVs, for CA19‐9 levels and both biomarkers combined in early‐stage [I + II] PDAC compared to all controls (healthy donors, patients with non‐malignant gastrointestinal diseases and patients with non‐malignant pancreatic diseases). The random classifier is shown as a dotted blue diagonal line. Tables show the respective AUC and underlying sensitivity and specificity values with 95% confidence intervals (CI).

References

    1. Agerbaek, M. O. , Bang‐Christensen S. R., Yang M. H., et al. 2018. “The VAR2CSA Malaria Protein Efficiently Retrieves Circulating Tumor Cells in an EpCAM‐Independent Manner.” Nature Communications 9: 3279. - PMC - PubMed
    1. Al‐Nakouzi, N. , Wang C. K., Oo H. Z., et al. 2022. “Reformation of the Chondroitin Sulfate Glycocalyx Enables Progression of AR‐Independent Prostate Cancer.” Nature Communications 13: 4760. - PMC - PubMed
    1. Allenson, K. , Castillo J., San Lucas F. A., et al. 2019. “Pancreatic Cancer Screening: More Harms Than Benefits?” Lancet Gastroenterology & Hepatology 28, no. 4: 741–747. - PubMed
    1. Bang‐Christensen, S. R. , Pedersen R. S., Pereira M. A., et al. 2019. “Capture and Detection of Circulating Glioma Cells Using the Recombinant VAR2CSA Malaria Protein.” Cells 8: 998. - PMC - PubMed
    1. Buscail, E. , Alix‐Panabieres C., Quincy P., et al. 2019. “High Clinical Value of Liquid Biopsy to Detect Circulating Tumor Cells and Tumor Exosomes in Pancreatic Ductal Adenocarcinoma Patients Eligible for Up‐Front Surgery.” Cancers (Basel) 11: 1656. - PMC - PubMed

LinkOut - more resources