. 2025 Apr 17;44(1):125.
doi: 10.1186/s13046-025-03382-y.

The de novo DNA methyltransferase 3B is a novel epigenetic regulator of MYC in multiple myeloma, representing a promising therapeutic target to counter relapse

Affiliations

The de novo DNA methyltransferase 3B is a novel epigenetic regulator of MYC in multiple myeloma, representing a promising therapeutic target to counter relapse

Catharina Muylaert et al. J Exp Clin Cancer Res. .

Abstract

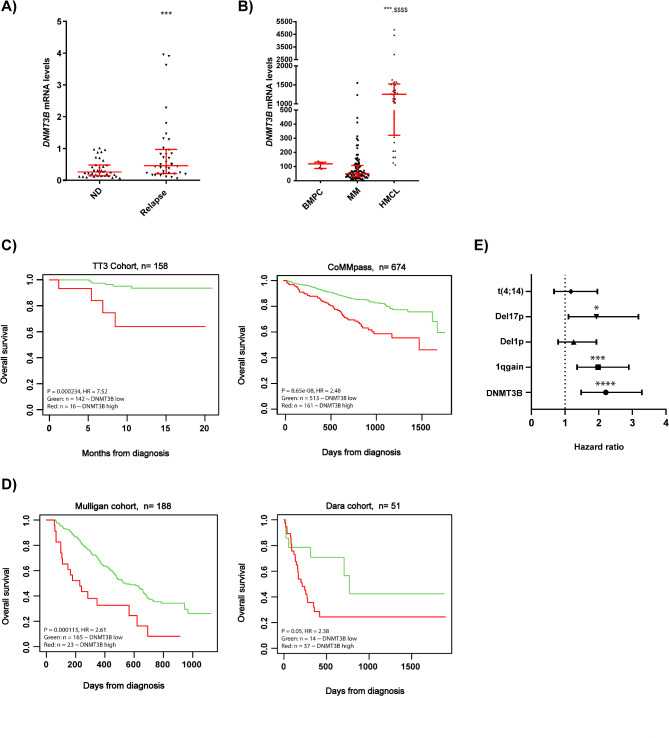
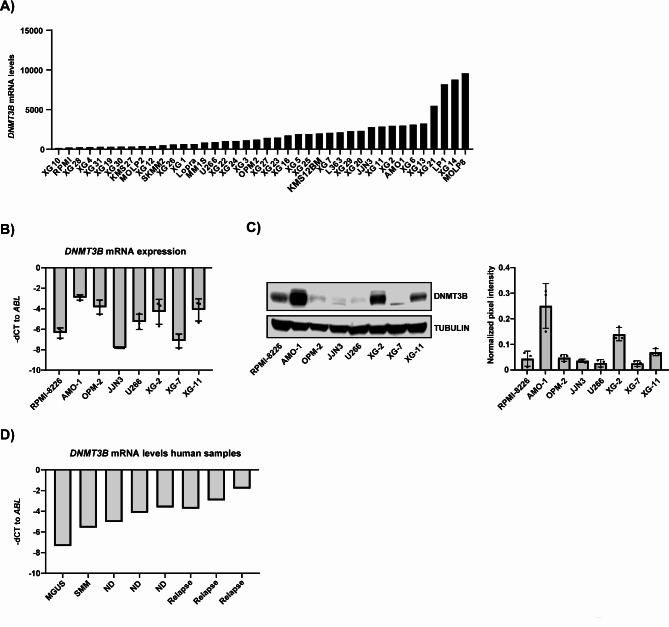
Background: The plasma cell malignancy multiple myeloma (MM) remains incurable due to the inevitable development of drug resistance (DR). Epigenetic modifiers are frequently mutated or deregulated in MM patients, contributing to MM progression and relapse. Overexpression of the de novo DNA methyltransferase 3B (DNMT3B) in MM has been reported, correlating with poor prognosis. However, its exact role in MM cell biology and relapse remains elusive.

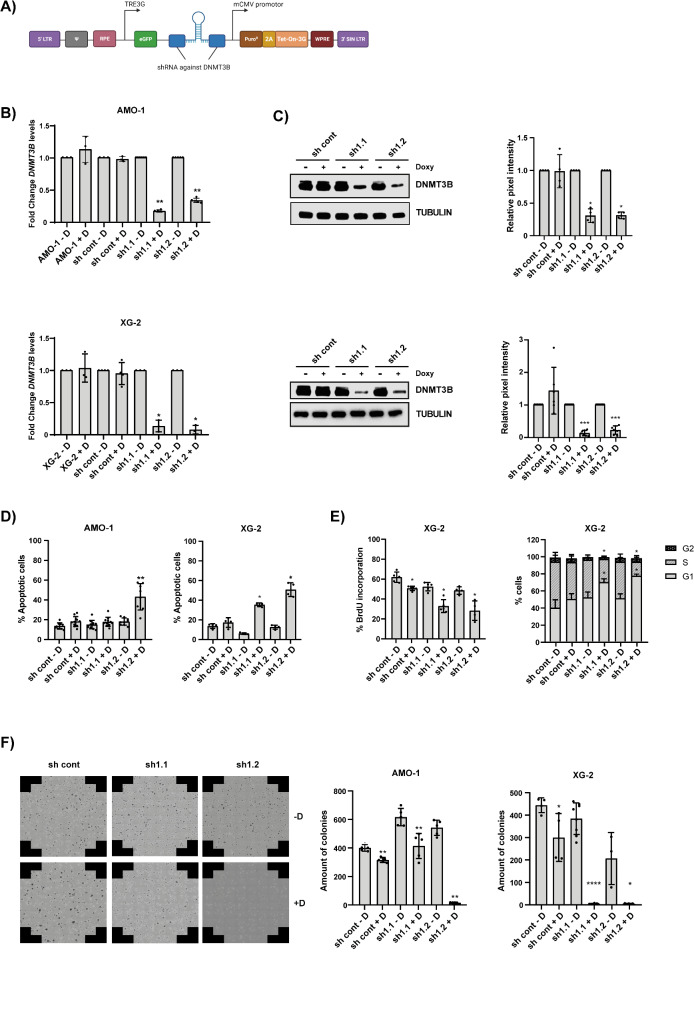
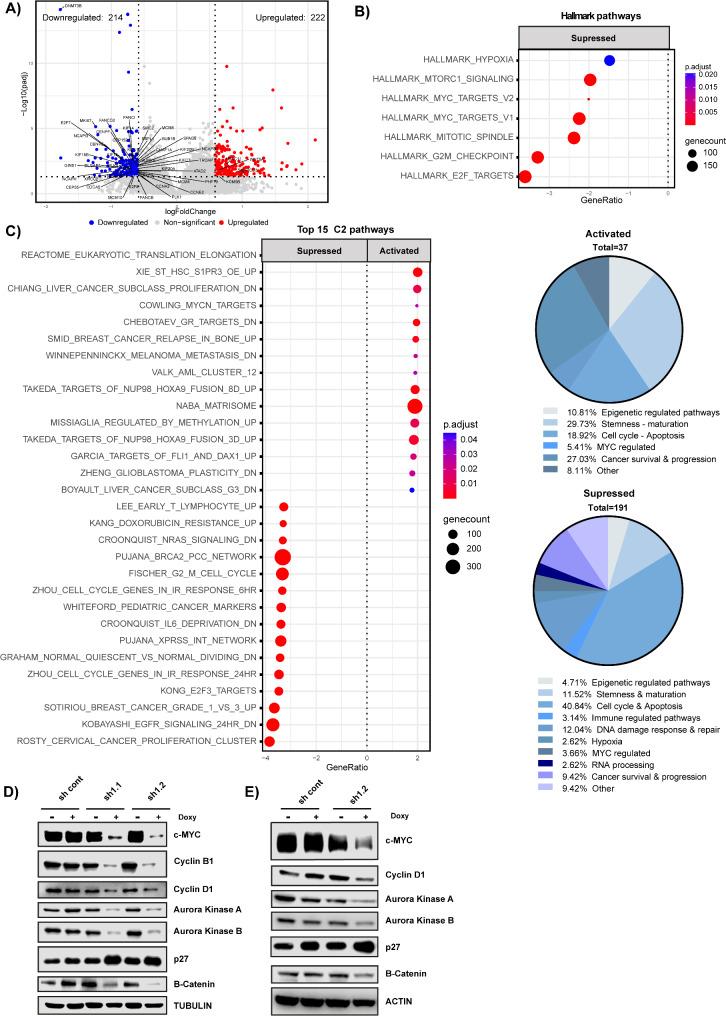
Methods: To evaluate the basal expression and prognostic value of DNMT3B mRNA in terms of overall survival the publicly available gene expression profiling datasets GSE2658, GSE9782, GSE4581, E-MTAB-372, E-TABM-1088 and E-TABM-937 were used. Both the DNMT3B selective inhibitor Nanaomycin A and genetic knockdown using a doxycycline inducible shRNA against DNMT3B were used to target DNMT3B. Viability and apoptosis were assessed using respectively a CellTiter-Glo assay and AnnexinV/7AAD stainings. Cell proliferation was measured by BrdU incorporation and cell cycle analysis, while the clonogenic capacity was evaluated by a colony formation assay. Finally, RNA-seq was performed upon genetic knockdown.

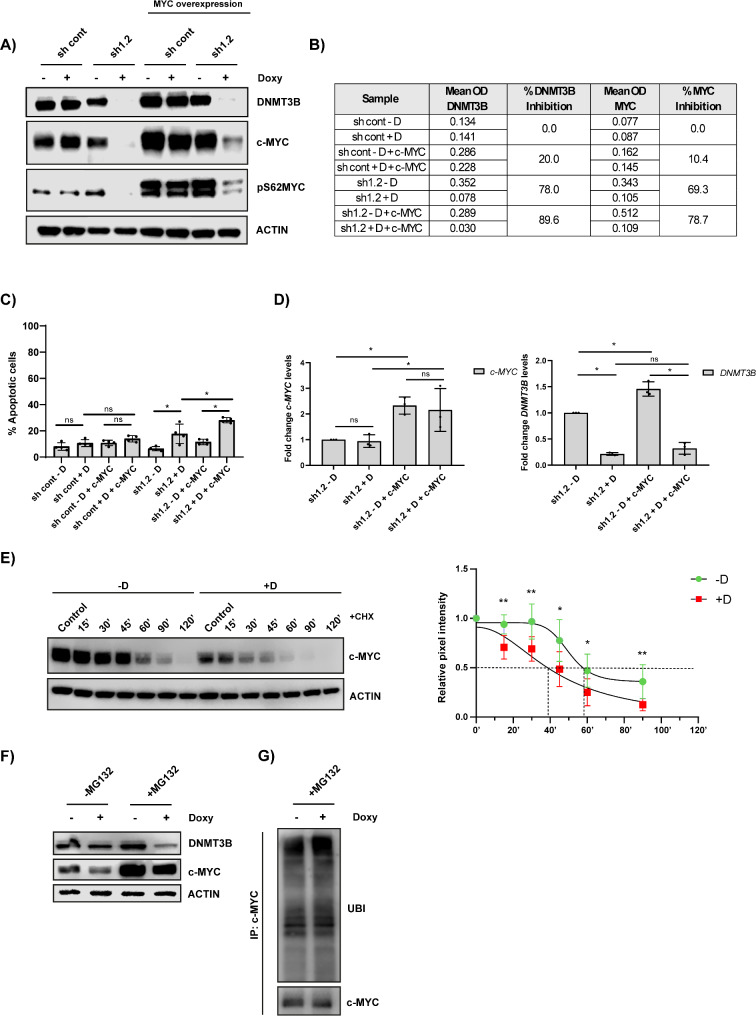
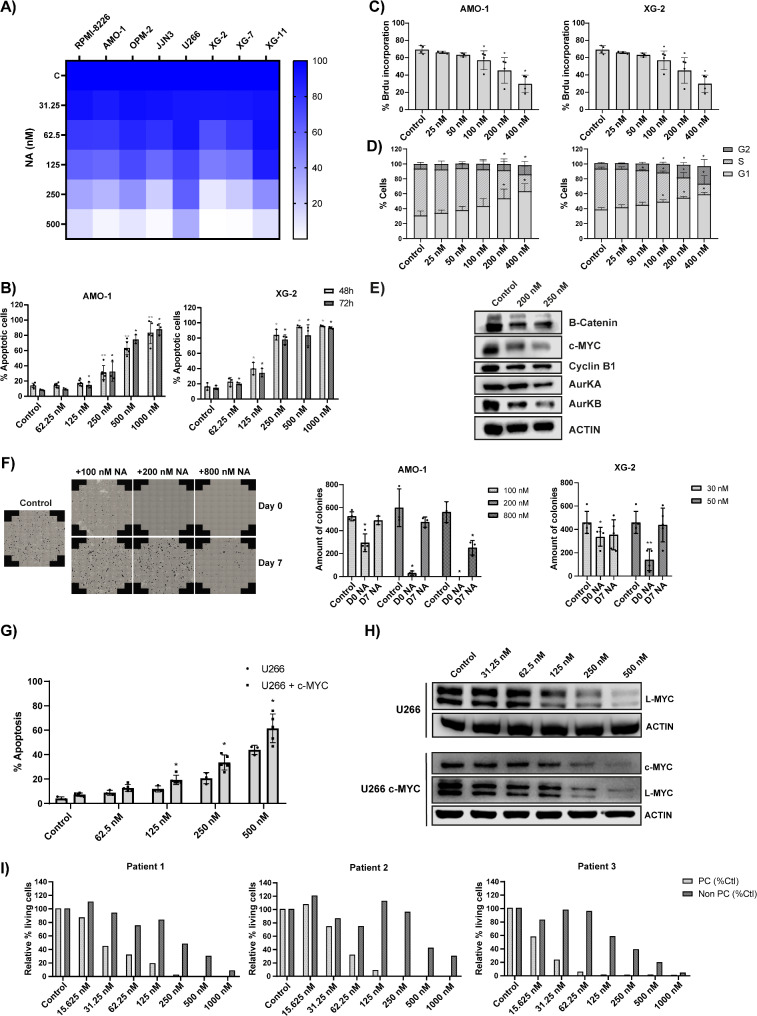
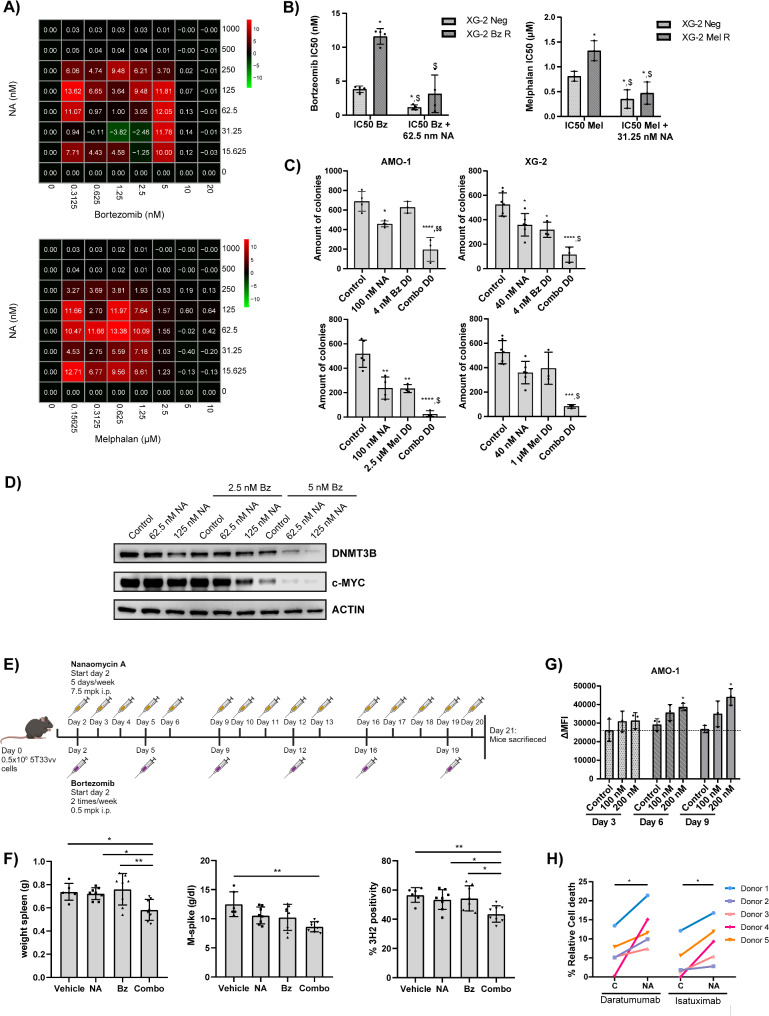
Results: Here, we show that DNMT3B is significantly increased in the relapsed setting and high DNMT3B levels are strongly correlating with disease progression and high-risk disease, irrespective of the treatment. Targeting DNMT3B using either genetic inhibition or the selective inhibitor Nanaomycin A strongly impaired MM cell growth, survival and clonogenicity. Moreover, Nanaomycin A reduced viability of primary MM cells from newly diagnosed and relapsed patients. Mechanistic studies revealed that DNMT3B inhibition mainly affects cell cycle and stemness-related transcriptional programs. Notably, DNMT3B depletion affected the stability of the master cell cycle regulator MYC, thereby reducing c-MYC levels and cell viability both in parental and c-MYC overexpressing cells. Finally, Nanaomycin A (re)sensitized MM cells to bortezomib, melphalan and anti-CD38 monoclonal antibodies (daratumumab, isatuximab).

Conclusion: Collectively, our findings uncover DNMT3B as a targetable vulnerability in high-risk patients with high DNMT3B/MYC levels.

Keywords: DNMT3B; Epigenetics; Multiple myeloma; Relapse.


Conflict of interest statement

Declarations. Ethics approval and consent to participate: BM samples from patients were collected for routine diagnostic or evaluation purposes after patients’ written informed consent was given and in accordance with the Declaration of Helsinki and institutional research board approval from Brussels University hospital (B.U.N. 143201838414) and Montpellier University hospital (DC2008-417). Peripheral mononuclear cells (PBMC) of healthy donors for NK isolation were obtained from the Hematology unit of the university hospital (UZ Brussels), after informed consent, conform with the declaration of Helsinki. In vivo experiments in mice were approved by the VUB Ethical committee (Licence No LA1230281, CEP No 23-281-13). Consent for publication: All authors read and approved the final manuscript. Competing interests: The authors declare no competing interests.

Figures

Fig. 1
Fig. 1
Expression and prognostic value of DNMT3B in MM. (A) Comparison of the DNMT3B mRNA levels of matched newly diagnosed (ND) and relapsed (Relapse) primary samples (n = 38) from the CoMMpass study. ***p ≤ 0.001. (B) DNMT3B mRNA levels as determined by RNA-Seq in normal bone marrow plasma cells (PCs, n = 5), primary MM cells (n = 97) and HMCLs (n = 33). ***p ≤ 0.001 compared to PCs, p ≤ 0.0001 compared to MM cells. C-D) Prognostic value of DNMT3B mRNA in terms of overall survival (OS) in ND (TT3 and CoMMpass cohort, C) and relapsed patients (Mulligan and Dara cohort, D). Maxstat analysis was used to calculate the optimal separation of patients based on a cut-off value. E) Multivariate cox analysis of DNMT3B, del17p, 1q gain, del 1p and t(4;14) using the data from the CoMMpass study. This forest plot shows the hazard ratios (HR) ± 95% CI. *p ≤ 0.005, ***p ≤ 0.001 and ****p ≤ 0.0001
Fig. 2
Fig. 2
DNMT3B expression in human MM cell lines and patient samples. A) DNMT3B mRNA levels in 40 different HMCLs using our own RNA-Seq data. B) DNMT3B mRNA expression in a selected panel of HMCLs using qRT-PCR. ABL was used as a reference gene. The mean expression ± SD for three independent experiments is shown. C) DNMT3B protein expression determined in a selected panel of HMCLs via western blot. Tubulin was used as loading control. Left: blots of one experiment representative of three are shown, right: quantification of the DNMT3B levels relative to tubulin as measured by Image Studio for the 3 independent experiments. D) The DNMT3B levels in PCs obtained from one monoclonal gammopathy of undetermined significance (MGUS), one smoldering myeloma (SMM), 3 newly diagnosed (ND) and 3 relapsed (Relapse) MM patients were determined using qRT-PCR. ABL was used as reference gene.
Fig. 3
Fig. 3
Effect of DNMT3B knockdown on MM cell biology. (A) Visual representation of the inducible lentiviral vectors containing a shRNA cassette against DNMT3B (shDNMT3B). (B) Validation of DNMT3B knockdown (KD) in the AMO-1 (upper panel) and XG-2 (lower panel) cells on mRNA level. DNMT3B levels were determined after 3 days of doxycycline treatment using qPCR. ABL was used as reference gene. The relative expression levels in stimulated (+ D) compared to unstimulated (-D) cells are shown (n = 3). (C) Validation of DNMT3B KD in AMO-1 (upper panel) and XG-2 (lower panel) cells on protein level. DNMT3B levels were determined by western blot 5 days post-doxycycline treatment. Tubulin was used as loading control. Left: one experiment representative of at least three is shown, right: quantification of DNMT3B levels relative to tubulin as measured by Image Studio and normalized to unstimulated (-D) cells. D-F) Effect of DNMT3B KD on apoptosis (D), proliferation (E) and clonogenic outgrowth (F). (D) Cells were stimulated for 5 days with or without doxycycline and apoptosis was measured by an AnnexinV/7’AAD staining followed by flow cytometric analysis. The % apoptotic cells are the sum of AnnexinV (+) and AnnexinV (+)/7’AAD (+) cells. (E) Cells were treated for 3 days with doxycycline after which the effect on bromo-deoxyuridine (BrdU) incorporation (left panel) and cell cycle progression (right panel) was determined using BrdU and PI-stainings respectively. (F) Transduced AMO-1 and XG-2 cells were treated for 5 or 3 days respectively with doxycyline and were then plated to perform a colony forming assay. The number of colonies were determined after 14 days using the EVOS M7000 Imaging System (left) and counted with ImageJ software (right). The mean ± SD of at least three independent experiments is shown. *p ≤ 0.05, **p < 0.01, ***p < 0.001 and ****p < 0.0001 compared to unstimulated (-D) cells
Fig. 4
Fig. 4
Transcriptomic analysis upon DNMT3B depletion. (A) Volcano plot showing upregulated (red) and downregulated (blue) genes upon DNMT3B KD. (B) Molecular signatures of suppressed genes upon DNMT3B KD after GSEA using the hallmark sets. (C) Left panel: Top 15 molecular signatures of the suppressed and activated genes upon DNMT3B KD after GSEA using all curated sets (C2). Right panel: pie charts showing the percentage of pathways involved in cell cycle, apoptosis, stemness, epigenetic regulated pathways or other. D-E) Protein levels of indicated cell cycle regulators determined by western blot for the shDNMT3B XG-2 (D) and shDNMT3B AMO-1 (E) cell line. Tubulin or actin was used as loading control. One experiment representative of three is shown. Quantification of the WB data is provided in Figure S4A-B
Fig. 5
Fig. 5
Effect of c-MYC overexpression on DNMT3B depletion outcome. (A) DNMT3B, c-MYC and pS62MYC protein levels upon DNMT3B depletion in XG-2 cells with or without constitutive c-MYC overexpression were determined after 3 days of doxycycline treatment using western blot. Actin was used as loading control. One experiment representative of at least three is shown. (B) Mean OD values and % inhibition of c-MYC and DNMT3B levels. (C) Cells were stimulated for 3 days with doxycycline and apoptosis was measured by an AnnexinV/7’AAD staining followed by flow cytometric analysis. The % apoptotic cells are the sum of AnnexinV (+) and AnnexinV (+)/7’AAD (+) cells. Bars are the mean ± SD of at least three independent experiments. *p ≤ 0.05. (D) c-MYC and DNMT3B levels in shDNMT3B transduced XG-2 cells with and without c-MYC overexpression after 3 days of doxycycline treatment using qRT-PCR. ABL was used as reference gene. (E) c-MYC protein stability upon DNMT3B depletion. XG-2 sh1.2 cells were treated with or without doxycycline for 24 h after which cycloheximide (CHX; 50 µg/mL) was added for indicated timepoints. Left: one experiment representative of at least four is shown, right: pixel density of the bands obtained for c-MYC relative to actin as measured by Image Studio and normalized to control. The mean ± SD of at least four independent experiments is shown. *p ≤ 0.05 and **p ≤ 0.01 compared to -D. (F) DNMT3B and c-MYC protein levels of XG-2 sh1.2 cells treated with doxycyline for 24 h followed by MG132 treatment (5 µM) for an additional 3 h. (G) Ubiquitinated levels of c-MYC of XG-2 sh1.2 cells treated with doxycyline for 24 h followed by MG132 (5 µM) treatment for an additional 3 h
Fig. 6
Fig. 6
Effect of Nanaomycin A on human MM cell lines and patient cells. (A) Effect of NA on HMCL viability after 72 h. (B) Apoptosis in AMO-1 and XG-2 evaluated after 48 h (light gray) and 72 h (dark gray). C-D) Effect of NA treatment on BrdU incorporation (C) and cell cycle progression (D) after 24 h. E) Protein levels of indicated cell cycle regulators in the XG-2 cells following 3 days of NA treatment (200 and 250 nM). Actin was used as loading control. One experiment representative of three is shown. F) Effect of NA on MM cell clonogenicity. AMO-1 cells were treated with 100, 200 nM (low doses) or 800 nM (high dose) of NA on the day of plating (day 0) or 7 days post-plating (day 7), whereas XG-2 cells were treated with 30 and 50 nM (low doses) of NA either on day 0 or day 7. Colonies were counted 14 days post-plating using the EVOS M7000 Imaging System. Left: visual representation of the AMO-1 colony forming assay, right: number of colonies counted with ImageJ. The mean ± SD of at least three independent experiments is shown. *p ≤ 0.05 and **p ≤ 0.01 compared to control. G) Effect of NA on apoptosis in the wildtype and c-MYC overexpressing U266 cells after 72 h of treatment. H) Protein levels of c/L-MYC upon 3 days of NA treatment of the wildtype (upper) and c-MYC U266 overexpressing (lower) cells. Actin was used as loading control. One experiment representative of three is shown. I) Effect of NA on primary human samples. Purified primary BM mononuclear cells (n = 3) were treated for 4 days with indicated concentrations of NA and the percentage of viable malignant CD138 + plasma cells (PC) and non-tumoral CD138- cells (Non PC) was evaluated by flow cytometric analysis
Fig. 7
Fig. 7
Nanaomycin A sensitizes MM cells to bortezomib, melphalan and anti-CD38 monoclonal antibodies. (A) Effect of NA on bortezomib (Bz) or melphalan (Mel) sensitivity. XG-2 cells were treated 4 days with NA and/or Bz or Mel and the effect on viability was assessed. Synergy scores were calculated using the Bliss method. The mean of at least three independent experiments is shown. (B) Effect of NA on Bz or Mel sensitivity in resistant cell lines. XG-2 parental (XG-2 Neg) and Bz/Mel resistant (XG-2 Bz R/Mel R) cells were treated 4 days with the IC50 of the parental cells respective standard of care agent alone or in combination with 62.5 nM or 31.25 nM NA respectively. The mean ± SD of at least three independent experiments is shown. *p ≤ 0.05 compared to IC50 Bz/Mel XG-2 Neg. $ p ≤ 0.05 compared to IC50 Bz/mel XG-2 Bz/Mel R. (C) Effect of combination treatment on clonogenic outgrowth. AMO-1 and XG-2 cells were treated with NA and/or Bz/Mel on day 0. Colonies were counted 14 days post-plating using the EVOS M7000 and ImageJ. Mean ± SD of at least three independent experiments is shown. *p ≤ 0.05, **p ≤ 0.01, ***p ≤ 0.001 and ****p < 0.0001 compared to control. $ p ≤ 0.05 and $$ p ≤ 0.01 compared to both single agents alone. (D) DNMT3B and c-MYC protein levels in XG-2 cells after 24 h of NA and/or Bz treatment. Actin was used as loading control. One experiment representative of three is shown. (E) Set-up of the 5T33MM mouse experiment. (F) Effect of low dose NA and/or Bz treatment on spleen weight, M-protein serum levels and the percentage of 3H2-positive myeloma cells. *p ≤ 0.05, **p ≤ 0.01. G-H Effect of long-term low dose NA treatment (up to 9 days) on CD38 cell surface expression (G) and ADCC induced by daratumumab (1 µg/mL) and isatuximab (10 ng/mL) (H) for the AMO-1 cells. NK cells were added with an effector-to-target ratio of 5:1. *p ≤ 0.05 compared to control

Similar articles

Cited by

References

    1. Monteith BE, Sandhu I, Lee AS. Management of multiple myeloma: A review for general practitioners in oncology. Curr Oncol. 2023;30:4382–401. - PMC - PubMed
    1. Elbezanti WO, Challagundla KB, Jonnalagadda SC, Budak-Alpdogan T, Pandey MK, Past. Present, and a glance into the future of multiple myeloma treatment. Pharmaceuticals (Basel) 16 (2023). - PMC - PubMed
    1. Maes K, et al. Epigenetic modulating agents as a new therapeutic approach in multiple myeloma. Cancers (Basel). 2013;5:430–61. - PMC - PubMed
    1. Galm O, et al. DNA methylation changes in multiple myeloma. Leukemia. 2004;18:1687–92. - PubMed
    1. Muylaert C, et al. Aberrant DNA methylation in multiple myeloma: A major obstacle or an opportunity? Front Oncol. 2022;12:979569. - PMC - PubMed

MeSH terms

Substances