. 2025 May 1;328(5):C1623-C1636.
doi: 10.1152/ajpcell.01021.2024. Epub 2025 Apr 16.

Fibronectin-dependent integrin signaling drives EphA2 expression in vascular smooth muscle cells

Affiliations

Fibronectin-dependent integrin signaling drives EphA2 expression in vascular smooth muscle cells

Brenna Pearson-Gallion et al. Am J Physiol Cell Physiol. .

Abstract

Vascular smooth muscle cells undergo a phenotypic shift to a "synthetic" phenotype during atherosclerosis characterized by downregulation of contractile markers and augmented proliferation, migration, and extracellular matrix deposition. While absent in contractile smooth muscle cells, the receptor tyrosine kinase EphA2 shows enhanced expression in synthetic vascular smooth muscle in vitro and in atherosclerotic plaques in vivo. EphA2 deletion in atheroprone ApoE knockout mice reduces plaque size, fibrous tissue, and smooth muscle content. However, the mechanisms regulating smooth muscle EphA2 expression remain unknown. Although serum strongly induces EphA2 expression, individual growth factors and insulin all failed to stimulate EphA2 expression in smooth muscle cells. In contrast, adhesion to fibronectin stimulated the expression of EphA2, while blunting serum-induced fibronectin deposition attenuated EphA2 expression, suggesting a critical role for fibronectin signaling. Fibronectin binds to a subset of extracellular matrix-binding integrins, and blocking fibronectin-integrin interactions or inhibiting specific fibronectin-binding integrins both attenuated EphA2 expression. Furthermore, pharmacological inhibition of fibronectin-binding integrins significantly reduced EphA2 expression in atherosclerotic plaques. RNA sequencing analysis of fibronectin-associated gene expression pointed to NF-κB as a likely transcription factor mediating fibronectin-responsive genes. Adhesion to fibronectin enhanced NF-κB activation in smooth muscle cells and inhibiting NF-κB blunted EphA2 expression associated with fibronectin. In addition, chromatin immunoprecipitation showed that NF-κB directly interacts with the EphA2 promoter, and mutating this site blunts fibronectin-dependent EphA2 promoter activity. Together these data identify a novel role for fibronectin-dependent integrin signaling in the induction of smooth muscle EphA2 expression.NEW & NOTEWORTHY Here, we demonstrate a novel interplay between cell-cell and cell-matrix adhesions, showing that fibronectin-dependent integrin signaling promotes NF-κB activation and interaction with the EphA2 promoter to drive smooth muscle EphA2 expression, whereas integrin inhibition attenuates EphA2 expression in atherosclerotic plaques in vivo. Although this relationship has clear implications on smooth muscle fibroproliferative remodeling in atherosclerosis, the matrix-specific regulation of EphA2 expression may impact a variety of pathological conditions.

Keywords: EphA2; NF-κB; fibronectin; integrins; vascular smooth muscle.


Conflict of interest statement

DISCLOSURES:

The authors have no conflicts to disclose.

Figures

Figure 1:
Figure 1:
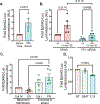
Human vascular smooth muscle cells (hVSM cells) were serum-starved for 72 hours and plated onto tissue culture dishes with either A) human recombinant epidermal growth factor (EGF), B) human recombinant fibroblastic growth factor-basic (bFGF), or C) human recombinant platelet-derived growth factor-BB (PDGF) at the indicated concentrations for 72 hours, and compared with 10% FBS treatment for an additional 72 hours. EphA2 protein expression was assessed by Western blotting and normalized to GAPDH. n=3. D) hVSM cells were serum-starved for three days and plated onto fibronectin (10μg/mL) tissue-culture dishes for an additional 1, 2, or 3 days. EphA2 expression was measured using Western blot and normalized to GAPDH. n=4. E) hVSM cells were treated with either mock or siRNA targeted against fibronectin (siFN) for 24 hours and plated onto laminin-coated plates (20μg/mL). Cells were plated in either serum-free or 1% FBS-depleted serum-containing conditions for 24 hours, and EphA2 was measured by Western blot and normalized to GAPDH. n=3. F) Grade V human atherosclerotic lesions from carotid arteries were stained for EphA2 (teal) or fibronectin-EDA (pink). Scale bar = 50μm. G, H) hVSM cells were serum-starved for 72 hours and plated onto fibronectin-coated tissue culture dishes (10μg/mL) in serum-free conditions and allowed to attach and spread overnight prior to treatment. Following treatments, EphA2 expression was analyzed by Western blot and normalized to GAPDH. G) Cells were treated with either 13G12 (control) or 16G3 (blocking) fibronectin antibodies (10μg/mL) for an additional three days. H) Cells were treated with either S247 (10μM) or Compound 12 (C12) (100nM) for an additional three days. n=3–4. I) αv flox/flox and J) α5 flox/flox mouse aortic VSM cells treated with either GFP-CMV (control) or GFP-Cre recombinase (Cre) adenovirus were serum-starved for three days and plated onto fibronectin (10μg/mL) for three additional days in serum-free conditions. EphA2 and integrin αV or α5 were analyzed by Western blot and normalized to GAPDH. n=3–5. Data are expressed as mean ±SEM. Statistical comparisons were made using One-way ANOVA with Bonferroni post-test (A,E), Two-way ANOVA with Bonferroni post-test (C), or Student’s T-test (D,F,G). Value above bracket indicates p-value, with comparisons between the two bars at the end of each bracket.
Figure 2:
Figure 2:
Left and right carotid arteries were analyzed for EphA2 (teal), smooth muscle actin (SMA, pink) and DAPI (purple). A,B) ApoE KO mice were fed Western diet for 4 weeks, then administered either saline (control) or S247 (treatment) by osmotic pump with Western diet for an additional four weeks and quantified for plaque-associated EphA2. C,D) ApoE KO mice were fed Western diet with either saline (control) intraperitoneal injection or ATN-161 (treatment) intraperitoneal injection for 8 weeks and quantified for plaque-associated EphA2, expressed as mean fluorescence intensity (MFI). n=3–5 mice per treatment. Data are expressed as mean ±SEM. Statistical comparisons were made using Student’s T-test. Value above bracket indicates p-value, with comparisons between the two bars at the end of each bracket.
Figure 3:
Figure 3:
Rat aortic VSM cells were transfected with a luciferase reporter construct driven by the EphA2 promoter (−1880 to +137 base pairs flanking the transcription start site). Luciferase reporter activity was measured for luminescent arbitrary units (AU) and expressed as fold change from control. A) Cells were plated in either serum-free or 10% serum-containing conditions for 72 hours. n=4. B) Cells were treated with either mock or siRNA targeted against fibronectin (siFN) for 24 hours and plated onto laminin-coated plates (20μg/mL). Cells were plated in either serum-free or 10% FBS-depleted serum-containing conditions for 24 hours. n=4. C) Cells were plated on either collagen IV (10ug/mL), laminin (20ug/mL), collagen I (40ug/mL), or fibronectin (10ug/mL) in serum-free conditions for 72 hours. n=5. D) Cells were plated onto fibronectin (10ug/mL) in serum-free conditions and treated with either S247 (1uM) or Compound 12 (C12) (100nM) for 72 hours. n=3. Data are expressed as mean ±SEM. Statistical comparisons were made using Student’s T-test (B), One-way ANOVA with Bonferroni post-test (C,F), or Two-way ANOVA with Bonferroni post-test (D,E). Value above bracket indicates p-value, with comparisons between the two bars at the end of each bracket.
Figure 4:
Figure 4:
Human vascular smooth muscle cells were plated onto either laminin (20ug/mL) or fibronectin (10ug/mL) and maintained in serum free media for 72 hours. A) PCA analysis. B) Volcano plot of differentially expressed genes (DEGs). C) Gene Ontology (GO) Analysis. D) in silico analysis of DEGs utilizing Enrichr analysis using the Transcriptional Regulatory Relationships Unravelled by Sentence Based Text Mining (TRRUST) database. E) The EphA2 promoter was analyzed for predictive transcription factor binding using ALGGEN Promo. Select transcription factors at approximate binding locations indicated in the above schematic. Value above bracket indicates p-value, with comparisons between the two bars at the end of each bracket.
Figure 5:
Figure 5:
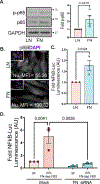
A,B) hVSM cells were transfected with siRNA against fibronectin, then plated onto either laminin (20ug/mL) or fibronectin (10ug/mL) for 72 hours. A) Phosphorylated p65 was measured with Western blot and normalized to total p65. n=4. B) hVSM cells were stained for p65 (white) and DAPI (purple) and nuclear p65 was measured as mean fluorescence intensity (MFI). C) Rat aortic VSM cells were transfected with a luciferase reporter construct driven by the Nf-κB promoter and plated on either laminin (20ug/mL) or fibronectin (10ug/mL) for 72 hours. Luciferase reporter activity was measured for luminescent arbitrary units (AU) and expressed as fold change from control. n=3. D) Rat aortic VSM cells were transfected with a luciferase reporter construct driven by the Nf-κB promoter. Luciferase reporter activity was measured for luminescent arbitrary units (AU) and expressed as fold change from control. Cells were treated with either mock or siRNA targeted against fibronectin (siFN) for 24 hours and plated onto laminin-coated plates (20μg/mL). Cells were plated in either serum-free or 10% FBS-depleted serum-containing conditions for 24 hours. n=3. Data are expressed as mean ±SEM. Statistical comparisons were made using Student’s T-Test (A,C) or Two-way ANOVA with Bonferroni post-test (D,E). Value above bracket indicates p-value, with comparisons between the two bars at the end of each bracket.
Figure 6:
Figure 6:
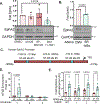
A) hVSM cells were serum-starved for 72 hours and plated on fibronectin (10μg/mL) prior to treatment with DMSO (control), U0126 (MEK inhibitor, 10μM), SP600125 (JNK inhibitor, 20μM) or BAY11-7821 (IκBα inhibitor, 10μM) for an additional 72 hours in serum-free conditions. n=3. B) hVSM cells were treated with either CMV (control) or the super-repressor IκBα (SR-IκBα) adenovirus (MOI = 20) for 24 hours, then plated onto fibronectin (10ug/mL) in serum-free conditions for 72 hours. n=3. C) Schematic of Potential NF-κB binding sites within the human EphA2 promoter. D) Chromatin immunoprecipitation of p65 was performed on hVSM cells maintained in either serum-free or 10% serum conditions for 72 hours. n=4. E) Rat aortic VSM cells were transfected with a luciferase reporter construct driven by the EphA2 promoter (−1880 to +137 base pairs flanking the transcription start site), along with constructs containing a point mutation in the NF-κB binding sites. Cells were plated on laminin in either serum free or 10% FBS for 72 hours. Luciferase reporter activity was measured for luminescent arbitrary units (AU) and expressed as fold change from control. n=4. Data are expressed as mean ±SEM. Statistical comparisons were made using Student’s T-Test (B), One-way ANOVA with Bonferroni post-test (A), or Two-way ANOVA with Bonferroni post-test (D,E). Value above bracket indicates p-value, with comparisons between the two bars at the end of each bracket.

References

    1. de Ruiter MC, Poelmann RE, van Iperen L, and Gittenberger-de Groot AC. The early development of the tunica media in the vascular system of rat embryos. Anat Embryol (Berl) 181: 341–349, 1990. - PubMed
    1. Yurdagul A Jr., Finney AC, Woolard MD, and Orr AW. The arterial microenvironment: the where and why of atherosclerosis. Biochem J 473: 1281–1295, 2016. - PMC - PubMed
    1. Du KL, Ip HS, Li J, Chen M, Dandre F, Yu W, Lu MM, Owens GK, and Parmacek MS. Myocardin is a critical serum response factor cofactor in the transcriptional program regulating smooth muscle cell differentiation. Mol Cell Biol 23: 2425–2437, 2003. - PMC - PubMed
    1. Jones BA, Aly HM, Forsyth EA, and Sidawy AN. Phenotypic characterization of human smooth muscle cells derived from atherosclerotic tibial and peroneal arteries. J Vasc Surg 24: 883–891, 1996. - PubMed
    1. Stary HC, Chandler AB, Dinsmore RE, Fuster V, Glagov S, Insull W Jr., Rosenfeld ME, Schwartz CJ, Wagner WD, and Wissler RW. A definition of advanced types of atherosclerotic lesions and a histological classification of atherosclerosis. A report from the Committee on Vascular Lesions of the Council on Arteriosclerosis, American Heart Association. Circulation 92: 1355–1374, 1995. - PubMed

MeSH terms

Grants and funding

LinkOut - more resources