. 2024;43(1):1-27.
doi: 10.1080/07474946.2023.2272908. Epub 2024 Jan 10.

Data-Adaptive Symmetric CUSUM for Sequential Change Detection

Affiliations

Data-Adaptive Symmetric CUSUM for Sequential Change Detection

Nauman Ahad et al. Seq Anal. 2024.

Abstract

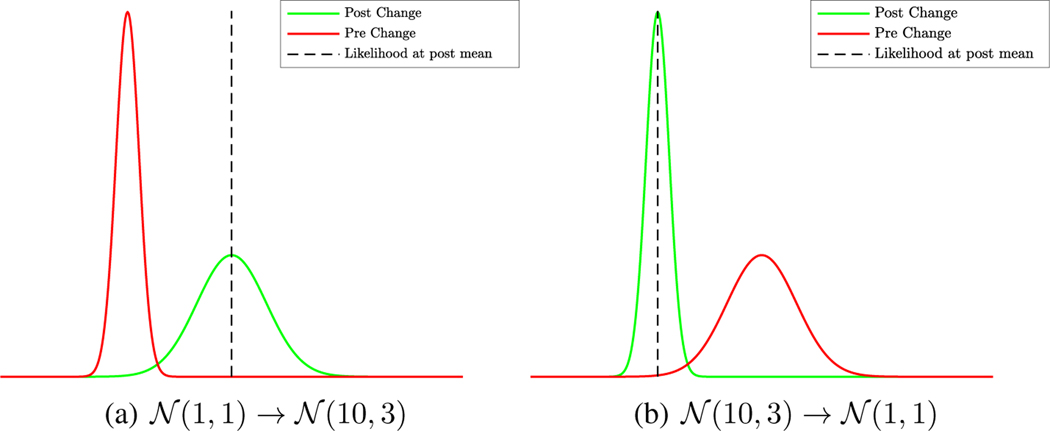
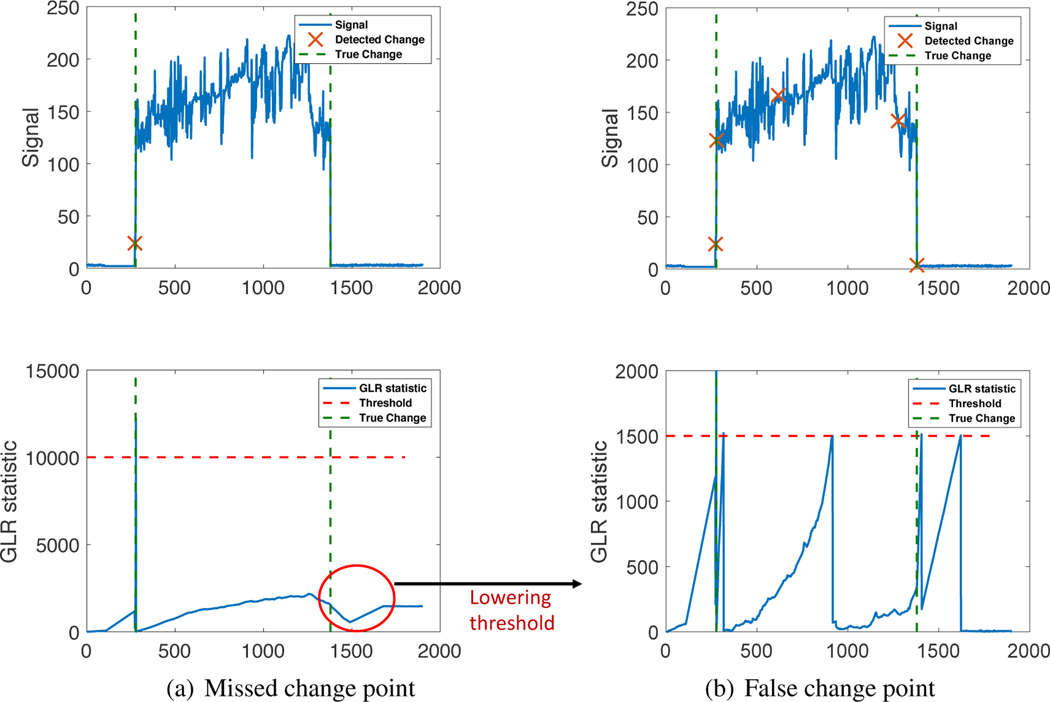
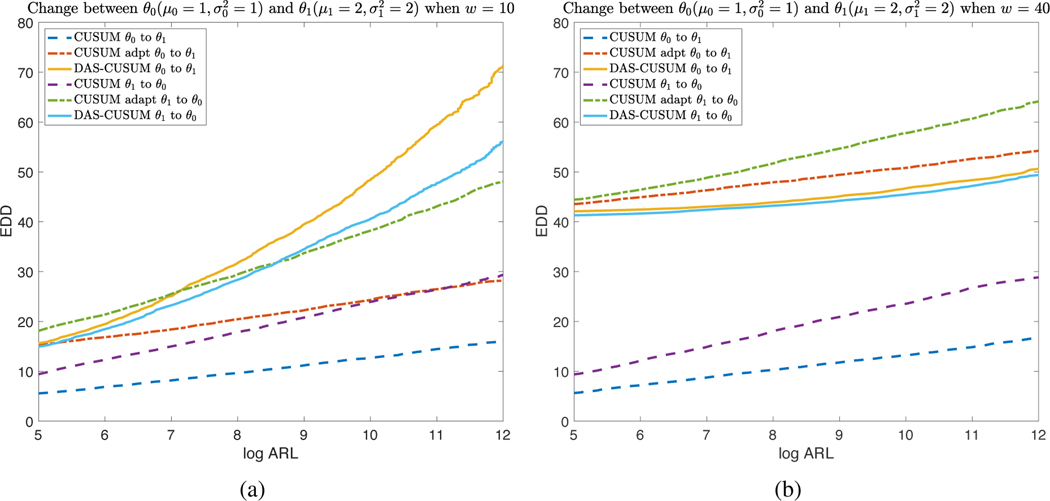
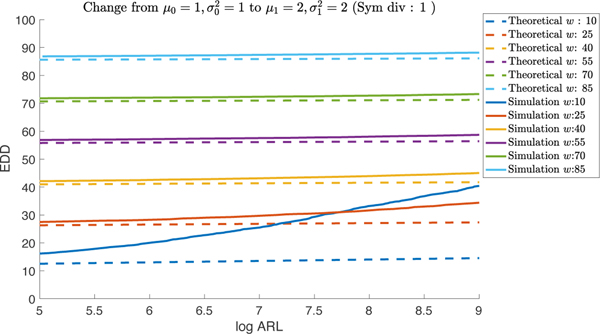
Detecting change points sequentially in a streaming setting, especially when both the mean and the variance of the signal can change, is often a challenging task. A key difficulty in this context often involves setting an appropriate detection threshold, which for many standard change statistics may need to be tuned depending on the pre-change and post-change distributions. This presents a challenge in a sequential change detection setting when a signal switches between multiple distributions. Unfortunately, change point detection schemes that use the log-likelihood ratio, such as CUSUM and GLR, are quick to react to changes but are not symmetric when both the mean and the variance of the signal change. This makes it difficult to set a single threshold to detect multiple change points sequentially in a streaming setting. We propose a modified version of CUSUM that we call Data-Adaptive Symmetric CUSUM (DAS-CUSUM). The DAS-CUSUM procedure is symmetric for changes between distributions, making it suitable to set a single threshold to detect multiple change points sequentially in a streaming setting. We provide results that relate the expected detection delay and average run length for our proposed procedure when both pre-change and post-change distributions are normally distributed. Experiments on simulated and real world data show the utility of DAS-CUSUM.

Keywords: Changes in mean and variance; False-alarm control; change-point detection.


Figures

Figure 1.
Figure 1.
Joint changes in mean and variance lead to asymmetric Likelihood Ratios. In Figure 1(a), the pre-change likelihood is in the tail, leading to a large likelihood ratio. In Figure 1(b), the post-change likelihood is higher than it is in Figure 1(a), leading to a relatively smaller likelihood ratio
Figure 2.
Figure 2.
Joint changes in mean and variance lead to asymmetric likelihood ratio. In Figure 2(a), the likelihood ratio (in GLR) for the second change is much smaller than the likelihood for the first change. This can lead to a missed change point when the detection threshold is set to be large. When the detection threshold is loweblack to detect this missed change point, many false change points are detected, as shown in Figure 2(b).
Figure 3.
Figure 3.
Adaptive version of CUSUM. Using a “future” window to estimate post-change parameters θ^t could be used in place of post-change distribution θ1 for CUSUM update.
Figure 4.
Figure 4.
Expected detection delay (EDD) versus window size for a change with symmetric KL divergence of 0.5 at an ARL value of 5,000. This figure shows that the EDD is a convex function of w which can be minimized to obtain the optimal window w.
Figure 5.
Figure 5.
EDD versus ARL performance comparison for DAS-CUSUM and CUSUM for changes between θ0(μ0=1,σ02=1) and θ1(μ1=2,σ12=2) which corresponds to a symmetric KL divergence of 1. Figure 5(a) shows the relationship when a window size of 10 is used for the post-change estimate. while Figure 5(b) shows the case when the window size is 40. Notice the similar performance for DAS-CUSUM for changes from θ0 to θ1 and θ1 to θ0. This similarity increases with window size w.
Figure 6.
Figure 6.
Comparison between theoretical and simulated DAS-CUSUM results for different post-change estimation window sizes w. The change in this example has a symmetric KL divergence of 1.
Figure 7.
Figure 7.
Relation between EDD and window size for changes with different symmetric KL divergence. The ARL has been set to 5,000 in both figures. The optimal window size corresponds to the minimum EDD values. Figure 7(a) shows the relationship for a change with symmetric KL divergence of 1 while 7(b) shows the relationship for a symmetric KL divergence of 2
Figure 8.
Figure 8.
ARL versus EDD performance for different window length (w) sizes. Figures 8(a) shows plots for a change from θ0(μ0=1,σ02=1) to θ1(μ1=1.3,σ12=1.3) and 8(b) shows plots for changes from θ0(μ0=1,σ02=1) to θ1(μ1=1.2,σ12=1.2). Optimal window size (w) provides optimal performance as w increases.
Figure 9.
Figure 9.
Plots for results in table 1. Figure 9(a) shows the relationship for an ARL value of 5,000 while Figure 9(b) shows the relationship for an ARL of 10,000. The gap between simulation and theoretical results gets small at a window value of about 30.
Figure 10.
Figure 10.
ARL vs. EDD relationship when moving between θ0:(μ0=0.5,σ02=2) to θ1:(μ1=3,σ12=3) and from θ1:(μ1=3,σ12=3) to θ2:(μ2=1.5,σ22=1.5). For both figures, which show different window sizes used, curves for DAS-CUSUM are closer, indicating it is easier to set a threshold to detect changes from θ0 to θ1 and from θ1 to θ2 with closer EDD vs. ARL performance.
Figure 11.
Figure 11.
The change statistic St for DAS-CUSUM, CUSUM, and adaptive CUSUM is presented under the assumption of no distributional shifts. The left figure displays a pre-change distribution with μ0=0.5 and σ02=0.5, while the right figure illustrates a pre-change distribution with μ0=3 and σ02=3. A window size of 20 is employed for estimating the post-change distribution in both DAS-CUSUM and adaptive CUSUM methods.
Figure 12.
Figure 12.
The change statistic St for DAS-CUSUM, CUSUM, and adaptive CUSUM is presented under different distributional shifts. The left figure displays the change statistic under the post-change distribution of θ1=(μ1=3,σ12=3), transitioning from a pre-change distribution of θ0=(μ0=0.5,σ02=0.5). In contrast, the right figure illustrates the change statistic under the post-change distribution of θ2=(μ2=1.5,σ22=1.5), originating from a pre-change distribution of θ1=(μ1=3,σ12=3). Both DAS-CUSUM and adaptive CUSUM methods employ a window size of 20 for estimating the post-change distribution.
Figure 13.
Figure 13.
Sensor mat used for characterizing in-seat behavior for wheelchair users. Sequential change-point detection can be used to identify changes in wheelchair occupancy.
Figure 14.
Figure 14.
Figures 14(a) shows performance and 14(b) show the advantages of using DAS-CUSUM for multiple changes over adaptive CUSUM
Figure 15.
Figure 15.
Comparison of GLR, Adaptive CUSUM, and DAS-CUSUM for detecting multiple change points. The asymmetric log-likelihood ratio makes it difficult for CUSUM and GLR to detect all changes correctly without any false alarms. In Figures 15(a) and 15(b), a large detection threshold to avoid false change points results in many missed change points while still detecting a few false change points. Figures 15(c) 15(d) show how a lower threshold results in many false change points. The symmetric DAS-CUSUM is able to correctly detect all true change points without detecting any false change points

Similar articles

References

    1. Al-Assaf Yousef. Surface myoelectric signal analysis: dynamic approaches for change detection and classification. IEEE. Trans. Biomed. Eng, 53(11):2248–2256, 2006. - PubMed
    1. Alippi Cesare, Boracchi Giacomo, Carrera Diego, and Roveri Manuel. Change detection in multivariate datastreams: likelihood and detectability loss. In Proc. Int. Joint Conf. on Artif. Intelligence (IJCAI), 2016.
    1. Aminikhanghahi Samaneh and Cook Diane. A survey of methods for time series change point detection. Knowl. Inf. Syst, 51(2):339–367, 2017a. - PMC - PubMed
    1. Aminikhanghahi Samaneh and Cook Diane. Using change point detection to automate daily activity segmentation. In Proc. IEEE Int. Conf. on Perv. Comp. and Comm. Workshops (PerCom Workshops), 2017b.
    1. Andre-Obrecht Regine. A new statistical approach for the automatic segmentation of continuous speech signals. IEEE Trans. Accous. Speech. Signal Process, 36(1):29–40, 1988.

LinkOut - more resources