. 2025 Mar 22;28(4):112273.
doi: 10.1016/j.isci.2025.112273. eCollection 2025 Apr 18.

Mechanical control of the alternative splicing factor PTBP1 regulates extracellular matrix stiffness induced proliferation and cell spreading

Affiliations

Mechanical control of the alternative splicing factor PTBP1 regulates extracellular matrix stiffness induced proliferation and cell spreading

Pei-Li Tseng et al. iScience. .

Abstract

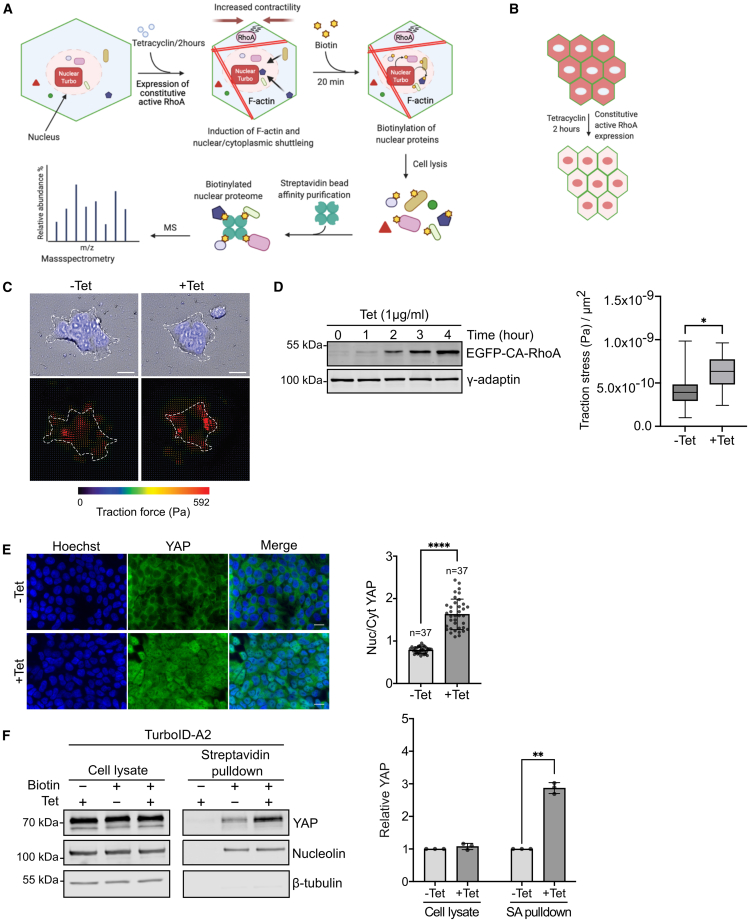
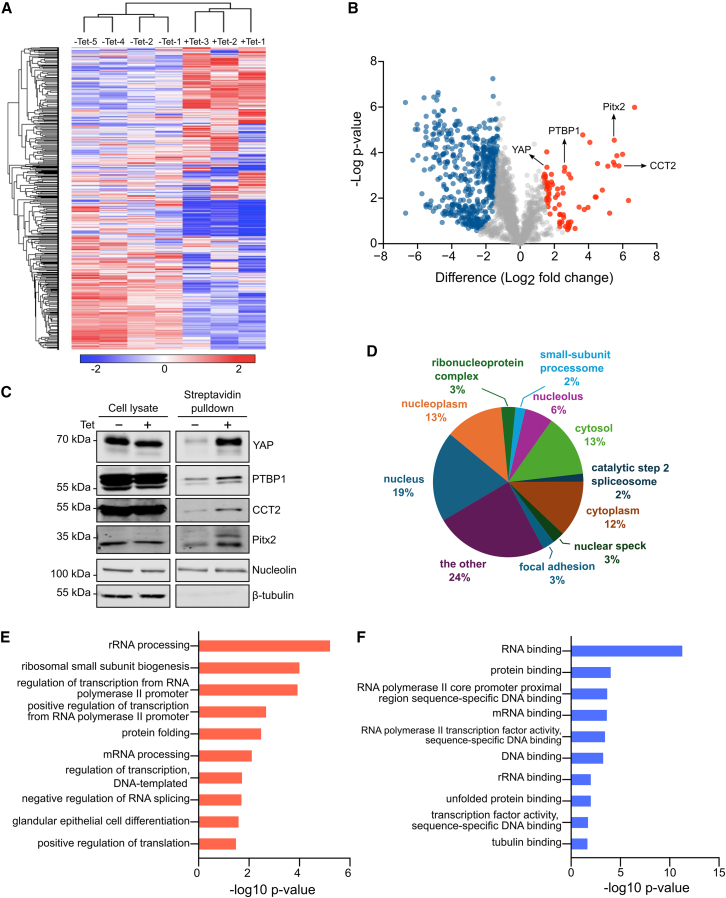
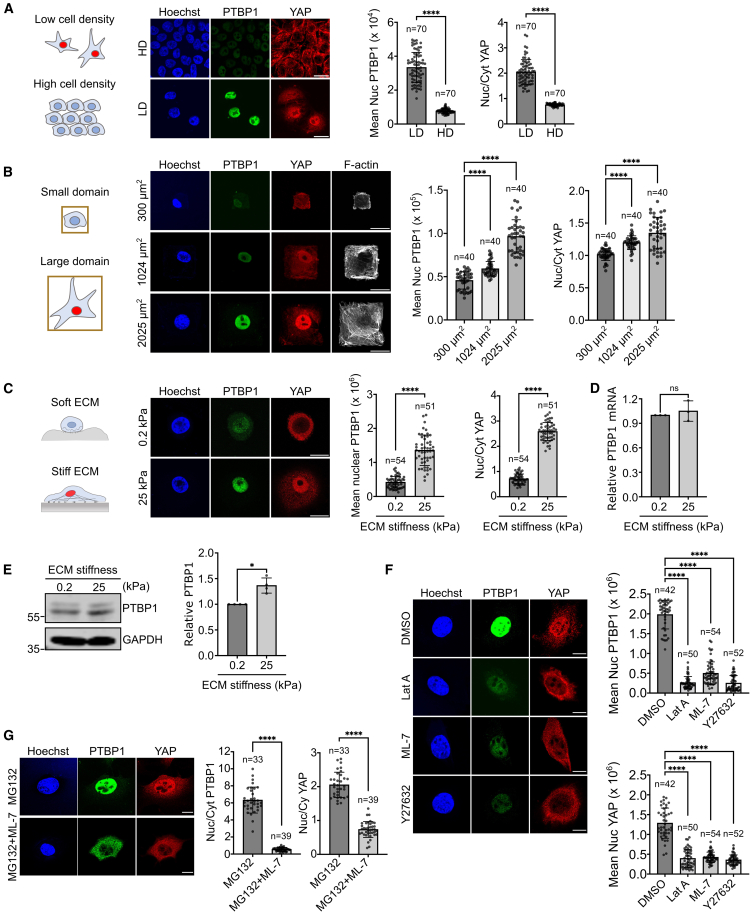
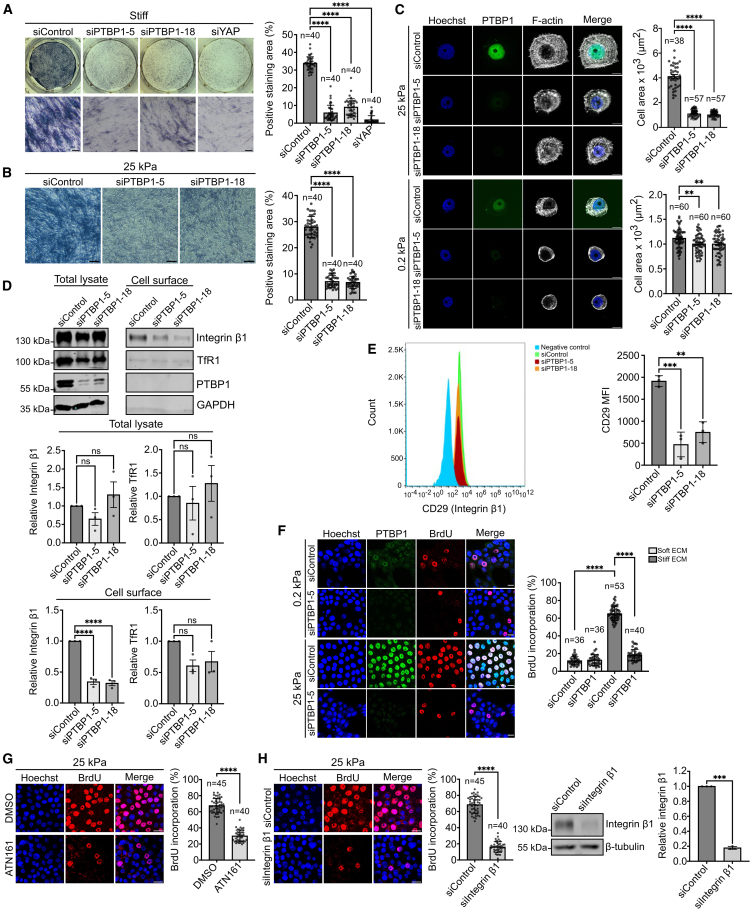
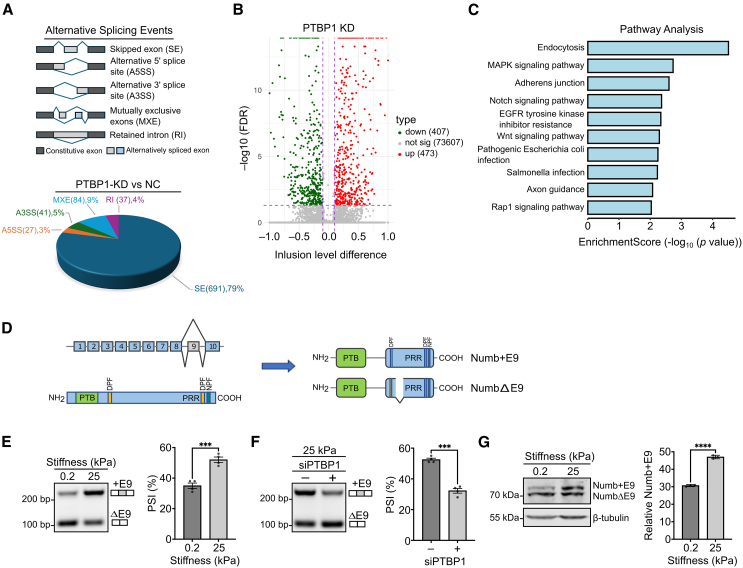
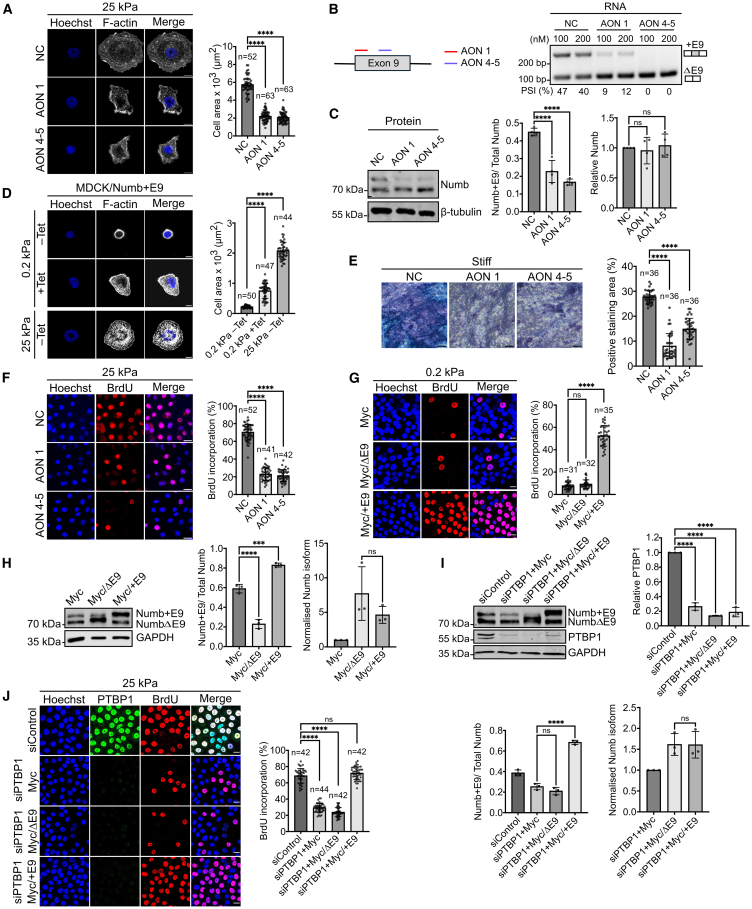
Cells sense mechanical cues and convert them into biochemical responses to regulate biological processes such as embryonic development, aging, cellular homeostasis, and disease progression. In this study, we introduce a large-scale, systematic approach to identify proteins with mechanosensitive nuclear localization, highlighting their potential roles in mechanotransduction. Among the proteins identified, we focus here on the splicing factor PTBP1. We demonstrate that its nuclear abundance is regulated by mechanical cues such as cell density, size, and extracellular matrix (ECM) stiffness and that PTBP1 medicates the mechanosensitive alternative splicing of the endocytic adapter protein Numb. Furthermore, we show that PTBP1 and Numb alternative splicing is critical for ECM stiffness-induced epithelial cell spreading and proliferation as well as for mesenchymal stem cell differentiation into osteoblasts on a stiff matrix. Our results underscore the emerging role of alternative splicing in mechanotransduction and provide novel mechanistic insights into how matrix stiffness modulates cellular mechanoresponses.

Keywords: Cell biology; Functional aspects of cell biology; Organizational aspects of cell biology.


Conflict of interest statement

The authors declare no competing interest.

Figures

None
Graphical abstract
Figure 1
Figure 1
Screen approach to identify proteins potentially involved in mechanotransduction and its validation (A) Overview of the approach used for the screen. The diagram was created with BioRender.com. (B) Scheme of nuclear translocation induced by tetracycline induced contractility at high cell density. (C) Detection of traction force in HEK293-tet-RhoA before and after 2 h of tetracycline treatment. Cells were visualized by staining of nuclei. Red arrows indicated the force direction. Bar represents 20 μm. (D) Left panel: western blot showing HEK293-tet-RhoA expressed constitutively active RhoA by tetracycline induction in a time-dependent manner. γ-adaptin was used as loading control. Right panel: Quantification of traction stress in HEK293-tet-RhoA before and after tetracycline treatment. Data was analyzed by unpaired t-test. (E) Immunofluorescence and quantification of nuclear to cytoplasmic ratio of YAP in HEK293-tet-RhoA treated with or without tetracycline for 2 h. Bar represents 15 μm. Data were analyzed by unpaired t-test. (F) Biochemical purification of nuclear proteins using the approach described in (A). Biotinylated proteins were collected using streptavidin pulldown and probed by western blot using the indicated antibodies. Nucleolin and β-tubulin were used as nuclear and cytosolic marker respectively. Quantification shows normalized YAP expression. Data were analyzed by unpaired t-test. Replicates = 3 in all experiments. n = number of cells analyzed. Values are means ± s.d. ∗p < 0.05, ∗∗p < 0.01, ∗∗∗∗p < 0.0001.
Figure 2
Figure 2
Nuclear proteome dynamics in response to constitutive active RhoA expression (A) Hierarchical cluster analysis of proteins showing increased or decreased abundance in the nucleus in HEK293-tet-RhoA-TurboID cells after 2 h tetracycline treatment. Rows represent clustering of proteins and columns represent the clustering of samples. (B) Volcano plot of proteins significantly enriched or reduced in the nucleus following the approach described in Figure 1A and using the same data as used for the hierarchical cluster analysis. Red dots in the right area represent proteins significantly increased in the nucleus after tetracycline treatment while blue dots indicate proteins significantly decreased in the nucleus by tetracycline treatment. (C) Validation of upregulated candidates identified in the volcano plot in B. Samples were prepared as described in Figure 1A and probed by western blot using indicated antibodies. (D) Distribution of main subcellular localizations of proteins found significantly increased in B. (E) Gene ontology based on biological process (GOBP) analysis of proteome data showing the top 10 GO terms with significant enrichment after tetracycline treatment. (F) Gene ontology based on molecular function (GOMF) analysis of proteome data revealed the top 10 most enriched GO terms after tetracycline treatment. All the proteome data were analyzed by DAVID database (https://david.ncifcrf.gov/) and the criteria of differentially enriched nuclear proteins as permutation-based FDR <0.05 with a Log2 nuclear enrichment >1.5.
Figure 3
Figure 3
Nuclear abundance of PTBP1 is regulated by mechanical cues (A) Left and Middle: MCF10A cells were plated at high and low cell density and subcellular localization of PTBP1 and YAP was determined by immunofluorescence using the indicated antibodies. Right: Quantification shows the nuclear intensity for PTBP1 and the nuclear to cytoplasmic ratio for YAP at low cell density (LD) or high cell density (HD). Data were analyzed by unpaired t-test. (B) Mesenchymal stem cells (MSC) were plated on fibronectin coated micropattern of defined size. PTBP1 and YAP in single cell of each domain were measured using immunofluorescence microscopy. Quantification was performed by ordinary one-way ANOVA. (C) Left and Middle: 1x10⁵ MCF10A were plated on 35mm of soft (0.2kPa) or stiff (25kPa) collagen coated PAA gels to reach low cell density and the subcellular localization of PTBP1 and YAP was quantified as described in (A). (D) Quantitative PCR for PTBP1 mRNA from MCF10A cultured either on soft (0.2kPa) or stiff (25kPa) matrix. Data were analyzed by unpaired t-test. (E) Western blot for PTBP1 using total protein extracts from MCF10A cells cultured on soft or stiff matrix. Data analysis was performed by unpaired t-test. Experiment replicates = 4. (F) NIH3T3 fibroblasts were cultured at low cell density on plastic (stiff) and either treated with DMSO (control), Latrunculin A (Lat.A), Myosin light-chain kinase inhibitor-7 (ML-7) or the Rho kinase inhibitor Y27632 for 30 min. Cells were fixed and indicated proteins were identified by immunofluorescence. The mean nuclear intensities for PTBP1 and YAP after incubation with the inhibitors was quantified. Data were analyzed by ordinary one-way ANOVA. (G) NIH3T3 fibroblasts were incubated with the indicated inhibitors or combination of inhibitors and the subcellular localization of PTBP1 and YAP were assessed using immunofluorescence. The nuclear/cytosol ratio for PTBP1 and YAP in cells treated with indicated inhibitor was quantified. Data were analyzed by unpaired t-test. Replicates = 3 in all experiments unless stated otherwise. n = numbers of cells analyzed. Values are means ± s.d. ∗p < 0.05, ∗∗∗∗p < 0.0001, ns: not significant. Bar in immunofluorescence images of A-C represents 20 μm, in images of F-G represents 10 μm.
Figure 4
Figure 4
PTBP1 is important for cellular mechanoresponses (A) Mesenchymal stem cells were cultured on plastic (stiff) and transfected with the indicated siRNAs. Osteoblastic differentiation was quantified using alkaline phosphatase staining. Bar represents 100 μm and refers to the bottom images. Data were analyzed using ordinary one-way ANOVA. (B) Mesenchymal stem cells were cultured on collagen coated stiff PAA gels (25 kPa), transfected with the indicated siRNAs and osteoblastic differentiation was quantified as described in (A). Bar represents 100 μm. (C) MCF10A cells transfected with the indicated siRNAs and seeded on stiff (25 kPa) or soft (0.2 kPa) collagen coated PAA gels. Cells were stained with F-actin for measurement of spreading area. Knockdown was confirmed by PTBP1 immunofluorescence. Bar represents 10 μm. Data were analyzed using ordinary one-way ANOVA. (D) MCF10A cells were transfected with the indicated siRNAs followed by a surface biotinylation assay. Total proteins and cell surface proteins were analyzed by western blot using indicated antibodies. Bar diagrams represent the quantification of the experiments. Data were analyzed by ordinary one-way ANOVA. (E) MCF10A cells were transfected with the indicated siRNAs and the surface amount of integrin β1 (CD29) was quantified using flow cytometry. Data were analyzed by ordinary one-way ANOVA. (F) MCF10A cells were cultured on stiff (25 kPa) or soft (0.2 kPa) collagen coated PAA gels and transfected with the indicated siRNAs. Proliferation rate and knockdown was determined by immunofluorescence. Bar diagram shows the quantification of BrdU incorporation. Bar represents 20 μm. Data were analyzed by ordinary one-way ANOVA. (G) MCF10A cells were cultured on stiff (25 kPa) collagen coated PAA gels and treated with 50 μM ATN161 inhibitor overnight. Proliferation rate was quantified using the BrdU assay. Bar represents 50 μm. Data were analyzed by unpaired t-test. (H) MCF10A cells were seeded on stiff (25 kPa) collagen coated PAA gels and transfected with the indicated siRNAs. Knockdown was confirmed by western blot and proliferation rate was quantified by BrdU assay. Bar represents 50 μm. Data were analyzed by unpaired t-test. Three replicates in all experiments. n = numbers of cells analyzed or in the case of BrdU assays refers to the number of analyzed microscopic fields. All values are means ± s.d. ∗∗p < 0.01, ∗∗∗p < 0.001, ∗∗∗∗p < 0.0001, ns: not significant.
Figure 5
Figure 5
PTBP1 regulates matrix stiffness dependent splicing of Numb (A) Percentage and absolute number of changed alternative splicing events after PTBP1 knockdown categorized by splicing type. (B) Volcano plot showing up or downregulated alternative splicing events after PTBP1 knockdown. (C) Pathway analysis of all changed alternative splicing events after PTBP1 knockdown. (D) Top left: Exon-intron structure of Numb. Bottom left: Modular structure of the Numb protein, PTB = phosphotyrosine binding domain, PRR = proline rich region. Right: Modular structure of Numb showing the localization of the 49 amino acid inserts encoded by exon 9. (E) MCF10A cells were cultured on stiff (25 kPa), or soft (0.2 kPa) collagen coated PAA gels for 5 days. Expression of exon 9 inclusion (+E9) or exclusion (ΔE9) mRNA isoform was assessed using reverse transcription followed by PCR. The percent splicing inclusion (PSI) of +E9 isoform was calculated as the inclusion level (%) of the +E9 isoform over the sum of +E9 and ΔE9 isoforms. Experiment replicates = 4. Statistical analysis was performed by unpaired t-test. (F) MCF10A cells were cultured on stiff (25 kPa) collagen coated PAA gels and transfected with the siRNA targeting PTBP1 or control siRNA. The PSI (%) of exon 9 mRNA was determined as described in (E). Statistical analysis was performed by unpaired t-test. Experiment replicates = 4. (G) MCF10A cells cultured on stiff (25 kPa) or soft (0.2 kPa) collagen coated PAA gels for 5 days. Total protein was isolated and analyzed by western blot using the indicated antibodies. β-tubulin was used as loading control. Exon 9 inclusion was determined by densitometric quantification of corresponding western blot. Replicates = 3 in all experiments unless stated otherwise. Data were analyzed by unpaired t-test. All values are means ± s.d. ∗∗∗p < 0.001, ∗∗∗∗p < 0.0001.
Figure 6
Figure 6
Alternative splicing of Numb controls cellular mechanoresponses (A) MCF10A cells were transfected with the indicated antisense oligonucleotides (AONs) and seeded on stiff (25 kPa) collagen coated PAA gels. Cells were stained for F-actin and spread area was quantified. Bar represents 10 μm. (B) MCF10A cells were transfected with the indicated AONs and alternative splicing changes were assessed by RT-PCR. (C) Total protein lysate from MCF10A transfected with indicated AONs was analyzed by western blot using the indicated antibodies. Bar plot shows the quantification of relative Numb+E9 isoform and total Numb protein expression, respectively. Experiments = 4. (D) MDCK cells stably expressing the +E9 Numb isoform under a tetracycline inducible promoter were treated with (+) or without tetracycline (−) for 4 h and plated on soft (0.2 kPa) or stiff (25 kPa) collagen coated PAA gels for 20 h. Cells were fixed and stained with F-actin and the spread area was measured. Bar represents 10 μm. (E) Mesenchymal stem cells were cultured on stiff matrix (plastic) and transfected with the indicated AONs or AON scramble (NC). Osteoblastic differentiation was quantified by an alkaline phosphatase assay. Bar represents 100 μm. (F) MCF10A cells were cultured on stiff (25 kPa) PAA gels and transfected with the indicated AONs. Cell proliferation was quantified using a BrdU assay. Bar represents 50 μm. (G) MCF10A cells were transfected with the isoform specific Numb expression constructs and plated on soft (0.2 kPa) collagen coated PAA gels. Cell proliferation was measured using a BrdU assay. Bar represents 20 μm. (H) Quantification of overexpression of Numb isoforms of the experiment described in (G) via western blotting. Left bar diagram shows quantification of Numb+E9 isoform overexpression as percentage of Numb+E9 of total Numb expression. Right bar diagram shows the relative expression of each Numb isoforms normalized to the level of NumbΔE9 of Myc control. (I) MCF10A were cultured on 25 kPa PAA gels and transfected with indicated siRNA and Numb isoform specific expression constructs. Upper panel: Western blot confirms PTBP1 knockdown. Lower panel: Quantification of Numb overexpression as described in (H). (J) Cell proliferation of cells analyzed in I was quantified using BrdU assay. Bar represents 20 μm. Replicates = 3 in all experiments unless stated otherwise. n = numbers of cells analyzed or in the case of BrdU assays refers to the number of analyzed microscopic fields. All data analysis was performed by ordinary one-way ANOVA. Values are means ± s.d. ∗∗∗p < 0.001, ∗∗∗∗p < 0.0001, ns: not significant.

Similar articles

References

    1. Wozniak M.A., Chen C.S. Mechanotransduction in development: a growing role for contractility. Nat. Rev. Mol. Cell Biol. 2009;10:34–43. doi: 10.1038/nrm2592. - DOI - PMC - PubMed
    1. Gilbert P.M., Weaver V.M. Cellular adaptation to biomechanical stress across length scales in tissue homeostasis and disease. Semin. Cell Dev. Biol. 2017;67:141–152. doi: 10.1016/j.semcdb.2016.09.004. - DOI - PMC - PubMed
    1. Hannezo E., Heisenberg C.P. Mechanochemical Feedback Loops in Development and Disease. Cell. 2019;178:12–25. doi: 10.1016/j.cell.2019.05.052. - DOI - PubMed
    1. Elosegui-Artola A., Andreu I., Beedle A.E.M., Lezamiz A., Uroz M., Kosmalska A.J., Oria R., Kechagia J.Z., Rico-Lastres P., Le Roux A.L., et al. Force Triggers YAP Nuclear Entry by Regulating Transport across Nuclear Pores. Cell. 2017;171:1397–1410.e14. doi: 10.1016/j.cell.2017.10.008. - DOI - PubMed
    1. Maurer M., Lammerding J. The Driving Force: Nuclear Mechanotransduction in Cellular Function, Fate, and Disease. Annu. Rev. Biomed. Eng. 2019;21:443–468. doi: 10.1146/annurev-bioeng-060418-052139. - DOI - PMC - PubMed