. 2025 Mar 22;28(4):112266.
doi: 10.1016/j.isci.2025.112266. eCollection 2025 Apr 18.

CRISPR/Cas9-mediated SHP-1-knockout T cells combined with simvastatin enhances anti-tumor activity in humanized-PDX HCC model

Affiliations

CRISPR/Cas9-mediated SHP-1-knockout T cells combined with simvastatin enhances anti-tumor activity in humanized-PDX HCC model

Huaping Liu et al. iScience. .

Abstract

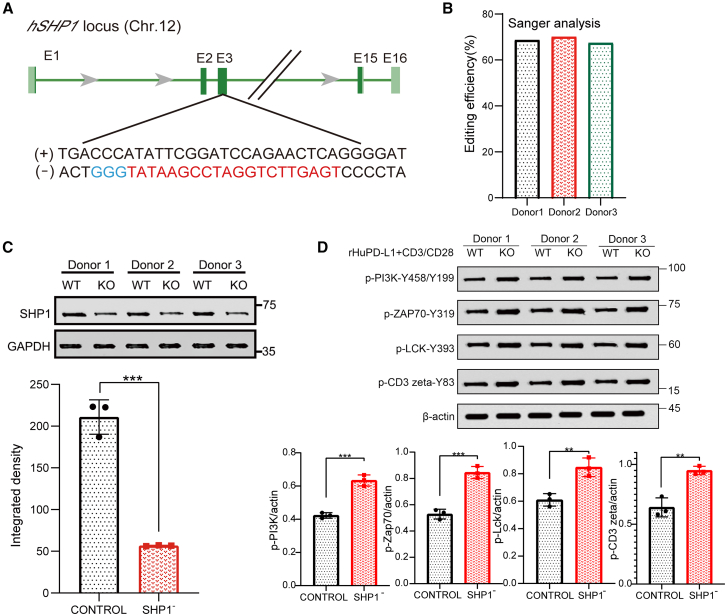
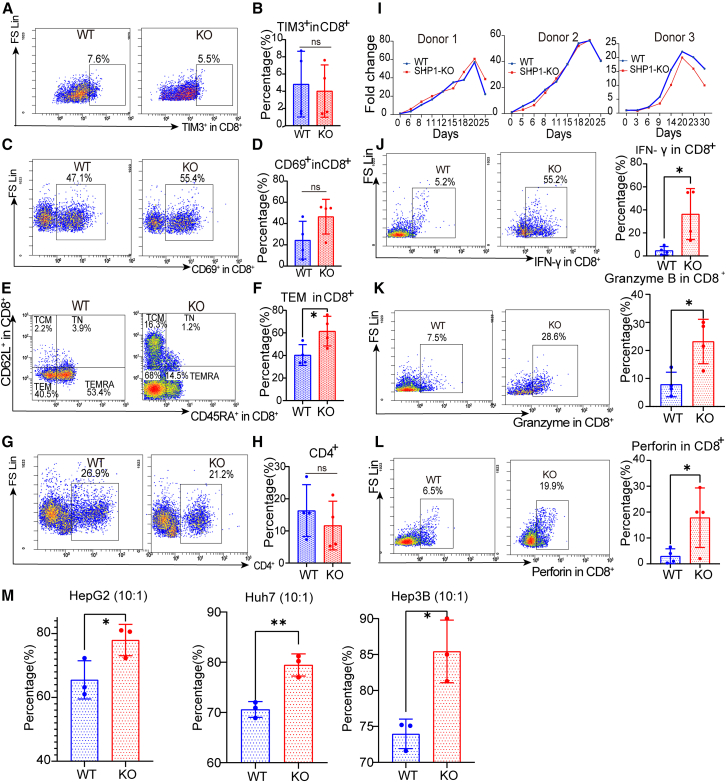
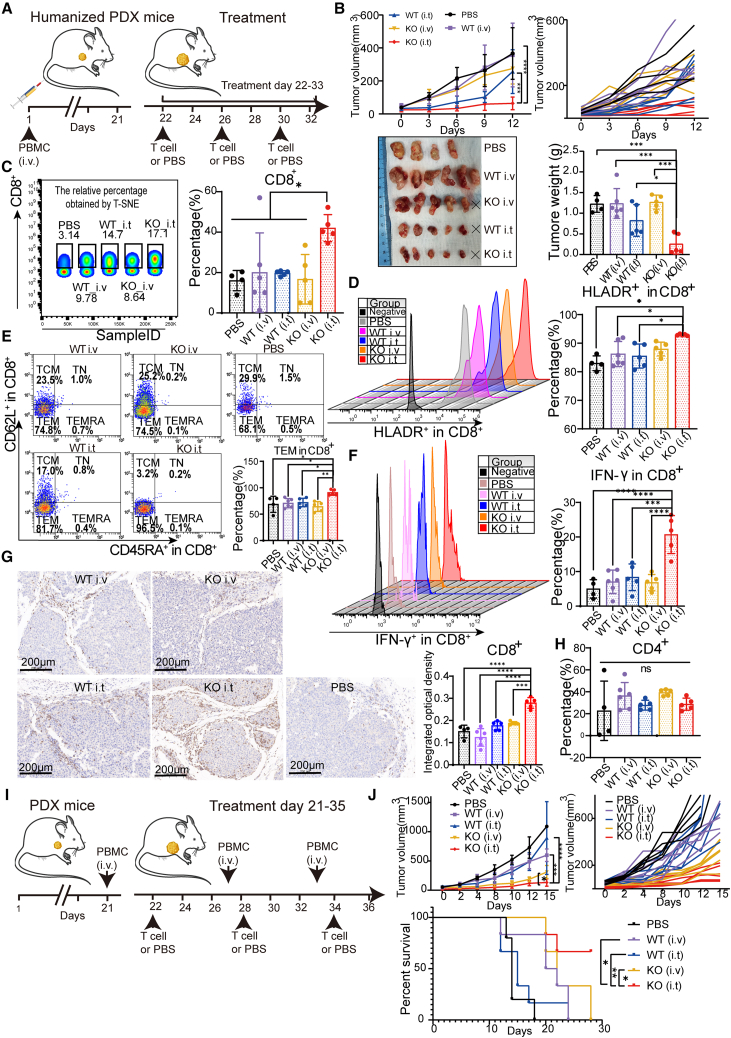
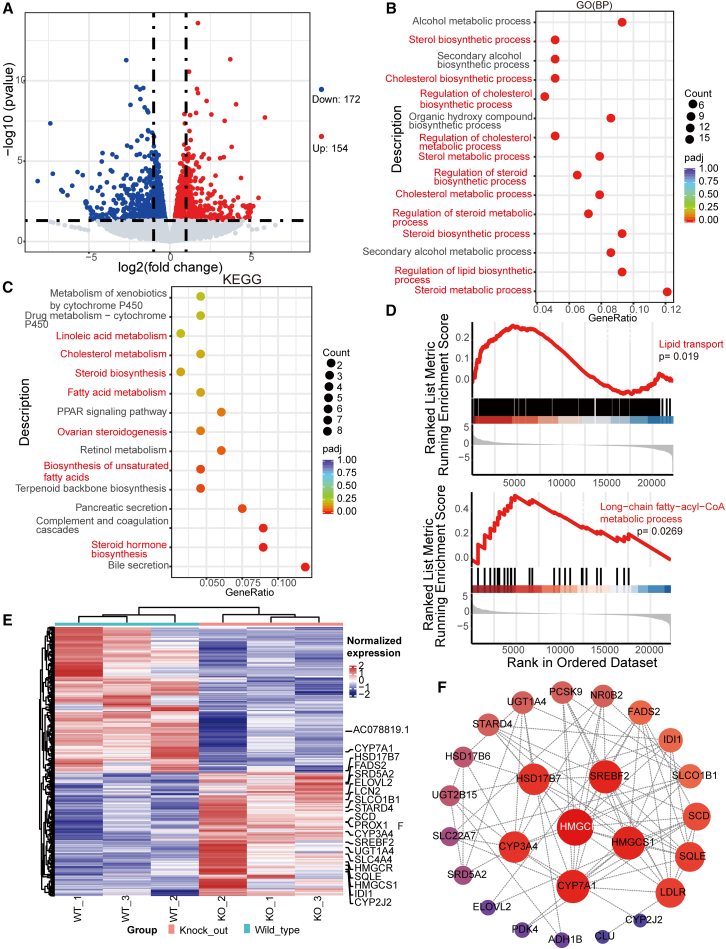
Hepatocellular carcinoma (HCC) resists immunotherapy due to its immunosuppressive microenvironment. Sarcoma homology 2 domain-containing protein tyrosine phosphatase-1 (SHP-1) inhibits T cell receptor signaling, and its pharmacological inhibition is limited by poor selectivity and membrane permeability. Here, we generated CRISPR-edited SHP-1-knockout (KO) CD8+ T cells to enhance adoptive therapy against HCC. Single-cell RNA sequencing of HCC patient T cells revealed elevated SHP-1 in exhausted subsets. SHP-1-KO T cells exhibited increased effector memory T cells (TEM) proportions and enhanced IFN-γ/Granzyme B/perforin secretion, improving cytotoxicity against HCC lines. In humanized PDX models, SHP-1-KO T cells demonstrated superior tumor-killing activity. Transcriptomics identified upregulated lipid metabolism pathways, with HMGCR as a hub gene. Combining SHP-1-KO T cells with simvastatin (HMGCR inhibitor) synergistically amplified anti-HCC efficacy. This study proposes a dual strategy combining SHP-1-targeted cell therapy and metabolic modulation to overcome immunotherapy resistance, offering a translatable approach for HCC treatment.

Keywords: Biological sciences; Cancer; Cancer systems biology; Natural sciences; Systems biology.


Conflict of interest statement

The authors declare no competing interests.

Figures

None
Graphical abstract
Figure 1
Figure 1
Single-cell RNA sequencing (scRNA-seq) profiling of intratumoral T cell SHP-1 expression in advanced HCC (A) T-distributed stochastic neighbor embedding (t-SNE) plot, showing the annotation and color codes for cell types in the advanced HCC ecosystem. The number of patients is provided in the figure. (B) t-SNE plot showing the defined T cell subsets. (C) Heatmap showing the expression of marker genes in the indicated T cell types. (D) Violin plot showing the expression of SHP1 in T cell subsets. ∗∗∗p < 0.001, as assessed using a one-way analysis of variance with Tukey’s multiple comparisons post hoc test (D).
Figure 2
Figure 2
Knockout and post-knockout validation of T cells (A) Structure of the sgRNA, with the sgRNA sequence and protospacer adjacent motif shown in red and blue, respectively. (B) Efficiency of the knockout determined using Sanger sequencing. (C) Western blotting of SHP-1 expression in the knockout and wild-type groups. (D) Western blotting of the phosphorylation level of the SHP-1 target protein. Each group included three samples (n = 3). ∗∗p < 0.01, ∗∗∗p < 0.001, and ∗∗∗∗p < 0.0001, as assessed using a one-way analysis of variance with Tukey’s multiple comparisons post hoc test (C, D). Data are presented as mean ± standard deviation (SD). WB, western blotting.
Figure 3
Figure 3
Phenotypic and functional changes of T cell subsets in knockout (KO) and wild-type (WT) groups (A–F) Expression levels of TIM3 (A, B), CD69 (C, D), and CD62L and CD45RA (E, F) in CD8+ T cells. (G and H) Changes in CD4+ T cells (n = 4 in each group). (I) T cell proliferation curves from three healthy volunteers. (J–L) Secretion of IFN-γ (J), Granzyme B (K), and Perforin (L) in KO and WT groups. (M) Proportion of killed cells when the effector-target ratio of T cells to Hep3B, Huh7, and HepG2 was 10:1. Each group comprised four samples (n = 4). ∗p < 0.05 and ∗∗p < 0.01, as assessed using a one-way analysis of variance with Tukey’s multiple comparisons post hoc test (B, D, F, H) and unpaired Student’s t test (J–M). Data are presented as mean ± SD. ns, no significance; KO, knockout; WT, wild type; Sti, stimulation; TCM, central memory T cells; TN, naive T cells; TEM, effector memory T cells; TEMRA, terminal effector memory CD62LCD45RA+; SD, standard deviation.
Figure 4
Figure 4
Anti-tumor effect of SHP-1-KO T cells in hepatocellular carcinoma (HCC) patient-derived xenograft (PDX) models (A) Tumor growth curve, size, and weight after T cell treatment in PDX-5 model, with groups receiving PBS, i.t. injections of WT T cells, and i.v. injections of KO and WT T cells (n = 4 for KO-i.v. and WT-i.v. groups, n = 3 for PBS and WT-i.t. groups). (B) Relative proportion and quantitative analysis of CD8+ T cells in each group of the PDX-5 model. The relative proportion of CD8+ T cells was obtained by removing bad events in FlowJo using FlowAI, an R plug-in, homogenizing good events through downsampling, and employing t-SNE for dimensionality reduction to display the relative proportion of CD8+ T cells in the four samples. (C) Proportion and quantitative analysis of HLADR+ expression in CD8+ T cells in each group of the PDX-5 model. (D) Proportion and quantitative analysis of TIM3+ expression in CD8+ T cells in each group of the PDX-5 model. (E) Proportion and quantitative analysis of TCM, TN, TEM, and TEMRA in CD8+ T cells of each group in the PDX-5 model. (F) IFN-γ secretion level and quantitative analysis of CD8+ T cells in each group of the PDX-5 model. (G) Fluorescent TUNEL test and positive cell ratio of paraffin sections of each group in PDX-5 model. ∗p < 0.05, ∗∗p < 0.01, ∗∗∗p < 0.001, and ∗∗∗∗p < 0.0001, as assessed using a two-way analysis of variance (ANOVA) with Tukey’s multiple comparisons post hoc test (A) and one-way ANOVA with Tukey’s multiple comparisons post hoc test (A–G). Data are presented as mean ± SD. t-SNE, t-distributed stochastic neighbor embedding; TCM, central memory T cells; TN, naive T cells; TEM, effector memory T cells; TEMRA, terminal effector memory CD62LCD45RA+. ns, no significance. i.t., intratumoral injection; i.v., tail vein injection; TUNEL, terminal deoxynucleotidyl transferase dUTP nick end labeling; IFN-γ, interferon-gamma; KO, knock out; WT, wild-type; PBS, phosphate-buffered saline; SHP-1, sarcoma homology 2 domain-containing protein tyrosine phosphatase 1.
Figure 5
Figure 5
Anti-tumor effect of SHP-1-KO T cells in humanized HCC PDX models (A) Schematic of the first humanized protocol and treatment scheme for the PDX-4 model (PDX-4-1). (B) Tumor growth curve, size, and weight after T cell therapy in the humanized PDX-4-1 model (PBS group n = 4, KO-i.t. group, KO-i.v. group, WT-i.t. group n = 5, and WT-i.v. group n = 6). (C) Relative proportion and quantitative analysis of CD8+ T cells in each group of the humanized PDX-4-1 model. The relative proportion of CD8+ T cells was obtained by removing bad events in FlowJo using FlowAI, an R plug-in, homogenizing good events through downsampling, and employing t-SNE for dimensionality reduction to display the relative proportion of CD8+ T cells in the five samples. (D) Proportion and quantitative analysis of HLADR+ expression in CD8+ T cells in each group of the humanized PDX-4-1 model. (E) Proportion and quantitative analysis of TCM, TN, TEM, and TEMRA groups in CD8+ T cells in the humanized PDX-4-1 model. (F) Secretion level and quantitative analysis of IFN-γ in CD8+ T cells in the humanized PDX-4-1 model. (G) Immunohistochemical staining of CD8+ T cells in each group of the humanized PDX-4-1 model and the average optical density of each group. (H) Analysis of the proportion of CD4+ T cells in each group of the humanized PDX-4-1 model. (I) Schematic of the second humanized protocol for the PDX-4 model (PDX-4-2), PBMC was infused the day before editing T cell infusion (PBS group n = 5, KO-i.t., KO-i.v., WT-i.t., and WT-i.v. groups n = 6). (J) Tumor growth curve and survival analysis of each group during the treatment of the humanized PDX-4-2 model. ∗p < 0.05, ∗∗p < 0.01, ∗∗∗p < 0.001, and ∗∗∗∗p < 0.0001, as assessed using a two-way analysis of variance (ANOVA) with Tukey’s multiple comparisons post hoc test (B and J), one-way ANOVA with Tukey’s multiple comparisons post hoc test (B–H) and log rank test (J). Data are presented as mean ± SD. t-SNE, t-distributed stochastic neighbor embedding; TCM, central memory T cells; TN, naive T cells; TEM, effector memory T cells; TEMRA, terminal effector memory CD62LCD45RA+. ns, no significance. i.t., intratumoral injection; i.v., tail vein injection. × dead; HCC, hepatocellular carcinoma; PDX, patient-derived xenograft; SHP-1, sarcoma homology 2 domain-containing protein tyrosine phosphatase 1; IFN-γ, interferon-gamma; KO, knock out; WT, wild-type; PBS, phosphate-buffered saline; SD, standard deviation.
Figure 6
Figure 6
Bulk RNA-seq results of tumor specimens from the KO (i.t.) and WT (i.t.) groups in PDX-3 and PDX-4-1 models (A) Distribution of up- and down-regulated genes in the PDX-3 model. (B) Top 15 pathways enriched in GO (BP) analysis of up-regulated genes in the PDX-3 model KO (i.t.) group compared with the WT (i.t.) group. (C) Top 15 pathways enriched in KEGG analysis of up-regulated genes in the PDX-3 model KO (i.t.) group compared with the WT (i.t.) group. (D) GSEA analysis of up-regulated genes in the KO (i.t.) group related to the WT (i.t.) group in the PDX-4-1 model. (E) Expression values of all differential genes in the KO (i.t.) group of the PDX-3 model related to the WT (i.t.) group, with individual labeling of lipid metabolism pathway-related genes. (F) Protein–protein interaction (PPI) networks plots of the top 25 lipid metabolism pathway-related genes in the PDX-3 model, with larger circles and redder colors indicating higher weights. n = 3/groups; red marker pathway: related to lipid metabolism. PPI, Protein–protein Interaction Networks. i.t., intratumoral injection; i.v., tail vein injection; GO, Gene Ontology; KEGG, Kyoto Encyclopedia of Genes and Genomes; BP, biological process; GSEA, Gene Set Enrichment Analysis.
Figure 7
Figure 7
Combining edited T cells with simvastatin exerts significant anti-tumor effects in the HCC PDX model (A) Cytotoxicity assay of T cells in combined with simvastatin. (B) Humanization protocol and treatment regimen for the PDX-4-3 model. (C) Tumor growth curves, tumor specimen sizes, and tumor weights changes during treatment in each group at the experimental cutoff point. (PBS group n = 3, DMSO group n = 3, simvastatin group n = 6, edited T cell group n = 6, and combination drug group n = 6). (D) Liver function indexes, including ALT, AST, TBIL, DBIL, ALP, and γ-GT, were measured in all groups of mice. ∗p < 0.05, ∗∗p < 0.01, as assessed using a two-way analysis of variance (ANOVA) with Tukey’s multiple comparisons post hoc test (A, C) and one-way ANOVA with Tukey’s multiple comparisons post hoc test (C, D). Data are presented as mean ± SD. ALT, Alanine aminotransferase; AST, Aspartate aminotransferase; TBIL, Total bilirubin; DBIL, Direct Bilirubin; ALP, Alkaline phosphatase; γ-GT, γ- Gamma-glutamyl transpeptidase. ns, no significance. i.t., intratumoral injection; i.v., tail vein injection; i.p, intraperitoneal injection.; HCC, hepatocellular carcinoma; PDX, patient-derived xenograft; HMGCR, 3-hydroxy-3-methylglutaryl-coenzyme A (CoA) reductase.

Similar articles

Cited by

References

    1. Llovet J.M., Kelley R.K., Villanueva A., Singal A.G., Pikarsky E., Roayaie S., Lencioni R., Koike K., Zucman-Rossi J., Finn R.S. Hepatocellular carcinoma. Nat. Rev. Dis. Primers. 2021;7:6. doi: 10.1038/s41572-020-00240-3. - DOI - PubMed
    1. Llovet J.M., Zucman-Rossi J., Pikarsky E., Sangro B., Schwartz M., Sherman M., Gores G. Hepatocellular carcinoma. Nat. Rev. Dis. Primers. 2016;2 doi: 10.1038/nrdp.2016.18. - DOI - PubMed
    1. Villanueva A. Hepatocellular Carcinoma. N. Engl. J. Med. 2019;380:1450–1462. doi: 10.1056/NEJMra1713263. - DOI - PubMed
    1. Wolchok J.D., Neyns B., Linette G., Negrier S., Lutzky J., Thomas L., Waterfield W., Schadendorf D., Smylie M., Guthrie T., Jr., et al. Ipilimumab monotherapy in patients with pretreated advanced melanoma: a randomised, double-blind, multicentre, phase 2, dose-ranging study. Lancet Oncol. 2010;11:155–164. doi: 10.1016/S1470-2045(09)70334-1. - DOI - PubMed
    1. Lorenz U. SHP-1 and SHP-2 in T cells: two phosphatases functioning at many levels. Immunol. Rev. 2009;228:342–359. doi: 10.1111/j.1600-065X.2008.00760.x. - DOI - PMC - PubMed

LinkOut - more resources