

Spatiotemporal analysis of the burden of lower respiratory infections in the older adult population due to air pollution: trends from 1990 to 2021 and predictions for the next 30 years
- PMID: 40241962
- PMCID: PMC12000020
- DOI: 10.3389/fpubh.2025.1554694
Spatiotemporal analysis of the burden of lower respiratory infections in the older adult population due to air pollution: trends from 1990 to 2021 and predictions for the next 30 years
Abstract
Background: Lower respiratory infections (LRI), caused by various pathogens, have significant impacts on global health. Air pollution is a major environmental factor in the development of LRI, and with ongoing urbanization and industrialization, it has become a critical public health concern. The older adult population, with declining immune function and physiological capabilities, exhibits reduced resistance to air pollution, making them a high-risk group for LRI. However, the spatiotemporal trends of LRI burden in the older adult and their association with air pollution remain understudied. This study analyzes the trends in LRI burden from 1990 to 2021 in relation to air pollution and predicts future trends from 2022 to 2050.
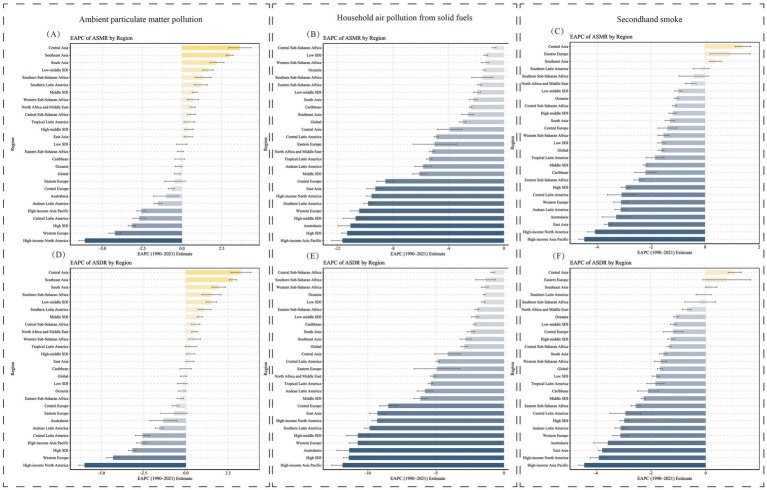
Methods: Using data from the Global Burden of Disease (GBD 2021) database, this study examines mortality rates and disability-adjusted life years (DALY) at global, regional, and national levels from 1990 to 2021. Age-standardized rates (ASR) and estimated annual percentage changes (EAPC) were used to compare burdens across regions and time periods. A Bayesian age-period-cohort (BAPC) model was applied to predict future trends. Data analysis was conducted using R programming to explore differences in burden across genders, age groups, and socioeconomic levels.
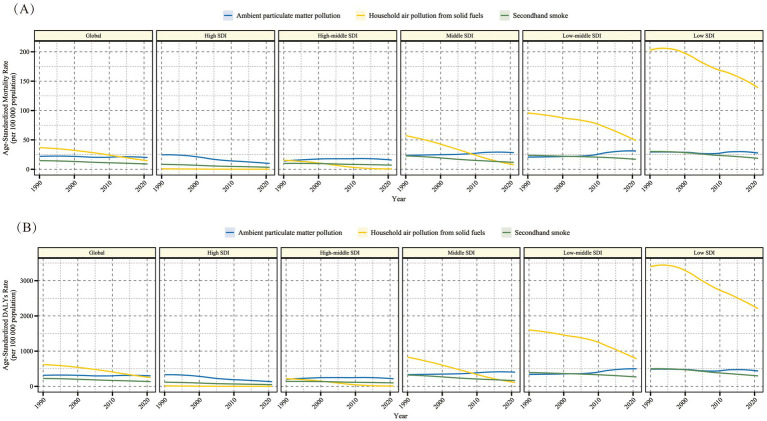
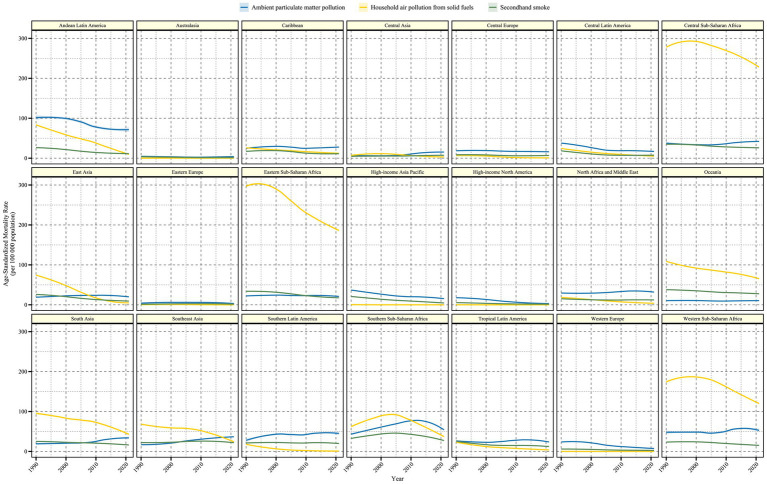
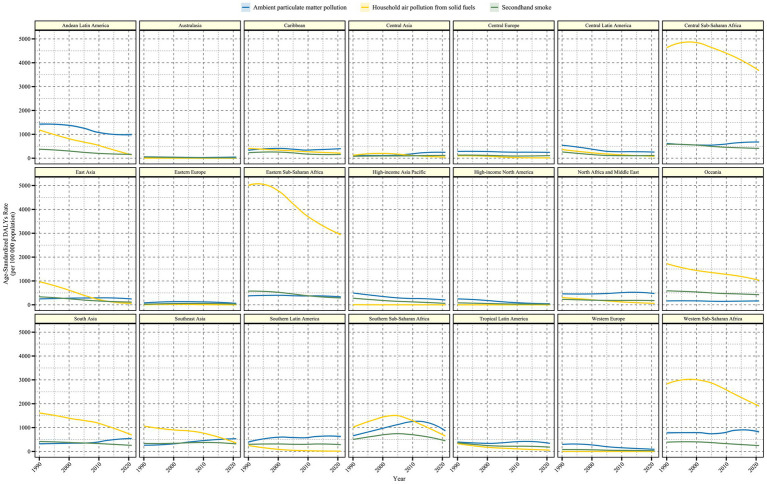
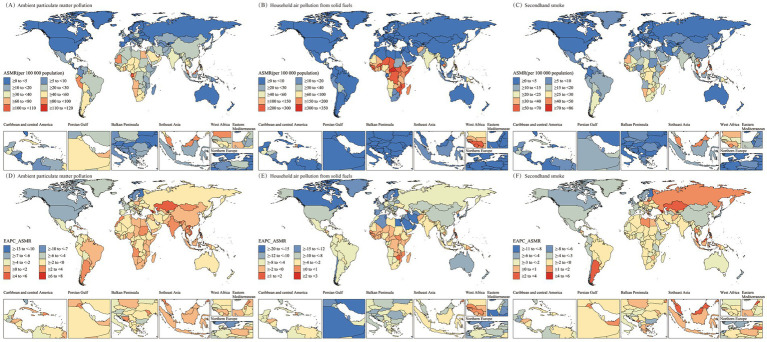
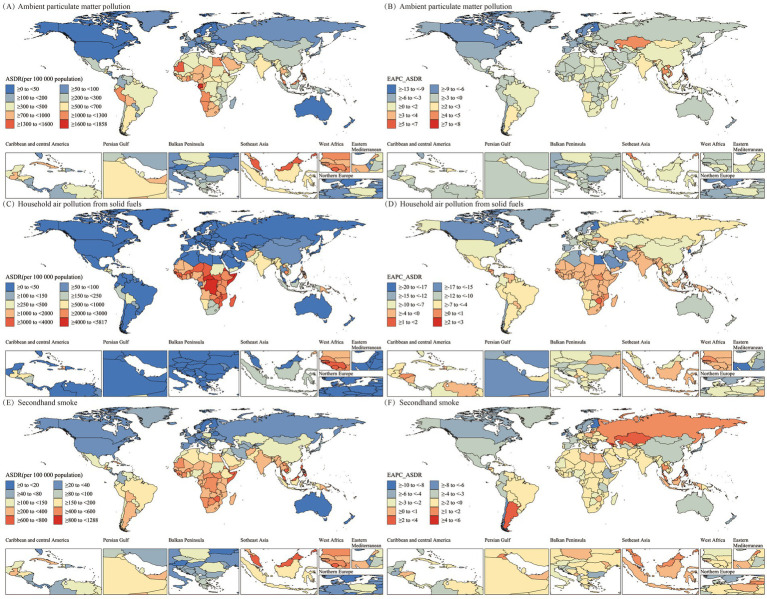
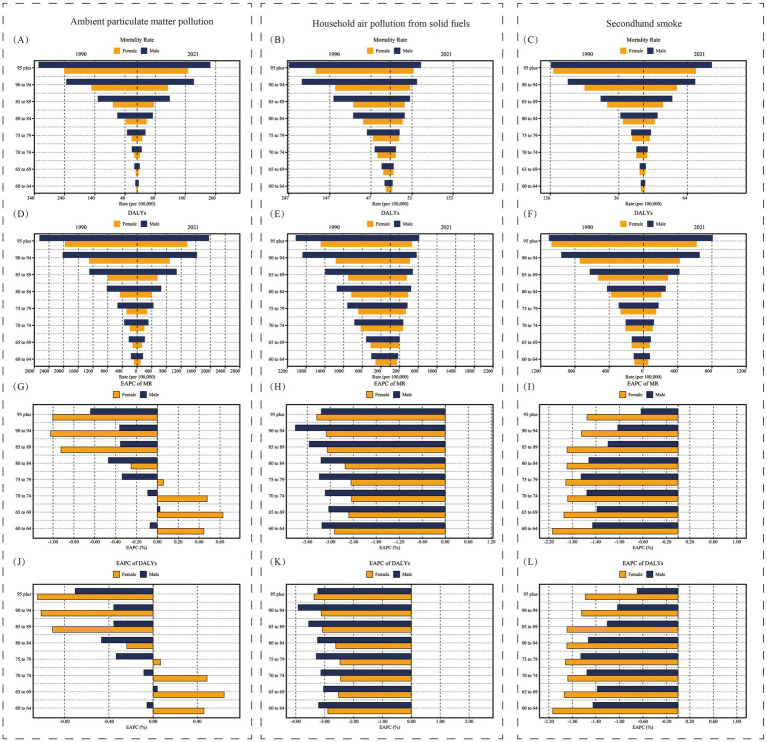
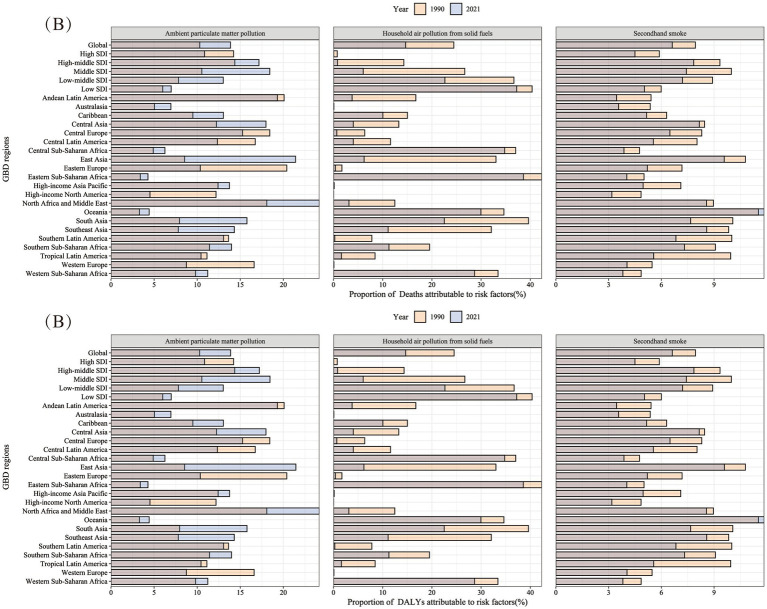
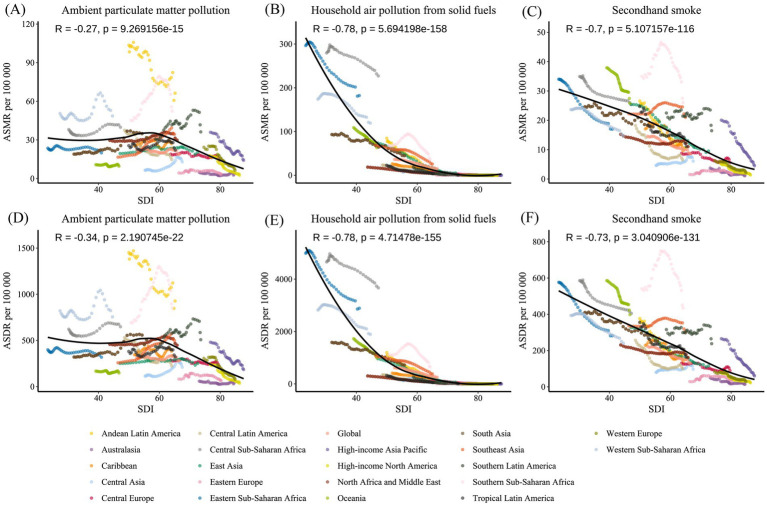
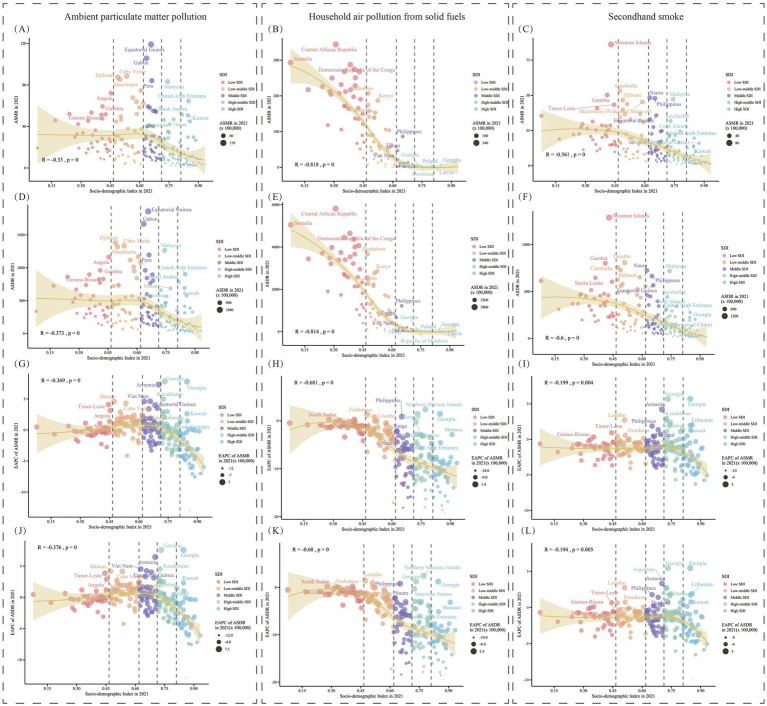
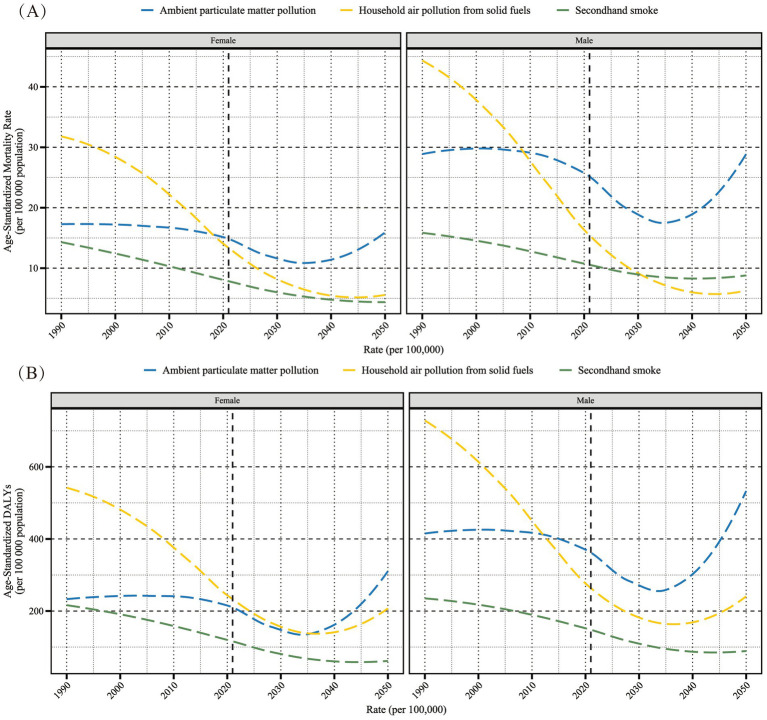
Results: From 1990 to 2021, the global burden of LRI due to air pollution generally declined, with the largest reduction in household air pollution from solid fuels. Regional differences were observed, with Asia and Africa showing increasing LRI burden from ambient particulate matter, especially in regions with lower socioeconomic development. Gender and age-specific analysis revealed that men and older populations face a higher burden, with the gap widening with age. The burden was negatively correlated with socioeconomic development. Predictions indicate a continued decrease in LRI burden due to secondhand smoke, while the LRI burden caused by ambient particulate matter and household air pollution may experience a rebound around 2035.
Conclusion: While the global burden of air pollution-related LRI in older adults has decreased, regions with lower economic development, particularly in parts of Asia and Africa, continue to face high and rising burdens. Efforts should focus on strengthening the resilience of high-risk groups and implementing targeted interventions.
Keywords: air pollution; epidemiology; global disease burden; lower respiratory infections; older adult population; trend predict.
Copyright © 2025 Lei, Sun, Li, Luo, Zhang and Zhang.
Conflict of interest statement
The authors declare that the research was conducted in the absence of any commercial or financial relationships that could be construed as a potential conflict of interest.
Figures
Similar articles
-
Temporal trends of particulate matter pollution and its health burden, 1990-2021, with projections to 2036: a systematic analysis for the global burden of disease study 2021.Front Public Health. 2025 Apr 16;13:1579716. doi: 10.3389/fpubh.2025.1579716. eCollection 2025. Front Public Health. 2025. PMID: 40308905 Free PMC article.
-
Particulate matter pollution and older adult health: global trends and disparities, 1991-2021.Front Public Health. 2024 Nov 6;12:1478860. doi: 10.3389/fpubh.2024.1478860. eCollection 2024. Front Public Health. 2024. PMID: 39568608 Free PMC article.
-
Age-sex differences in the global burden of lower respiratory infections and risk factors, 1990-2019: results from the Global Burden of Disease Study 2019.Lancet Infect Dis. 2022 Nov;22(11):1626-1647. doi: 10.1016/S1473-3099(22)00510-2. Epub 2022 Aug 11. Lancet Infect Dis. 2022. PMID: 35964613 Free PMC article.
-
Global, regional, and national incidence and mortality burden of non-COVID-19 lower respiratory infections and aetiologies, 1990-2021: a systematic analysis from the Global Burden of Disease Study 2021.Lancet Infect Dis. 2024 Sep;24(9):974-1002. doi: 10.1016/S1473-3099(24)00176-2. Epub 2024 Apr 15. Lancet Infect Dis. 2024. PMID: 38636536 Free PMC article.
-
The trends of mortality, aetiologies and risk factors of lower respiratory infections in Saudi Arabia from 1990 to 2021: results from the global burden of disease study 2021.J Health Popul Nutr. 2025 May 24;44(1):172. doi: 10.1186/s41043-025-00882-7. J Health Popul Nutr. 2025. PMID: 40413548 Free PMC article. Review.
References
-
- GBD 2021 Diseases and Injuries Collaborators. Global incidence, prevalence, years lived with disability (YLDs), disability-adjusted life-years (DALYs), and healthy life expectancy (HALE) for 371 diseases and injuries in 204 countries and territories and 811 subnational locations, 1990-2021: a systematic analysis for the global burden of disease study 2021. Lancet. (2024) 403:2133–61. doi: 10.1016/S0140-6736(24)00757-8 - DOI - PMC - PubMed
-
- GBD 2019 Lower Respiratory Infections Collaborators. Age-sex differences in the global burden of lower respiratory infections and risk factors, 1990-2019: results from the global burden of disease study 2019. Lancet Infect Dis. (2022) 22:1626–47. doi: 10.1016/S1473-3099(22)00510-2, PMID: - DOI - PMC - PubMed
MeSH terms
LinkOut - more resources
Full Text Sources
Medical
Miscellaneous