. 2025 Apr 3:82:103166.
doi: 10.1016/j.eclinm.2025.103166. eCollection 2025 Apr.

AutoCOPD-A novel and practical machine learning model for COPD detection using whole-lung inspiratory quantitative CT measurements: a retrospective, multicenter study

Affiliations

AutoCOPD-A novel and practical machine learning model for COPD detection using whole-lung inspiratory quantitative CT measurements: a retrospective, multicenter study

Fanjie Lin et al. EClinicalMedicine. .

Abstract

Background: The rate of diagnosis for chronic obstructive pulmonary disease (COPD) is low worldwide. Quantitative computed tomography (QCT) parameters add value to quantify alterations in airway and lung parenchyma for COPD. This study aimed to assess the performance of QCT features in COPD detection using a whole-lung inspiratory CT model.

Methods: This multicenter retrospective study was performed on 4106 participants. The derivation cohort containing 1950 participants who enrolled in Guangzhou communities from August 2017 to December 2019, was separated for training and internal validation cohorts, and three external validation cohorts containing 1703 participants were recruited from the public hospitals (Cohort 1: the First Affiliated Hospital of Guangzhou Medical University; Cohort 2: Xiangyang central hospital; Cohort 3: the Second Affiliated Hospital of Xi'an Jiaotong University) in China between April 2017 and May 2024. Questionnaire information, CT reports, and QCT features derived from inspiratory CT were extracted for model development. A novel multimodal framework using eXtreme gradient boosting and hybrid feature selection was established for COPD detection. National Lung Screening Trial (NLST) cohort (n = 453) was applied to validate the multiracial extrapolation and robustness on low-dose CT scans.

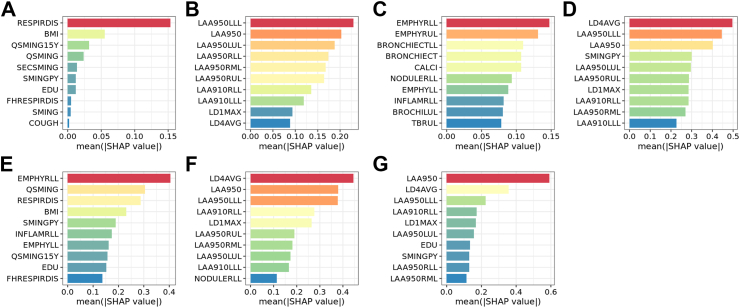
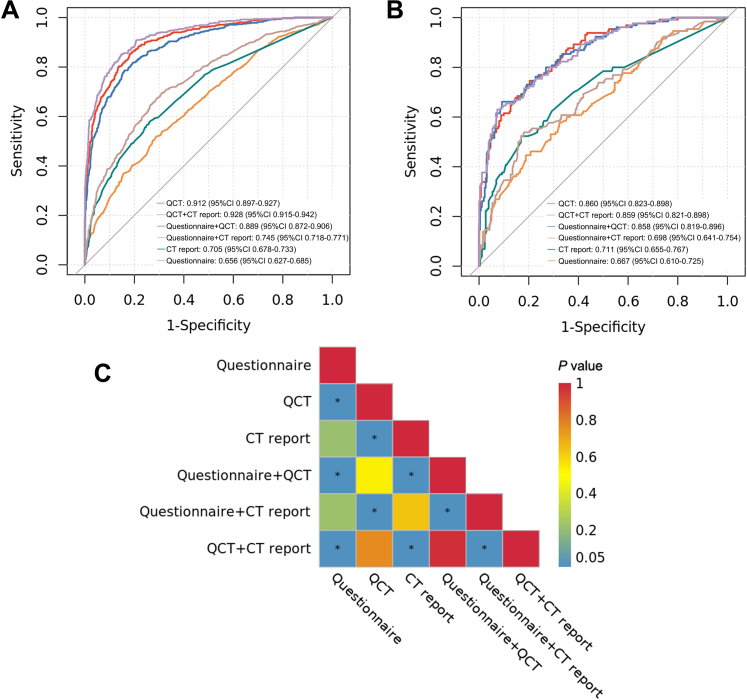
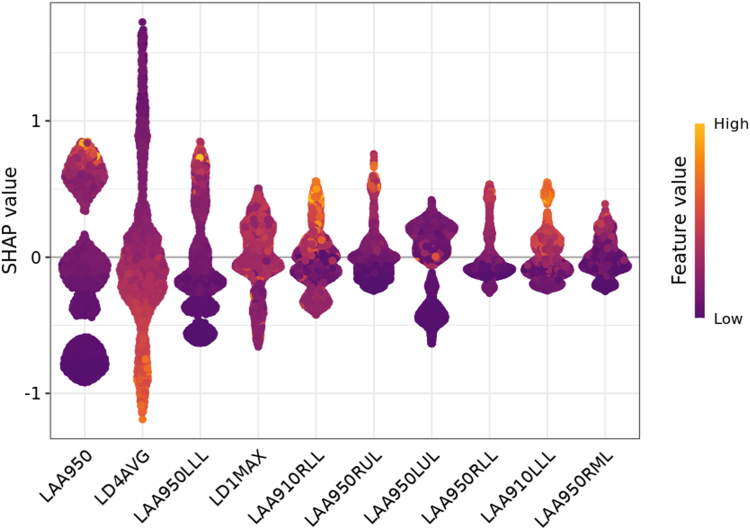
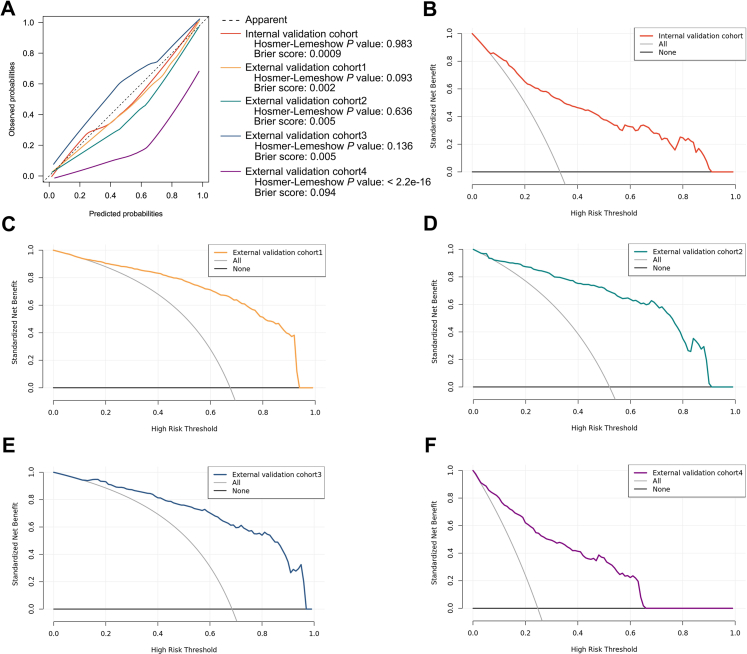
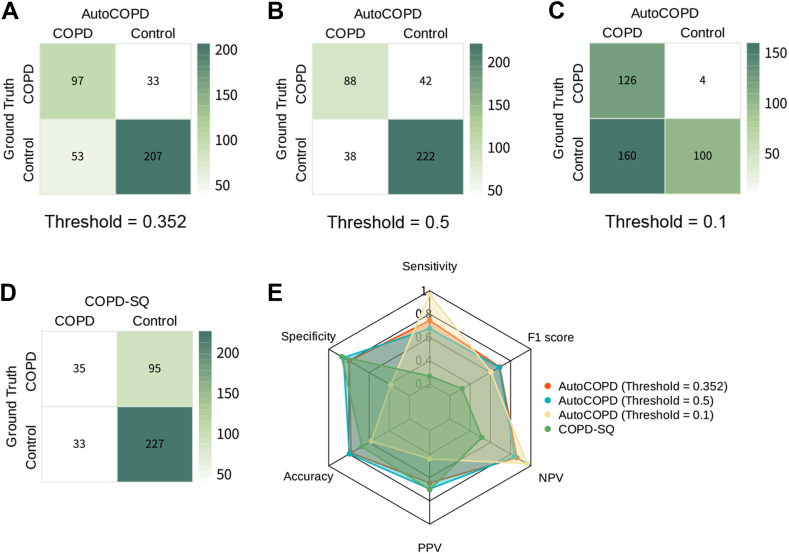
Findings: The QCT model (referred to as AutoCOPD) with ten features achieved the highest AUC of 0·860 (95% CI: 0·823-0·898) in the internal validation cohort, and showed excellent discrimination when externally validated [Cohort 1: AUC = 0·915 (95% CI: 0·898-0·931); Cohort 2: AUC = 0·903 (95% CI: 0·864-0·943); Cohort 3: AUC = 0·914 (95% CI: 0·882-0·947); NLST: AUC = 0·881 (95% CI: 0·846-0·915)]. Decision curve analysis demonstrated that AutoCOPD was valuable across a range of COPD risk thresholds between 0·12 and 0·66 compared with intervention in all patients with COPD or no intervention.

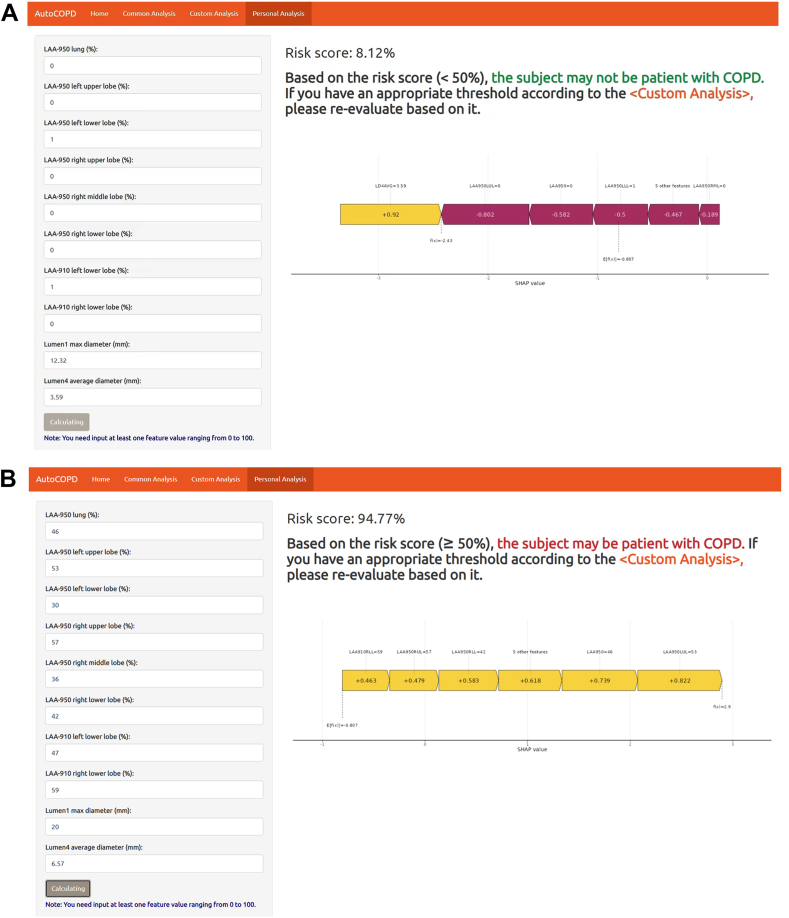
Interpretation: Heterogeneous COPD can be well identified using AutoCOPD (https://lwj-lab.shinyapps.io/autocopd/) constructed by a subset of only ten QCT features. It may be generalizable across clinical settings and serve as a feasible tool for early detecting patients with mild or asymptomatic COPD to reduce delayed diagnosis in routine practice.

Funding: The National Natural Science Foundation of China, Guangzhou Laboratory, Natural Science Foundation of Guangdong Province, Guangzhou Municipal Science and Technology grant, State Key Laboratory of Respiratory Disease.

Keywords: COPD; Detection; Machine learning; Quantitative computed tomography.


Conflict of interest statement

CL is a senior engineer of Neusoft Medical Systems, a leading company of global information technology, product, and solution. WL received free access to the NeuLungCare–QA software for CT images analysis provided by Neusoft Medical Systems, and received free technical support from Guangzhou Tianpeng Computer Technology Co., Ltd. FL received free access to NCI's data collected by NLST. All other authors do not have any potential conflicts of interest to declare.

Figures

Fig. 1
Fig. 1
SHAP summary bar plots. (AG) Top ten features of seven schemes, namely questionnaire (A), QCT (B), CT report (C), questionnaire and QCT (D), questionnaire and CT report (E), QCT and CT report (F), as well as questionnaire, QCT and CT report (G). The feature importance was assessed using mean absolute SHAP values. Based on the candidate features from the unimodal models, the multimodal models were composed of the combinations of these features. The location of the bar on the x-axis represents the feature' s SHAP value, while its color represents the actual value (red representing higher values). A feature’ s SHAP value represents the contribution of the specific feature to the performance of model. The order of features is ranked by their mean absolute SHAP values. Abbreviations: SHAP, SHapley Additive exPlanation; CT, computed tomography; QCT, quantitative computed tomography.
Fig. 2
Fig. 2
Model evaluation of six schemes. (A and B) ROC curves of unimodal and multimodal models in predicting COPD in the training (A) and internal validation cohorts (B). (C) Heatmap for the significance of the AUCs computed using the DeLong's method. The color represents the actual P value, with red indicating higher value and blue indicating lower value. “∗” represents the P value < 0.05. Abbreviations: ROC, receiver operating characteristic; AUC, area under the receiver operating characteristic curve; COPD, chronic obstructive pulmonary disease.
Fig. 3
Fig. 3
SHAP beeswarm summary plot for ten features of AutoCOPD. The SHAP value (y-axis) of a feature represents the contribution of a specific feature to the COPD development, with positive values indicating the contribution of increasing the risk score and negative values indicating the contribution of decreasing the score. The location of the dot on the y-axis represents the feature' s SHAP value, while its color represents the actual feature values of each cluster, with yellow indicating higher feature value and purple indicating lower feature value. The dots are stacked vertically to show their density. The order of features is ranked by their mean absolute SHAP values. Abbreviations: SHAP, SHapley Additive exPlanation; COPD, chronic obstructive pulmonary disease.
Fig. 4
Fig. 4
Calibration and DCA for AutoCOPD. (A) Observed versus predicted COPD risk in the internal and external validation cohorts. (B–F) The plot shows the standardized net benefit (y-axis) across a range of COPD risk thresholds (x-axis) of AutoCOPD compared with intervention in all participants (all) or no intervention (none) in the internal validation cohort (B), external validation cohort 1 (C), external validation cohort 2 (D), external validation cohort 3 (E), and external validation cohort 4 (F). Abbreviations: DCA, decision curve analysis; COPD, chronic obstructive pulmonary disease.
Fig. 5
Fig. 5
COPD detection performance using AutoCOPD and COPD-SQ in the internal validation cohort. (AD) Confusion matrices for AutoCOPD (AC) with different thresholds and COPD-SQ (D) during prediction of COPD. (E) Radar plot for overall performance between AutoCOPD with different thresholds and COPD-SQ evaluated by sensitivity, specificity, accuracy, PPV, NPV, and F1 score. Abbreviations: COPD, chronic obstructive pulmonary disease; COPD-SQ, chronic obstructive pulmonary disease screening questionnaire; PPV, positive predictive value; NPV, negative predictive value.
Fig. 6
Fig. 6
The risk scores of COPD in two participants were calculatedusing the web application. (A) The prediction indicated that the probability of the participant developing COPD is 8·12%. PFT showed that FEV1/FVC >0·7. (B) The prediction result indicated that the probability of the participant developing COPD is 94·77%. PFT showed that FEV1/FVC <0·7. The force plot indicates the features that contribute to the decision of COPD: the yellow features on the left are pushing the prediction towards the COPD, while the purple features on the right are pushing the prediction towards the non-COPD. Abbreviations: COPD, chronic obstructive pulmonary disease; PFT, pulmonary function test; FEV1/FVC, ratio of forced expiratory volume in 1 s to forced vital capacity.

Similar articles

References

    1. Global initiative for chronic obstructive lung disease . GOLD Science Committee; 2024. Global strategy for the diagnosis, management, and prevention of chronic obstructive pulmonary disease (2025 REPORT)https://goldcopd.org/2025-gold-report/ [accessed 2024 Nov]. Available from:
    1. Wang C., Xu J., Yang L., et al. Prevalence and risk factors of chronic obstructive pulmonary disease in China (the China Pulmonary Health [CPH] study): a national cross-sectional study. Lancet. 2018;391:1706–1717. - PubMed
    1. Bhatt S.P., Balte P.P., Schwartz J.E., et al. Discriminative accuracy of FEV1:FVC thresholds for COPD-related hospitalization and mortality. JAMA. 2019;321:2438–2447. - PMC - PubMed
    1. Diab N., Gershon A.S., Sin D.D., et al. Underdiagnosis and overdiagnosis of chronic obstructive pulmonary disease. Am J Respir Crit Care Med. 2018;198:1130–1139. - PubMed
    1. Labaki W.W., Agusti A., Bhatt S.P., et al. Leveraging CT imaging to detect COPD and concomitant chronic diseases. Am J Respir Crit Care Med. 2024;210(3):281–287. - PMC - PubMed

LinkOut - more resources