. 2025 Apr 2:16:1557483.
doi: 10.3389/fimmu.2025.1557483. eCollection 2025.

Exploring the role of EBV in multiple sclerosis pathogenesis through EBV interactome

Affiliations

Exploring the role of EBV in multiple sclerosis pathogenesis through EBV interactome

Chiara Ballerini et al. Front Immunol. .

Abstract

Background: Epstein-Barr virus (EBV) is a known risk factor for multiple sclerosis (MS), even though the underlying molecular mechanisms are unclear and engage multiple immune pathways. Furthermore, the ultimate role of EBV in MS pathogenesis is still elusive. In contrast, Cytomegalovirus (CMV) has been identified as a protective factor for MS.

Objectives: This study aims to identify MS-associated genes that overlap with EBV interactome and to examine their expression in immune and glial cell subtypes.

Methods: We used P-HIPSTer, GWAS, and the Human Protein Atlas (HPA) to derive data on the EBV interactome, MS-associated genes and single-cell gene expression in immune and glial cells. The geneOverlap and dplyr R packages identified overlapping genes. A similar analysis was done for CMV and Adenovirus as negative control. Metascape and GTEx analyzed biological pathways and brain-level gene expression; transcriptomic analysis was performed on glial cells and peripheral blood in MS and controls. All the analyses performed in this study were generated using publicly available data sets.

Results: We identified a "core" group of 21 genes shared across EBV interactome, MS genes, and immune and glial cells (p<0.001). Pathway analysis revealed expected associations, such as immune system activation, and unforeseen results, like the prolactin signaling pathway. BCL2 in astrocytes, MINK1 in microglia were significantly upregulated while AHI1 was downregulated in MS compared to controls.

Conclusions: Our findings offer novel insights into EBV and CMV interaction with immune and glial cells in MS, that may shed light on mechanisms involved in disease pathophysiology.

Keywords: CMV; EBV; MS pathogenesis; immune cells; interactome.


Conflict of interest statement

The authors declare that the research was conducted in the absence of any commercial or financial relationships that could be construed as a potential conflict of interest.

Figures

Figure 1
Figure 1
Flow-chart representing methods of creation and analysis of EBV-human interactome. The same process was applied to CMV analysis. LR, likelihood ratio; P-HIPSTer, Pathogen Host Interactome Prediction using STructurE similarity; GWAS, genome-wide association studies; nTPM, normalized Transcripts Per Million; GTEX, Genotype-Tissue Expression (made with pptx).
Figure 2
Figure 2
EBV interactome. EBV-Human interactome representation as a network, in light blue 45 of 958 nodes depict overlap genes from GWAS.
Figure 3
Figure 3
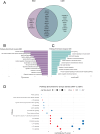
Gene pathway analysis. (A) Venn-diagram: in the pink circle only genes of EBV, in the green circle only genes of CMV. The intersection represents genes shared by the two viruses. (B) Representation of the most significant pathways for genes overlapping with EBV and associated with MS, bar graph of enriched terms across input gene lists for EBV, it shows the -log10 (p-value) on the x-axis, indicating the significance of each pathway. (C) Bar graph of enriched terms across input gene lists for CMV -log10 (p-value) on the x-axis. (D) Bubble Plot shows pathway enrichment for unique genes of CMV vs. EBV. The x-axis represents -log10 (adjusted p-values), while the size of the bubbles corresponds to the magnitude of -log10 (adjusted p-values). The color differentiates between the two viruses: in red circles the CMV and in blue circles the EBV.
Figure 4
Figure 4
Subset cluster network representation. The size of each node is proportional to the number of input genes associated with that term and (A) EBV genes network of enriched terms colored by cluster ID, the color indicates the cluster to which each node belongs. Where nodes that share the same cluster ID are typically close to each other. (B) EBV enrichment network nodes colored by p-value instead, depicts the degree of significance of the enrichment network, as sorted by node. Visualization of PPI network analysis using the MCODE algorithm. Each node represents a protein, while edges indicate interactions. The identified clusters suggest potential protein complexes or functional groups that may play significant roles in the biological processes. (C) EBV Protein-protein interaction network. (D) EBV MCODE components identified in the gene lists colored by cluster.
Figure 5
Figure 5
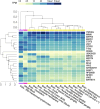
Gene expression in CNS. Heat map representation of gene expression level in different brain regions, blood cells (negative control) and lymphocytes EBV-infected (positive control). Different regions of the CNS are listed on the x-axis while on the y-axis we have the group of genes. TPM (transcripts per million) gives an idea of how much the genes are transcribed in the different regions of CNS, visually represented with an increasing color gradation from yellow to dark blue.

References

    1. Winquist RJ, Kwong A, Ramachandran R, Jain J. The complex etiology of multiple sclerosis. Biochem Pharmacol. (2007) 74:1321–9. doi: 10.1016/j.bcp.2007.04.026 - DOI - PubMed
    1. Soldan SS, Lieberman PM. Epstein-Barr virus and multiple sclerosis. Nat Rev Microbiol. (2023) 21:51–64. doi: 10.1038/s41579-022-00770-5 - DOI - PMC - PubMed
    1. Bjornevik K, Cortese M, Healy BC, Kuhle J, Mina MJ, Leng Y, et al. . Longitudinal analysis reveals high prevalence of Epstein-Barr virus associated with multiple sclerosis. Science. (2022) 375:296–301. doi: 10.1126/science.abj8222 - DOI - PubMed
    1. Magliozzi R, Serafini B, Rosicarelli B, Chiappetta G, Veroni C, Reynolds R, et al. . B-cell enrichment and Epstein-Barr virus infection in inflammatory cortical lesions in secondary progressive multiple sclerosis. J Neuropathol Exp Neurol. (2013) 72:29–41. doi: 10.1097/NEN.0b013e31827bfc62 - DOI - PubMed
    1. Lassmann H, Niedobitek G, Aloisi F, Middeldorp JM, NeuroproMiSe EBV Working Group . Epstein-Barr virus in the multiple sclerosis brain: a controversial issue–report on a focused workshop held in the Centre for Brain Research of the Medical University of Vienna, Austria. Brain. (2011) 134:2772–86. doi: 10.1093/brain/awr197 - DOI - PMC - PubMed

MeSH terms

LinkOut - more resources