

Distinct Omicron longitudinal memory T cell profile and T cell receptor repertoire associated with COVID-19 hospitalisation
- PMID: 40242761
- PMCID: PMC12000046
- DOI: 10.3389/fimmu.2025.1549570
Distinct Omicron longitudinal memory T cell profile and T cell receptor repertoire associated with COVID-19 hospitalisation
Abstract
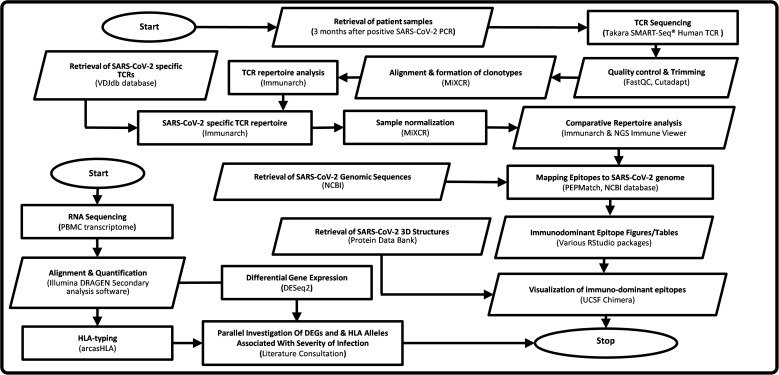
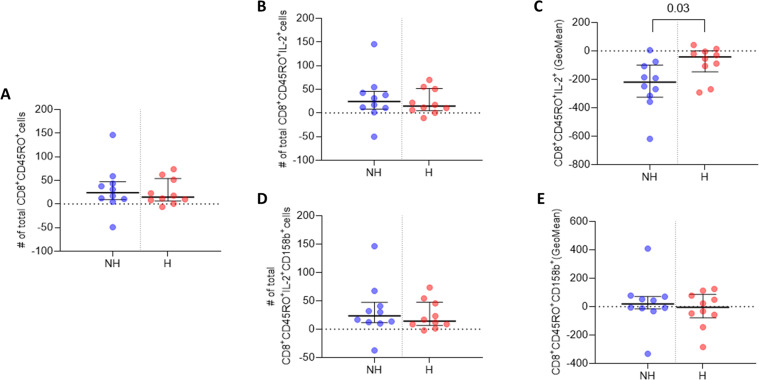
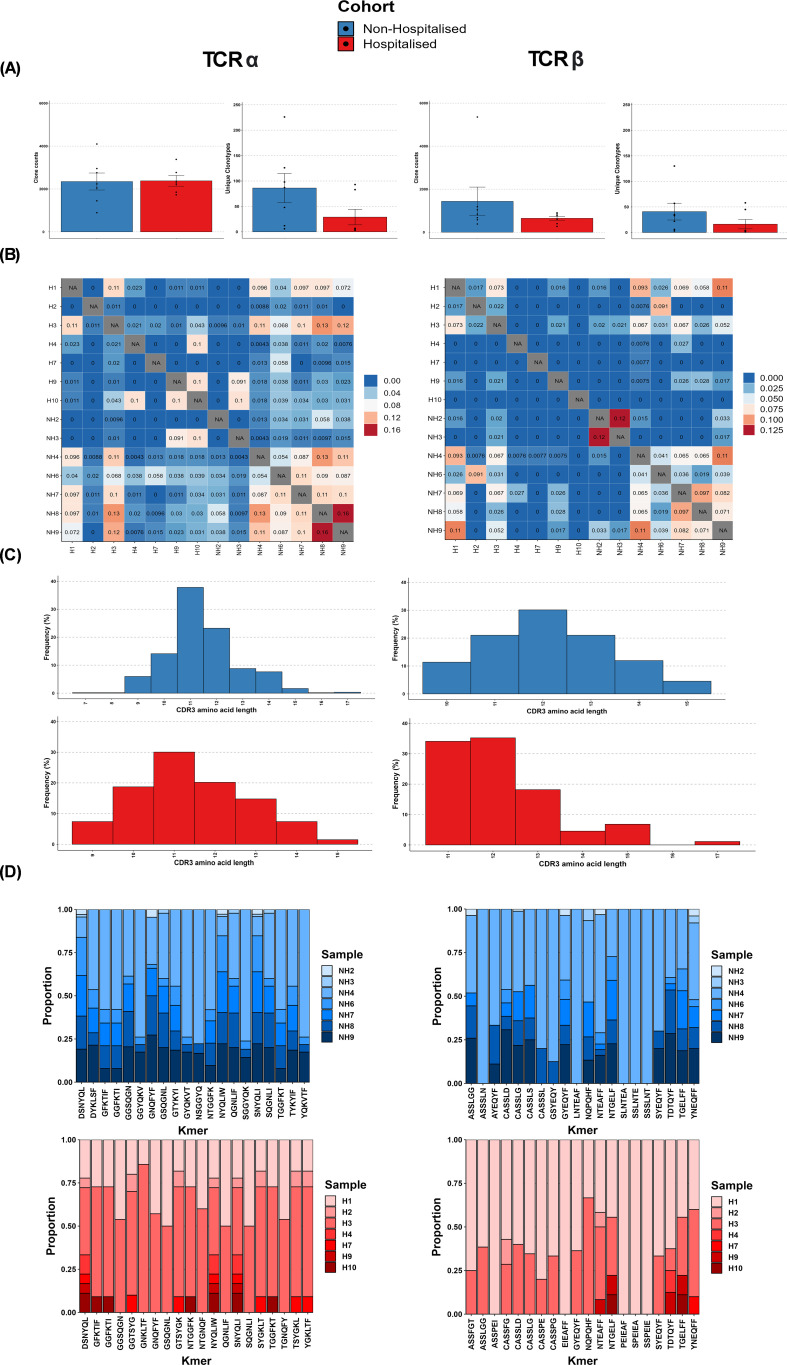
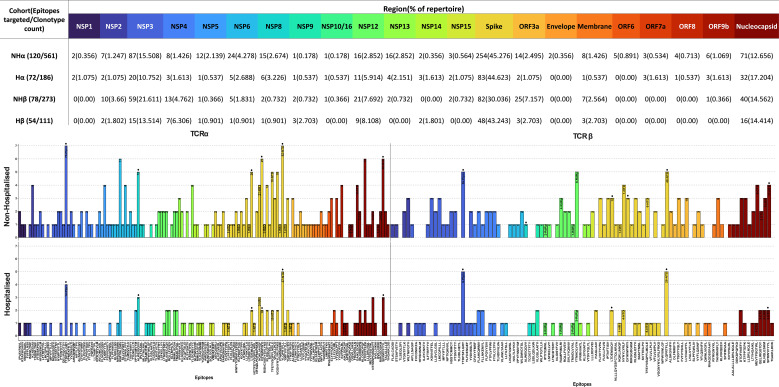
SARS-CoV-2 has claimed more than 7 million lives worldwide and has been associated with prolonged inflammation, immune dysregulation and persistence of symptoms following severe infection. Understanding the T cell mediated immune response and factors impacting development and continuity of SARS-CoV-2 specific memory T cells is pivotal for developing better therapeutic and monitoring strategies for those most at risk from COVID-19. Here we present a comprehensive analysis of memory T cells in a convalescent cohort (n=20), three months post Omicron infection. Utilising flow cytometry to investigate CD4+CD45RO+ and CD8+CD45RO+ memory T cell IL-2 expression following Omicron (B.1.1.529/BA.1) peptide pool stimulation, alongside T cell receptor repertoire profiling and RNA-Seq analysis, we have identified several immunological features associated with hospitalised status. We observed that while there was no significant difference in median CD4+CD45RO+ IL-2+ and CD8+ CD45RO+ IL-2+ memory T cell count between subgroups, the hospitalised subgroup expressed significantly more IL-2 per cell following Omicron peptide pool exposure in the CD8+CD45RO+ population (p <0.03) and trended towards significance in CD4+CD45RO+ cells (p <0.06). T cell receptor repertoire analysis found that the non-hospitalised subgroup had a much higher number of circulating clonotypes, targeting a wider range of predominantly MHC-I epitopes across the SARS-CoV-2 genome. Several immunodominant epitopes, conserved between both subgroups, were observed, however hospitalised individuals were less likely to express putative HLA alleles responsible for pMHC presentation which may impact TCR affinity. We observed a bias towards shorter CDR3 segments in TCRβ repertoire analysis within the hospitalised subgroup, alongside lower rates of repertoire overlap in CDR3 sequences compared to the non-hospitalised subgroup. We found a significant proportion of TCRs targeted epitopes along the SARS-CoV-2 genome including non-structural proteins, responsible for viral replication and immune evasion. These findings highlight how the continuity of T cell based protective immunity is impacted by both the viral replication cycle of SARS-CoV-2 upon intracellular and innate immune responses, and HLA-type upon TCR affinity and clonotype formation. Our novel Epitope Target Analysis Pipeline (Epi-TAP) could prove beneficial in development of new therapeutic strategies through rapid identification of shared immunodominant epitopes across non-hospitalised and hospitalised subgroups.
Keywords: COVID-19; SARS-CoV-2; T cell immunity; T cell receptor (TCR) recognition; adaptive immunity; antigen presentation; immuno-informatics.
Copyright © 2025 Markey, McLaughlin, McDaid, Lynch, English, Alexander, Kelly, Bhavsar, McGilligan, Zhang, Murray, Rai, Walsh, Bjourson, Shukla and Gibson.
Conflict of interest statement
The authors declare that the research was conducted in the absence of any commercial or financial relationships that could be construed as a potential conflict of interest.
Figures


Similar articles
-
T cell receptor usage and epitope specificity amongst CD8+ and CD4+ SARS-CoV-2-specific T cells.Front Immunol. 2025 Feb 28;16:1510436. doi: 10.3389/fimmu.2025.1510436. eCollection 2025. Front Immunol. 2025. PMID: 40092978 Free PMC article.
-
Analysis of TCR Repertoire by High-Throughput Sequencing Indicates the Feature of T Cell Immune Response after SARS-CoV-2 Infection.Cells. 2021 Dec 27;11(1):68. doi: 10.3390/cells11010068. Cells. 2021. PMID: 35011632 Free PMC article.
-
SARS-CoV-2 Epitopes Are Recognized by a Public and Diverse Repertoire of Human T Cell Receptors.Immunity. 2020 Dec 15;53(6):1245-1257.e5. doi: 10.1016/j.immuni.2020.11.004. Epub 2020 Nov 13. Immunity. 2020. PMID: 33326767 Free PMC article.
-
The molecular mechanisms of CD8+ T cell responses to SARS-CoV-2 infection mediated by TCR-pMHC interactions.Front Immunol. 2024 Oct 10;15:1468456. doi: 10.3389/fimmu.2024.1468456. eCollection 2024. Front Immunol. 2024. PMID: 39450171 Free PMC article. Review.
-
SARS-CoV-2 human T cell epitopes: Adaptive immune response against COVID-19.Cell Host Microbe. 2021 Jul 14;29(7):1076-1092. doi: 10.1016/j.chom.2021.05.010. Epub 2021 May 21. Cell Host Microbe. 2021. PMID: 34237248 Free PMC article. Review.
References
-
- WHO . COVID-19 epidemiological update – 15 March 2024(2024). Available online at: https://www.who.int/ (Accessed March 19, 2024).
-
- Abbas AK, Lichtman AH, Pillai S. Cellular and Molecular Immunology. 10th Edition. Philadelphia, Pennsylvania: Elsevier Health Sciences; (2021).
MeSH terms
Substances
LinkOut - more resources
Full Text Sources
Medical
Research Materials
Miscellaneous