. 2025 Jun;53(6):64.
doi: 10.3892/or.2025.8897. Epub 2025 Apr 17.

BCL2A1‑ and G0S2‑driven neutrophil extracellular traps: A protective mechanism linking preeclampsia to reduced breast cancer risk

Affiliations

BCL2A1‑ and G0S2‑driven neutrophil extracellular traps: A protective mechanism linking preeclampsia to reduced breast cancer risk

Lu Xiao et al. Oncol Rep. 2025 Jun.

Abstract

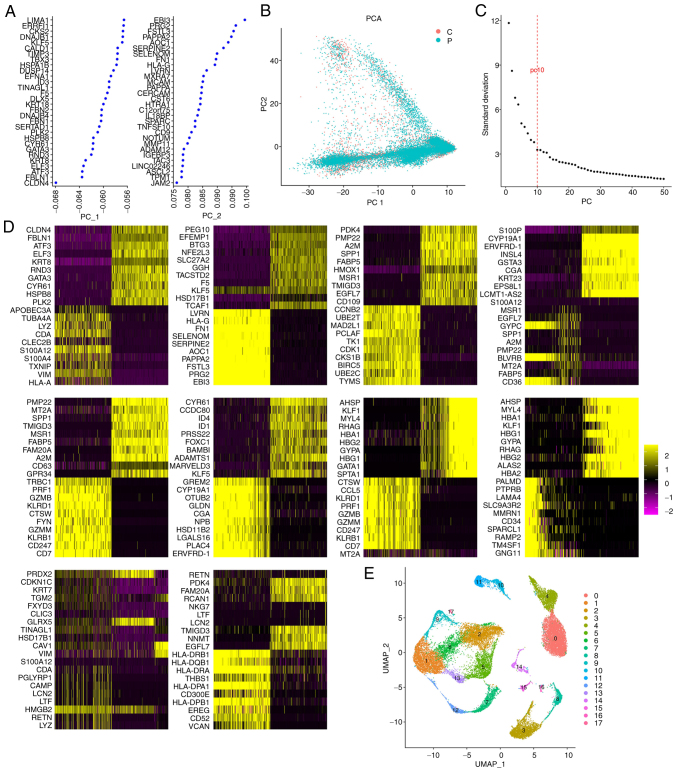
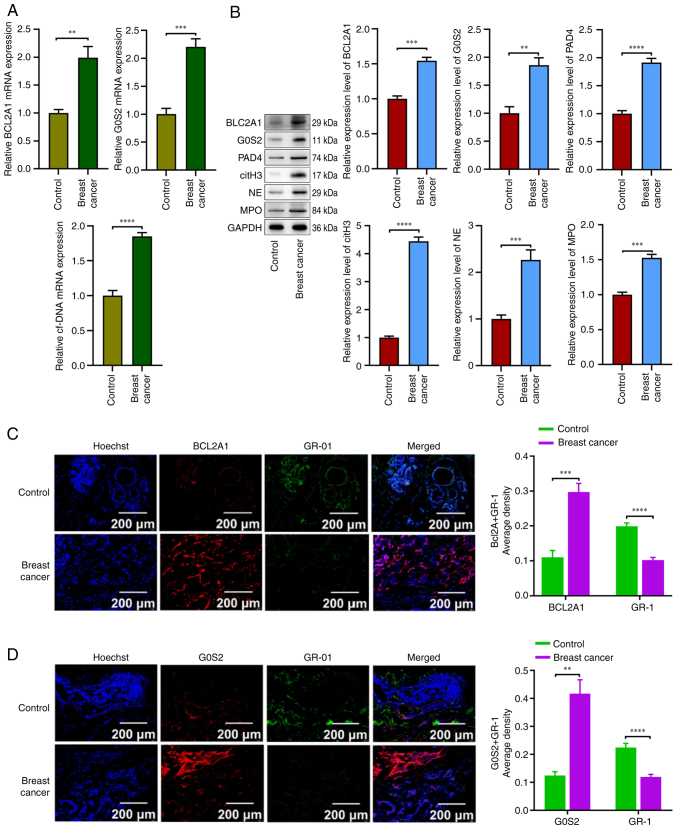
Preeclampsia has been associated with a reduced risk of breast cancer (BC), but the mechanisms underlying this relationship remain unclear. It has been suggested that neutrophil extracellular traps (NETs), which are released upon neutrophil activation, play a key role in both preeclampsia and BC. To investigate this link, the single‑cell RNA sequencing dataset GSE173193 was analyzed and upregulated genes BCL2A1 and G0/G1 switch gene 2 (G0S2) were identified in neutrophils from preeclamptic placentas. These findings were validated using reverse transcription‑quantitative PCR and western blotting. Combined analyses of preeclampsia and BC tissues, from Gene Expression Omnibus (GSE24129) and The Cancer Genome Atlas databases respectively, identified 2,040 upregulated differentially expressed genes, including BCL2A1 and G0S2. Furthermore, these genes showed clinical relevance to BC, as demonstrated by Receiver Operating Characteristic curve, survival analyses and weighted gene co‑expression network analysis. Functional experiments revealed that overexpression of BCL2A1 and G0S2 increased NET release and inhibited BC cell proliferation, invasion and migration. The present study provides novel insights into the shared molecular pathways of preeclampsia and BC, emphasizing NETs as a potential protective mechanism as increased NET production in preeclampsia may contribute to a reduced BC risk by influencing tumor progression and offer avenues for further research into therapeutic interventions.

Keywords: BCL2A1; G0S2; NETs; breast cancer; neutrophils; preeclampsia.


Conflict of interest statement

The authors declare that they have no competing interests.

Figures

Figure 1.
Figure 1.
Cellular composition of preeclamptic and control placentas. (A) Top two principal component analyses according to standard deviation. (B) PCA plots of placenta cells between preeclampsia and control. (C) Elbow-plot determining the optimal principal components. (D) Heatmaps showing the top 20 marker genes in each principal component analysis. (E) Cell clusters based on the screened principal component analyses. PCA, principal component analysis.
Figure 2.
Figure 2.
Identification of cell types and their marker genes across preeclampsia and control placentas cells. (A) UMAP plots showing cell types identified by marker genes. Each cell type was colored by a unique color. (B) The cell ratio among preeclampsia and control placenta cells. (C) Integrated analysis showing marker genes across cell types. The size of each circle reflects the percentage of cells in each cell type where the gene was detected, and the color shadow reflects the average expression level within each cell type. UMAP, Uniform Manifold Approximation and Projection.
Figure 3.
Figure 3.
Intercellular communication network. (A) The solid circles with different colors represent different cell groups. The size of the solid circle is proportional to the number of cells corresponding to the cell group. The color of each side is consistent with the signal sender, and the thickness of the side is proportional to the communication intensity. (B) The color of the dot indicates different cell groups, and the size of the dot is proportional to the number of ligands and receptors inferred from each cell group. The × axis and y axis respectively indicate the strength of the cell group as a signal sender and receiver. The color of each dot represents distinct cell groups, and the size of the dot corresponds to the number of ligands and receptors inferred from each group. The x-axis and y-axis indicate the strength of the cell group as a signal sender and receiver, respectively. (C-E) Pseudotime ordering of trophocyte. Each dot represented one cell, and each branch represented one cell state. The left plot was labeled with cell states, and the right plot was labeled with developmental time; each dot represented an individual cell, while each branch indicated a specific cell state. The left plot was labeled with cell states, whereas the right plot was labeled with developmental time.
Figure 4.
Figure 4.
GO and KEGG enrichment. (A-D) GO and KEGG enrichment analysis of genes enriched in (A-C) trophoblasts and (D) neutrophils. GO, Gene Ontology; KEGG, Kyoto Encyclopedia of Genes and Genomes.
Figure 5.
Figure 5.
BCL2A1 and G0S2 genes are significantly increased in neutrophils from preeclamptic placental tissue. (A) FACS analysis showing neutrophil detection in control and preeclampsia placentas. (B and C) The mRNA and protein expression level of BCL2A1 and G0S2 in placentas. (D and E) Expression and localization of neutrophils, and BCL2A1 and G0S2 in placental tissue at ×10 magnification. ***P<0.001 and ****P<0.0001. All experiments were conducted in triplicate. G0S2, G0/G1 switch gene 2; PE, preeclampsia.
Figure 6.
Figure 6.
BCL2A1 and G0S2 genes regulate generation of neutrophil extracellular traps. (A-C) The mRNA expression level of (A) BCL2A1, (B) G0S2 and (C) cf-DNA in neutrophils upon individual and combined overexpression of BCL2A1 and G0S2. (D-H) The protein expression level of PAD4, citH3, NE and MPO in neutrophils. All comparisons were made with empty vector transfection group. ***P<0.001 and ****P<0.0001. All experiments were conducted in triplicate. MPO, myeloperoxidase; OE-, overexpressing; G0S2, G0/G1 switch gene 2.
Figure 7.
Figure 7.
Clinical relationship between breast cancer and preeclampsia based on BCL2A1 and G0S2. (A) The volcano plot of DEGs in the integrated Gene Expression Omnibus (GSE24129) and TCGA-breast cancer dataset. Blue dots represent down-rgulated genes, gray dots represent not significant genes, and red dots represent upregulated genes. Blue dots indicate downregulated genes, gray dots represent genes that are not significant, and red dots signify upregulated genes. (B-E) The results of survival analysis showing that SCL2A1 and G0S2 expression levels had no obvious effect on OS. (F) Wenn diagram showing overlap of preeclampsia-associated gene from GSE24129 and genes upregulated in breast cancer from TCGA. (G-L) Weighted gene co-expression network analysis of identified DEGs. (G) A clustering dendrogram. (H) The determination of soft threshold. (I) Different modules are produced and shown in different colors by aggregating genes with strong correlations into a same module. Turquoise modules make up a greater proportion. (J) Heatmap of eigengene adjacency. (K) Clustering of modules. The turquoise module had the highest correlation with the tumor. (L) Module eigengene dendrogram. DEGs, differentially expressed genes; TCGA, The Cancer Genome Atlas; OS, overall survival; G0S2, G0/G1 switch gene 2.
Figure 8.
Figure 8.
Overexpression of the BCL2A1 and G0S2 genes in neutrophils inhibits malignant progression of breast cancer cells. (A) Bar-graph showing changes in viability of MCF-7 cells when co-cultured with neutrophils transfected with individual or combination of BCL2A1 and G0S2 overexpression constructs. (B) Transwell assays showing the migration of MCF-7 cells at 4 magnification upon co-culturing with neutrophils transfected with individual or combination of BCL2A1 and G0S2 overexpression constructs. (C) Bar-graph showing quantification of migratory cells from (B). (D) In vitro scratch assay showing the migration of MCF-7 cells at ×4 magnification upon co-culturing with neutrophils transfected with individual or combination of BCL2A1 and G0S2 overexpression constructs. (E) Bar-graph showing quantification of wound breadth from (D). **P<0.01. All experiments were conducted in triplicate. OE-, overexpressing; ns, not significant; G0S2, G0/G1 switch gene 2.
Figure 9.
Figure 9.
BCL2A1 and G0S2 gene expression levels were significantly elevated in neutrophils from breast cancer tissue, along with increase in production of neutrophil extracellular traps. (A) The mRNA expression level of BCL2A1, G0S2 and cf-DNA in breast cancer tissue compared with control. (B) The protein expression level of BCL2A1, G0S2, PAD4, citH3, NE and MPO in breast cancer tissue compared with control. (C and D) Expression and localization of neutrophils, and BCL2A1 and G0S2 in breast cancer cells at ×10 magnification. **P<0.01, ***P<0.001 and ****P<0.0001. All experiments were conducted in triplicate. MPO, myeloperoxidase; G0S2, G0/G1 switch gene 2.
Figure 10.
Figure 10.
Mechanistic summary. The shared genes of PE and BC regulate neutrophil fate and differentiation, and then participate in promoting the release of NETs, resulting in the decreased proliferation, invasion and migratory capacity of BC cells. PE, preeclampsia; BC, breast cancer; NETs, neutrophil extracellular traps; NETosis, neutrophil necrosis.

References

    1. Rana S, Lemoine E, Granger JP, Karumanchi SA. Preeclampsia: Pathophysiology, challenges, and perspectives. Circ Res. 2019;124:1094–1112. doi: 10.1161/CIRCRESAHA.118.313276. - DOI - PubMed
    1. El-Sayed AAF. Preeclampsia: A review of the pathogenesis and possible management strategies based on its pathophysiological derangements. Taiwan J Obstet Gynecol. 2017;56:593–598. doi: 10.1016/j.tjog.2017.08.004. - DOI - PubMed
    1. Piani F, Agnoletti D, Baracchi A, Scarduelli S, Verde C, Tossetta G, Montaguti E, Simonazzi G, Degli Esposti D, Borghi C, HDP Bologna Study Group Serum uric acid to creatinine ratio and risk of preeclampsia and adverse pregnancy outcomes. J Hypertens. 2023;41:1333–1338. doi: 10.1097/HJH.0000000000003472. - DOI - PMC - PubMed
    1. Dimitriadis E, Rolnik DL, Zhou W, Estrada-Gutierrez G, Koga K, Francisco RPV, Whitehead C, Hyett J, da Silva Costa F, Nicolaides K, Menkhorst E. Pre-eclampsia. Nat Rev Dis Primers. 2023;9:8. doi: 10.1038/s41572-023-00451-4. - DOI - PubMed
    1. Tossetta G, Fantone S, Giannubilo SR, Marinelli Busilacchi E, Ciavattini A, Castellucci M, Di Simone N, Mattioli-Belmonte M, Marzioni D. Pre-eclampsia onset and SPARC: A possible involvement in placenta development. J Cell Physiol. 2019;234:6091–6098. doi: 10.1002/jcp.27344. - DOI - PubMed

MeSH terms

Substances