. 2025 May;66(5):38.
doi: 10.3892/ijo.2025.5744. Epub 2025 Apr 17.

Targeting the cuproptosis‑associated gene COL22A1 in glioblastoma using EMD‑1204831 and kaempferol

Affiliations

Targeting the cuproptosis‑associated gene COL22A1 in glioblastoma using EMD‑1204831 and kaempferol

Yi Chen et al. Int J Oncol. 2025 May.

Abstract

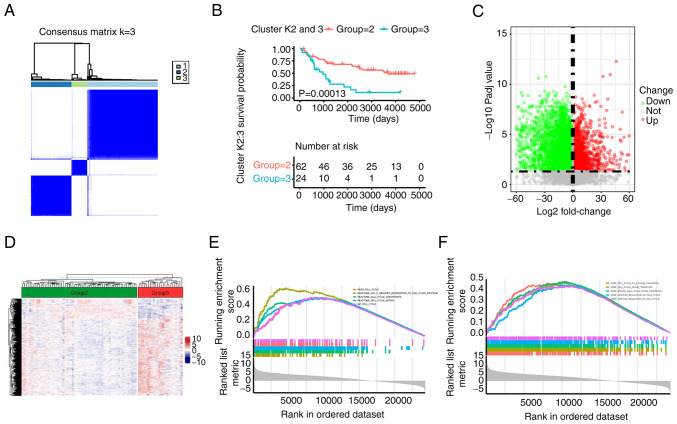
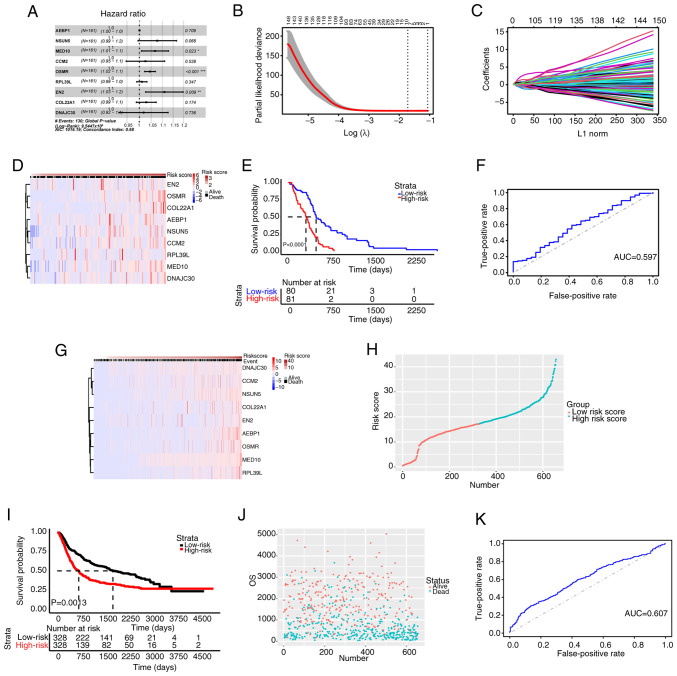
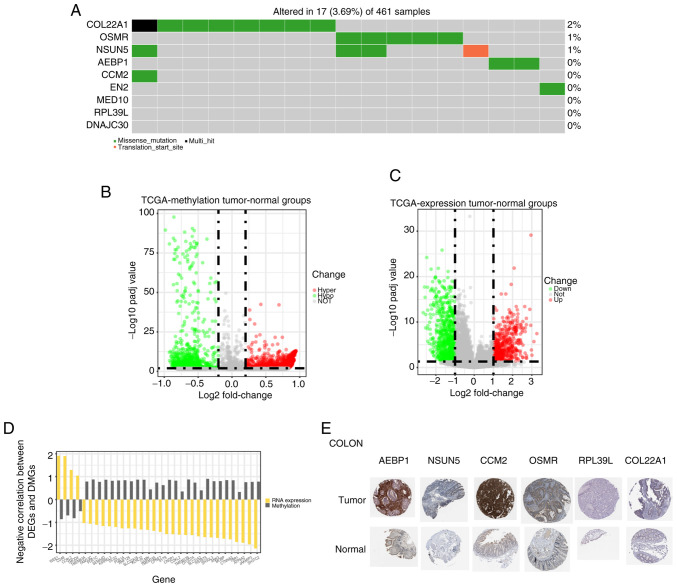
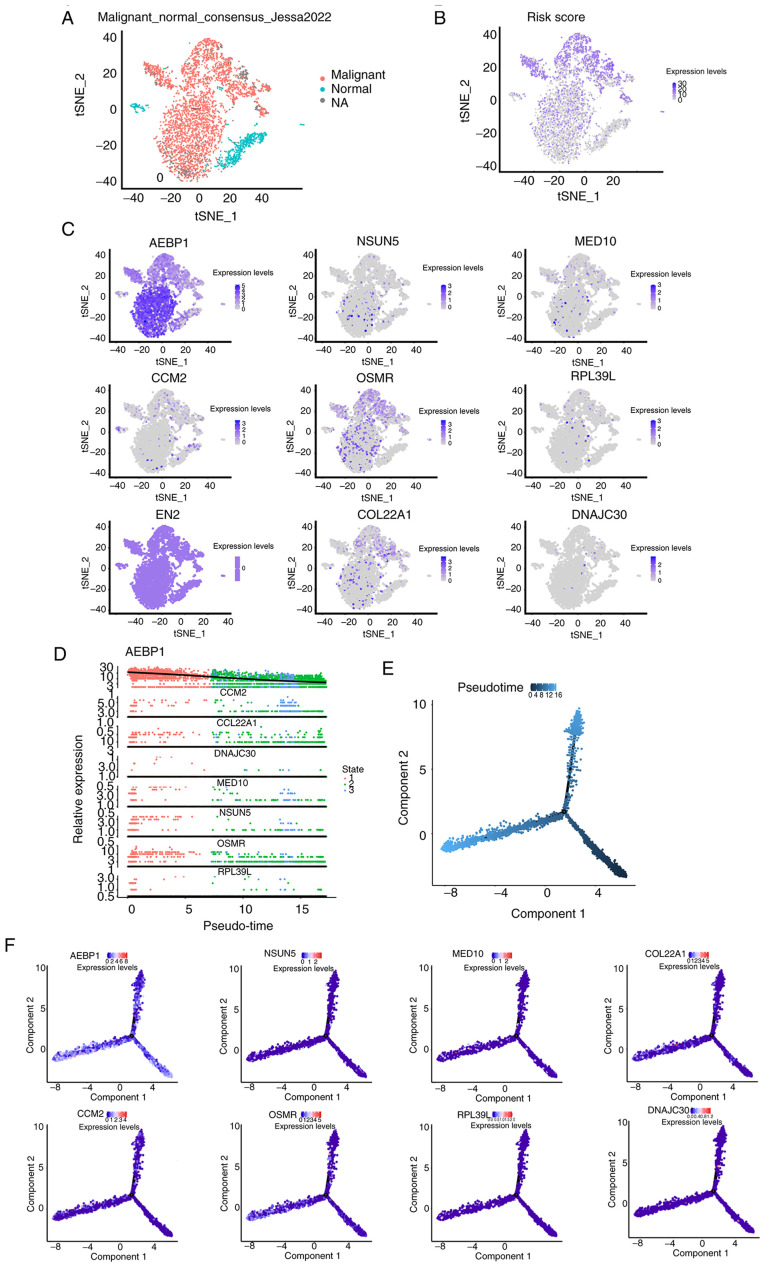
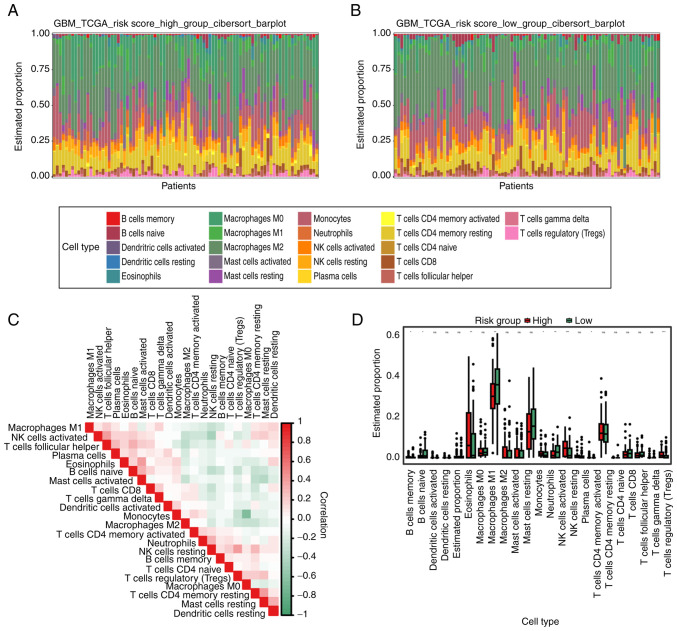
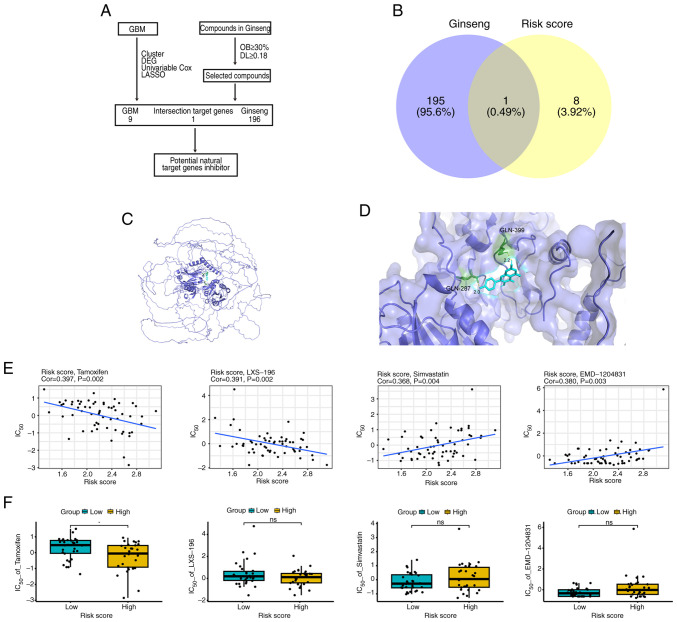
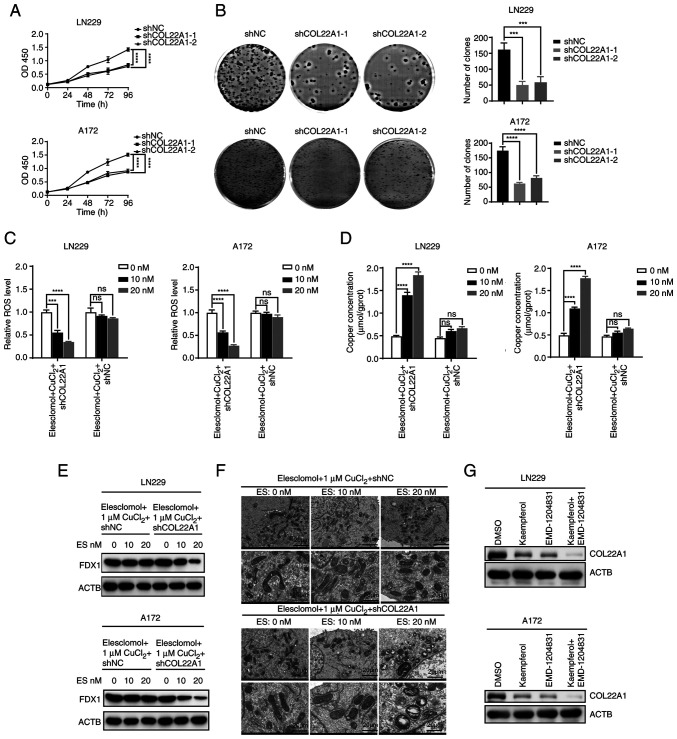
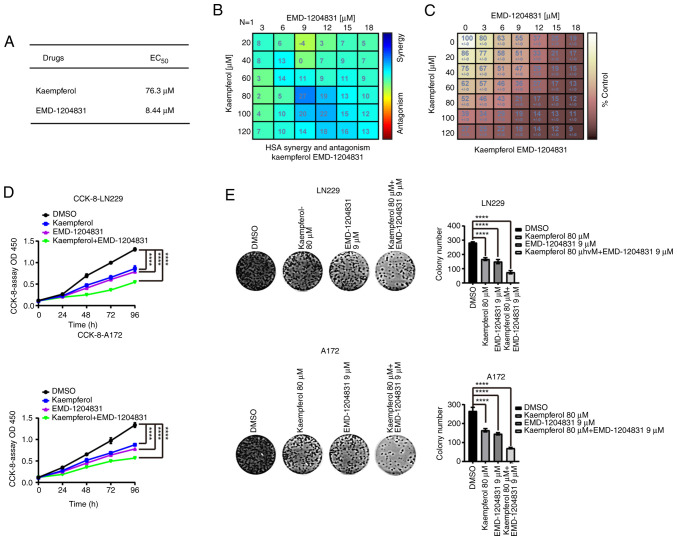
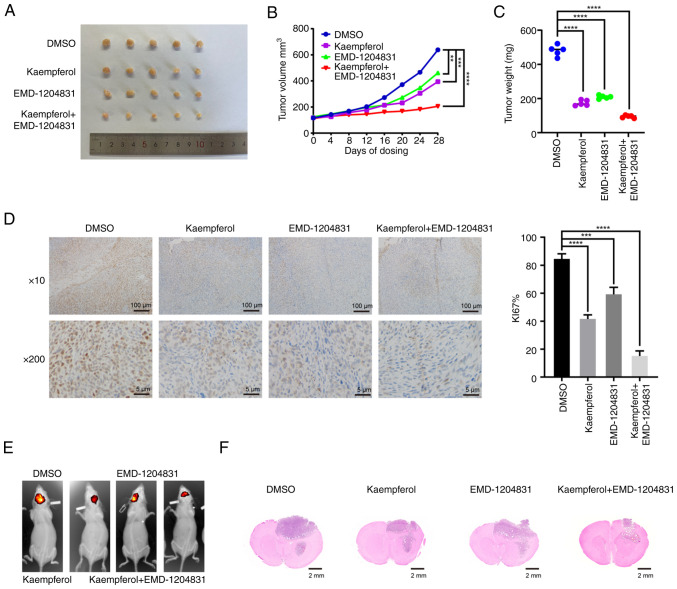
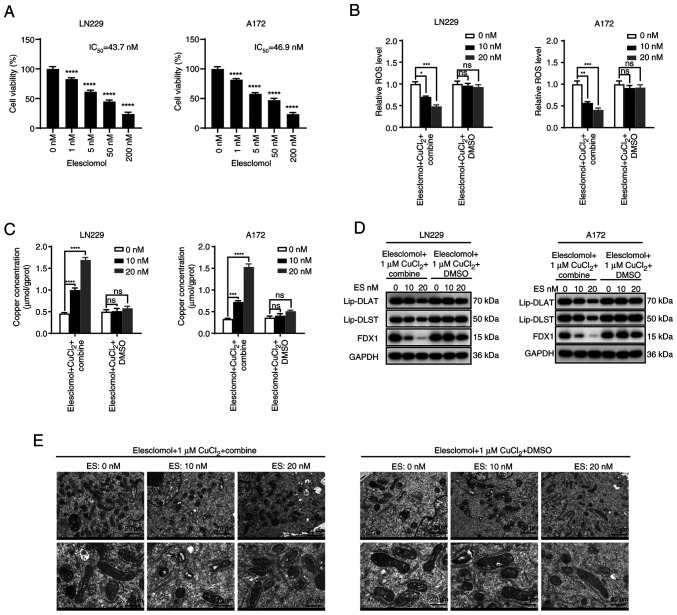
Glioblastoma (GBM) is a disease with high morbidity and poor prognosis. The combination of traditional Chinese and Western medicine and cuproptosis are known to serve important roles in the treatment of GBM. However, targeting cuproptosis to treat GBM by combining traditional Chinese and Western medicine has not been extensively investigated. Therefore, the present study focused on the diagnosis and treatment of GBM based on cuproptosis. Through a bioinformatics approach, a cuproptosis‑related prognostic model was first constructed. Next, this prognostic model was found to be closely related to immune infiltration, DNA mutation and DNA methylation through multi‑omics analysis. The present study indicated the cell clusters in GBM tissues and the risk scores in each cluster based on single‑cell sequencing data derived from Gene Expression Omnibus. Notably, by screening the CellMiner database, EMD‑1204831 was found to exhibit a high correlation with the risk score. Next, through network pharmacology and molecular docking analysis, the risk score‑related gene collagen type XXII α1 chain (COL22A1) was identified as the target of kaempferol, which is the active component of Ginseng. Notably, kaempferol could decrease the proliferation of GBM cells by inhibiting COL22A1 expression in cell experiments. Finally, kaempferol and EMD‑1204831 had an obvious inhibitory effect on the growth of GBM and sensitized GBM to cuproptosis inducers via COL22A1 in cell and animal experiments. Overall, the present study revealed a cuproptosis‑related combined regimen for GBM.

Keywords: GBM; collagen type XXII α1 chai; cuproptosis; immune cell infiltration; single‑cell RNA sequencing.


Conflict of interest statement

The authors declare that they have no competing interests.

Figures

Figure 1
Figure 1
Consensus clustering of cuproptosis-related genes in patients with glioblastoma. (A) Consensus matrix of the Chinese Glioma Genome Atlas dataset with k=3. K2 and 3 means cluster group 2 and 3. Matrix means the data of CGGA. (B) Kaplan-Meier curves of progression-free survival probability of groups 2 and 3. Cuproptosis-related differentially expressed genes between groups 2 and 3 were visualized using a (C) volcano plot and (D) heatmap. The color indicates the expression levels of genes. Red indicates high expression levels and blue indicates low expression levels. (E) Top 5 cuproptosis-related gene sets enriched based on pathway GSEA. (F) Top 5 cuproptosis-related gene sets enriched based on GO GSEA. BP, biological process; GO, Gene Ontology; GSEA, gene set enrichment analysis; KEGG, Kyoto Encyclopedia of Genes and Genomes; Padj value, adjusted P-value.
Figure 2
Figure 2
LASSO regression analysis for patients with glioblastoma. (A) Forest plot of risk score-related genes in the training set. (B) LASSO deviance profile of the 150 candidate genes. (C) LASSO regression coefficient profile of the 150 candidate genes. (D) mRNA expression profiles of nine risk score-related genes in a heatmap. (E) Survival probabilities of high-risk and low-risk groups. (F) ROC curve of the risk score of the training set. (G) mRNA expression of the nine risk score-related genes in the validation set. (H) Distribution of risk score in the low- and high-risk groups in the validation set. (I) Survival probabilities of the high- and low-risk score groups in the validation set. (J) Survival status of patients in the validation set. (K) ROC of the risk score of patients in the validation set. *P<0.05; **P<0.01; ***P<0.001. AIC, Akaike's Information Criterion; AUC, area under the curve; LASSO, least absolute shrinkage and selector operator; OS, overall survival; ROC, receiver operating characteristic.
Figure 3
Figure 3
Expression profiles of risk score-related genes. (A) Somatic mutation of nine risk score-related genes in the dataset from TCGA. (B) Volcano plot of differential methylation sites in the tumor and normal groups. (C) Volcano plot of DEGs in the tumor and normal groups. (D) DEGs and DMGs with a negative correlation in the tumor and normal groups. (E) Representative immunohistochemistry images of six prognostic proteins in tumor and normal tissues of the colon. Magnification, ×200. AEBP1, AE binding protein 1; CCM2, CCM2 scaffold protein; COL22A1, collagen type XXII α1 chain; DEG, differentially expressed gene; DMG, differentially methylated gene; NSUN5, NOP2/Sun RNA methyltransferase 5; OSMR, oncostatin M receptor; Padj value, adjusted P-value; RPL39L, ribosomal protein L39 like; TCGA, The Cancer Genome Atlas.
Figure 4
Figure 4
Biofunction analysis of risk score-related genes via single-cell RNA sequencing. (A) GBM tissues were categorized into three clusters (16). (B) Scatter plots of the risk score distribution. (C) Relative expression value of nine risk score-related genes in GBM cell states. (D) Trajectory of eight risk score-related genes. 1-3 represents the development period of tumors, which was divided into three stages, from 1 to 3. (E) Pseudotime trajectories of macrophages containing three main branches. (F) Pseudotime trajectories of macrophages containing three main branches for different genes. GBM, glioblastoma; NA, not applicable; tSNE, t-distributed stochastic neighbor embedding.
Figure 5
Figure 5
Immune cell infiltration analysis. (A) Mean proportion of 22 immune cell types in patients in the high-risk group. (B) Mean proportion of 22 immune cell types in the patients in the low-risk group. (C) Correlation matrix of all 22 immune cell proportions. (D) Differences in the 22 immune cell types between the high- and low-risk groups. *P<0.05; **P<0.01; ***P<0.001. GBM, glioblastoma; NK, natural killer; ns, not significant; TCGA, The Cancer Genome Atlas; Treg, regulatory T cell.
Figure 6
Figure 6
Exploration of compounds and sensitive drugs targeting risk score-related genes. (A) Overview of the molecular docking analysis procedure. (B) Venn diagram of Ginseng target genes and risk score-related genes. (C) 3D map of the binding of COL22A1 with kaempferol. (D) 3D map of the specific binding site of COL22A1 with kaempferol. (E) Correlation analysis and (F) box plot of drug sensitivity for different drugs in different risk score groups. COL22A1, collagen type XXII α1 chain; Cor, correlation coefficient; DEG, differentially expressed gene; DL, drug-likeness; GBM, glioblastoma; LASSO, least absolute shrinkage and selector operator; ns, not significant; OB, oral bioavailability.
Figure 7
Figure 7
Silencing of COL22A1 enhances glioblastoma cuproptosis. (A) Cell Counting Kit-8 assays were performed in shNC and shCOL22A1 LN229 and A172 cell lines. (B) Colony formation assays were performed in shNC and shCOL22A1 LN229 and A172 cell lines. (C) ROS levels of shNC and shCOL22A1 LN229 and A172 cells exposed to increasing doses of elesclomol for 24 h. (D) Concentration of copper following exposure to increasing doses of elesclomol for 24 h in shNC and shCOL22A1 LN229 and A172 cell lines. (E) Western blotting detecting the representative marker (FDX1) of cuproptosis in shNC or shCOL22A1 LN229 and A172 cells following exposure to increasing doses of elesclomol for 24 h. (F) Transmission electron microscopy images were captured following exposure to increasing doses of elesclomol for 24 h in shNC or shCOL22A1 LN229 cells. Scale bar, 20 µm. (G) Protein levels of COL22A1 in LN229 and A172 cells treated with DMSO or kaempferol combined with EMD-1204831 examined by western blotting. Data are presented as the mean ± SD of three experiments. ***P<0.001, ****P<0.0001 vs. controls. ACTB, actin β; COL22A1, collagen type XXII α1 chain; ES, elesclomol; FDX1, ferredoxin 1; NC, negative control; ns, not significant; OD, optical density; ROS, reactive oxygen species; sh, short hairpin RNA.
Figure 8
Figure 8
EMD-1204831 and kaempferol synergistically treat glioblastoma in vitro. (A) EC50 of kaempferol and EMD-1204831. (B) Proper concentrations were detected in LN229 cell lines that were treated with EMD-1204831 in combination with kaempferol. (C) Cell percentages were detected in LN229 cell lines that were treated with EMD-1204831 in combination with kaempferol. (D) CCK-8 assay of LN229 and A172 cells that were treated with EMD-1204831 in combination with kaempferol. (E) Colony formation assays were performed in LN229 and A172 cell lines that were treated with EMD-1204831 in combination with kaempferol. Data are presented as the mean ± SD of three experiments. ****P<0.0001 vs. controls. CCK-8, Cell Counting Kit-8; EC50, median effect concentration; HSA, highest single agent; OD, optical density.
Figure 9
Figure 9
EMD-1204831 and kaempferol synergistically treat glioblastoma in vivo. (A) Gross tumor tissue images of each group. (B) Statistical analysis of tumor tissue volume in each group. (C) Statistical analysis of tumor tissue weight in each group. (D) Ki67 staining of tumor tissue in each group. Scale bar, 5 or 100 µm as indicated. Magnification, ×10 or ×200 as indicated. (E) Intracranial tumorigenesis mice were treated with kaempferol, EMD-1204831 or the combination. Representative tumor images. (F) H&E staining of tumors. Scale bar, 2 mm. Data are presented as the mean ± SD of three experiments. *P<0.01, ***P<0.001, ****P<0.0001 vs. controls.
Figure 10
Figure 10
Combination of EMD-1204831 and kaempferol sensitizes glioblastoma to cuproptosis inducers. (A) Cell viability of LN229 and A172 cells following exposure to increasing doses of elesclomol for 24 h. (B) ROS level of LN229 and A172 cells treated with DMSO or kaempferol combined with EMD-1204831 while exposed to increasing doses of elesclomol for 24 h. (C) Concentration of copper following exposure to increasing doses of elesclomol for 24 h in LN229 and A172 cells treated with DMSO or kaempferol combined with EMD-1204831. (D) Representative markers of cuproptosis in LN229 and A172 cells treated with DMSO or kaempferol combined with EMD-1204831 while exposed to increasing doses of elesclomol for 24 h examined by western blotting. (E) Transmission electron microscopy images captured following exposure to increasing doses of elesclomol for 24 h in LN229 cells treated with DMSO or kaempferol combined with EMD-1204831. Scale bar, 20 µm. Data are presented as the mean ± SD of three experiments. *P<0.05, **P<0.01, ***P<0.001, ****P<0.0001 vs. control. DLAT, dihydrolipoamide S-acetyltransferase; DLST, dihydrolipoamide S-succinyltransferase; ES, elesclomol; FDX1, ferredoxin 1; Lip, lipoylation; ns, not significant; ROS, reactive oxygen species.

Similar articles

References

    1. Ostrom QT, Gittleman H, Liao P, Rouse C, Chen Y, Dowling J, Wolinsky Y, Kruchko C, Barnholtz-Sloan J. CBTRUS statistical report: Primary brain and central nervous system tumors diagnosed in the United States in 2007-2011. Neuro Oncol. 2014;16(Suppl 4):iv1–iv63. doi: 10.1093/neuonc/nou223. - DOI - PMC - PubMed
    1. Salcman M. Glioblastoma multiforme. Am J Med Sci. 1980;279:84–94. doi: 10.1097/00000441-198003000-00001. - DOI - PubMed
    1. Dolecek TA, Propp JM, Stroup NE, Kruchko C. CBTRUS statistical report: Primary brain and central nervous system tumors diagnosed in the United States in 2005-2009. Neuro Oncol. 2012;14(Suppl 5):v1–v49. doi: 10.1093/neuonc/nos218. - DOI - PMC - PubMed
    1. Ala A, Walker AP, Ashkan K, Dooley JS, Schilsky ML. Wilson's disease. Lancet. 2007;369:397–408. doi: 10.1016/S0140-6736(07)60196-2. - DOI - PubMed
    1. Kahlson MA, Dixon SJ. Copper-induced cell death. Science. 2022;375:1231–1232. doi: 10.1126/science.abo3959. - DOI - PubMed

LinkOut - more resources