. 2025 Apr 10;53(7):gkaf307.
doi: 10.1093/nar/gkaf307.

Rapid discovery of functional RNA domains

Affiliations

Rapid discovery of functional RNA domains

Brandon Latifi et al. Nucleic Acids Res. .

Abstract

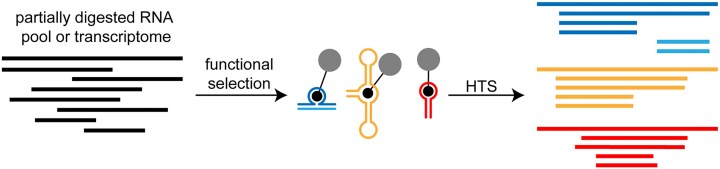
Many strategies have been implemented to enrich an RNA population for a selectable function, but demarcation of the optimal functional motifs or minimal structures within longer libraries remains a lengthy and tedious process. To overcome this problem, we have developed a technique that isolates minimal active segments from complex heterogeneous pools of RNAs. This method allows for truncations to occur at both 5' and 3' ends of functional domains and introduces independent primer-binding sequences, thereby removing sequence and structure bias introduced by constant-sequence regions. We show examples of minimization for genomic and synthetic aptamers and demonstrate that the method can directly reveal an active RNA assembled from multiple strands, facilitating the development of heterodimeric structures used in cellular sensors. This approach provides a pipeline to experimentally define the boundaries of active domains and accelerate the discovery of functional RNAs.


Conflict of interest statement

None declared.

Figures

Graphical Abstract
Graphical Abstract
Figure 1.
Figure 1.
A schematic of high-throughput identification of minimized RNA domains. RNA (black) is first hydrolyzed to produce truncated variants of the RNA population (step 1). A selection is performed to isolate a function of interest (step 2) and a DNA adaptor is ligated to the 3′ end of the RNA (step 3) to serve as a primer-binding region for reverse transcription (RT) (step 4). After RT, a DNA hairpin adaptor is ligated to the 3′ end of the newly generated cDNA (gray, step 4) to serve as a primer-binding site for PCR. Finally, the cDNA is amplified with the newly appended primer-binding sites (step 5) and subsequently analyzed by HTS.
Figure 2.
Figure 2.
Experimental demarcation of the human FGD3 adenosine aptamer domain. (A) A secondary structure model of the aptamer identified by genomic SELEX [21]. The adenosine-binding loop is outlined with a red box; yellow nucleotides represent the primer-binding regions derived from the in vitro selection pool. Arrows mark truncations that commonly occurred at the 5′ (black) and 3′ (red) ends of the reselected truncated pool. (B) Mapping of minimized sequences to the full-length genomic FGD3 aptamer. The graph displays the distribution of the 5′ (black) and 3′ (red) termini. (C) Alignment of the top 40 most common sequences from the minimization experiment. Red boxes show the location of the adenosine-binding loop. (D) FGD3 (76–165) aptamer secondary structure and its binding to ATP-agarose beads. FT: flow-through; ATP: competitive elution with free ATP (5 mM). (E) An internal deletion observed in the FGD3 aptamer. The nucleotides highlighted in blue (107 and 144) show the positions of the deletion within the sequence. ATP column binding profile of the FGD3 (Del) shows binding and elution profile almost identical to the truncated sequence shown in panel (D). (F) A heterodimeric minimized domain revealed by modeling of the cofolding of nonoverlapping sequences shown from the CircLigase experiment. The binding of individual strands (shown as % competitively eluted) was compared with ATP column binding by the heterodimer (see Supplementary Fig. S5 for full binding profiles). The blue (top strand) and black (bottom strand) nucleotides within the split heterodimer represent the sequences from the 5′ and 3′ segments, respectively. The alignment shows the shortest nonoverlapping sequences predicted to form the minimal split-aptamer domain. All minimized secondary structure models were based on computational predictions using ViennaRNA [59].
Figure 3.
Figure 3.
Demarcation of the minimized Were-1 photoriboswitch aptamer domain. (A) Mapping of minimized sequences to the Were-1 riboswitch. The original model of the riboswitch secondary structure, with the pink letters representing positions derived from random regions of the starting in vitro selection pool and blue representing partially randomized positions. Nucleotides in black represent primer-binding regions of the pool. (B) Graph depicting nucleotide positions with the highest representation among the truncated and reselected sequences mapped to the Were-1 riboswitch. (C) Most common 5′ and 3′ termini among truncated sequences after selection for a-tSS binding. The three most frequent start and end positions, labeled in black and red respectively, are indicated in the secondary structure model in panel (A). (D) Top 20 most abundant truncated sequences aligned to full-length Were-1. Three populations were observed: sequences aligned to the middle of the sequence, likely forming a cis aptamer, and two nonoverlapping populations extending to the termini of the riboswitch that likely form trans (heterodimeric) aptamers. (E) Native RNase T1 probing of Were-1 (25–103). Lanes from left to right: undigested RNA (ctrl), digested G-sequencing (T1), partial hydrolysis ladder (OH), and partial T1 digestion in the presence of increasing a-tSS concentrations, with ligand concentrations indicated above the PAGE gel image. Plot of the estimated fraction of RNA bound versus a-tSS concentration. Fraction bound values were calculated by measuring the band intensities at four sites (G42, G46, G49, and G77) and fitting to a simple KD model. Band intensities were normalized to positions G60 and G69. A lower contrast version of the gel image is shown in Supplementary Fig. S12 .(F) Secondary structure model of the Were-1 (25–103) aptamer based on the native RNase T1 probing gel depicted in panel (E). Asterisks indicate positions that were less susceptible to native RNase T1 cleavage in the presence of ligand.
Figure 4.
Figure 4.
Identification and minimization of a novel Ni-NTA aptamer. (A) Full-length sequence and proposed secondary structure of a novel Ni-NTA–binding aptamer as predicted by ViennaRNA [59]. Regions in blue represent the primer-binding regions from the in vitro selection pool. Nucleotides in black and red are from the random regions of the pool. Arrows indicate 5′ (black) and 3′ truncations (red) identified in the minimization experiment. (B) The top ten clusters were plotted to indicate the relative abundance within the mapped populations. (C) HTS read depth of the 5′ start sites (black) and 3′ truncation sites (red) mapped to the parent sequence. (D) Top 10 clusters aligned to the parent sequence (A). The red box outlines the common region among the sequences. (E) Predicted secondary structure model of the minimized Ni-NTA aptamer represented by cluster 2. (F) The minimized Ni-NTA aptamer binding to the Ni-NTA resin and eluted with imidazole at indicated concentrations.

References

    1. Tuerk C, Gold L Systematic evolution of ligands by exponential enrichment: RNA ligands to bacteriophage T4 DNA polymerase. Science. 1990; 249:505–10.10.1126/science.2200121. - DOI - PubMed
    1. Ellington AD, Szostak JW In vitro selection of RNA molecules that bind specific ligands. Nature. 1990; 346:818–22.10.1038/346818a0. - DOI - PubMed
    1. Martini L, Meyer AJ, Ellefson JW et al. . In vitro selection for small-molecule-triggered strand displacement and riboswitch activity. ACS Synth Biol. 2015; 4:1144–50.10.1021/acssynbio.5b00054. - DOI - PubMed
    1. Harbaugh SV, Martin JA, Weinstein J et al. . Screening and selection of artificial riboswitches. Methods. 2018; 143:77–89.10.1016/j.ymeth.2018.05.012. - DOI - PubMed
    1. Sabeti PC, Unrau PJ, Bartel DP Accessing rare activities from random RNA sequences: the importance of the length of molecules in the starting pool. Chem Biol. 1997; 4:767–74.10.1016/S1074-5521(97)90315-X. - DOI - PubMed