. 2025 Jun 24;64(26):e202504866.
doi: 10.1002/anie.202504866. Epub 2025 May 5.

Supramolecular Recognition of a DNA Four-Way Junction by an M2L4 Metallo-Cage, Inspired by a Simulation-Guided Design Approach

Affiliations

Supramolecular Recognition of a DNA Four-Way Junction by an M2L4 Metallo-Cage, Inspired by a Simulation-Guided Design Approach

Samuel J Dettmer et al. Angew Chem Int Ed Engl. .

Abstract

DNA four-way junctions (4WJs) play an important biological role in DNA repair and recombination, and viral regulation, and are attractive therapeutic targets. Compounds that recognise the junction structure are rare; in this work, we describe cationic metallo-supramolecular M2L4 cages as a new type of 4WJ binder with nanomolar affinities. A combination of molecular dynamics (MD) simulations and biophysical experiments show that the size and shape of a compound comprising square planar Pd or Pt and anthracene-based ligands is an excellent fit for the 4WJ cavity. Whilst the cage is also capable of binding to three-way junctions (3WJs) and Y-fork structures, we show that the 4WJ is the preferred DNA target, and that duplex B-DNA is not a competitor. Among 3WJs, T-shape bulged 3WJs are bound more preferably than perfect Y-shaped 3WJs. Whilst previous work studying M2L4 metallo-supramolecular cages has focused on binding inside their structures, this work exploits the external aromatic surfaces of the supramolecule, creating a supramolecular guest that ideally matches the DNA host cavity. This approach allows available structures to be identified as potential junction binders and then screened for their fit to a nucleic acid junction target using simulations. This has potential to significantly accelerate discovery.

Keywords: Bio‐inorganic; DNA four‐way junctions; DNA‐recognition; Metallo‐cage; Supramolecular chemistry.


Conflict of interest statement

The authors declare no conflict of interest.

Figures

Figure 1
Figure 1
a) 3D structure of an iron triple‐helicate cylinder (left) and the crystal structure of the cylinder bound inside the cavity of a 3WJ (PDB 2ET0; right).[ 12 ] b) Chemdraw image of a bis‐acridine bis‐intercalator (left) and the crystal structure of this compound bound to a 4WJ in the closed conformation (PDB 2GWA; right).[ 23 ] c) 3D structure of an organometallic Au pillarplex (left) and a molecular dynamics snapshot of this compound bound inside the cavity of a 4WJ in the open conformation (right).[ 24 ] d) Chemdraw structure of Zhou and Sun's palladium cage (left) and end‐on and side‐on views of the 3D structure this cage (CCDC 1048711; right).[ 25 ] Hydrogens have been omitted for clarity in all images.
Figure 2
Figure 2
a) MD snapshot of the M enantiomer of Pt‐BIMA bound inside the 4WJ (adapted from PDB 1XNS). PtBIMA remains inside the cavity for the duration of the simulations. Close up images of each enantiomer bound in the 4WJ, where only branchpoint base pairs are shown (orange sticks) and the anthracene units on PtBIMA are shown in pink. b) DNA sequences used in this work.
Figure 3
Figure 3
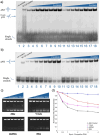
PAGE gels showing binding of Pd‐BIMA and Pt‐BIMA to (a) 4WJ and (b) 3WJ. Gels contains DNA alone (lane 1), DNA + Ni Cylinder (lane 2), DNA + 0.25, 0.5, 1, 1.5, 2, 3, 4, 5 equiv. Pd‐BIMA (lanes 3–10) and DNA + 0.25, 0.5, 1, 1.5, 2, 3, 4, 5 equiv. Pt‐BIMA (lanes 11–18). Gel samples were made up in 1X TB (89 mM Tris base, 89 mM boric acid) and 50Mm NaCl and incubated at 37 °C for 1 h prior to loading. c) Representative PAGE competition gels of 4WJ‐18 versus: 4WJ (control), Y fork, dsDNA and 3WJ. Lanes consist of 4WJ + 1 equivalent Pt‐BIMA with increasing amounts of competitor DNA (0, 0.5, 1, 2, 3, 4 equivalents). Samples were made up in 1X TB and 50 mM NaCl and incubated at 37 °C for 1 h prior to loading. d) Normalised fluorescence intensities of the 4WJ band (represented as % of total fluorescence) in the PAGE competition assays of a fluorescent FAM‐labelled 4WJ‐18 versus 4WJ (control), dsDNA, Y fork and 3WJ DNA at increasing equivalents (0, 0.5, 1, 2, 3, 4). Each data point represents the average of three experiments, normalised to the average fluorescence intensity of the 4WJ band in the absence of competitor.
Figure 4
Figure 4
a) UV melting curves of 4WJ with (red) and without (black) 1 equivalent of Pt‐BIMA (10 mM Na cacodylate, 50 mM NaOAc, 0.05% DMSO). Each curve was normalised to its highest and lowest absorbance measurements. Error bars represent standard deviation of three biological replicates. b) MST dose response curve of Pt‐BIMA titrated from 5 µM to 153 pM into 20 nM FAM‐labelled 4WJ‐22. Each data point was measured as the average fluorescence intensity 20 seconds after irradiation of the IR laser and plotted as the average of three repeats. The data was fitted using a Kd model and the binding constant taken as the concentration at the halfway point of the curve. c) MST dose response curves corresponding to the competition experiments, in which unlabelled 3WJ (burgundy), dsDNA (blue) and 4WJ (green) were titrated into a mixture of 20 nM FAM‐labelled 4WJ‐22 and 80 nM Pt‐BIMA. The green 4WJ curve was fitted to a displacement model. The straight blue and burgundy lines demonstrate that there is no displacement fit for these curves.
Figure 5
Figure 5
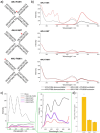
a) Schematic drawing of the fluorescently labelled 4WJ structures (4WJ‐FAM). The red star denotes the position of the fluorophore. b) Fluorescence excitation and emission spectra for (top to bottom) 4WJ‐FAM1, 4WJ‐FAM7 and 4WJ‐FAM11 in the absence (black) and presence (red) of 1 equivalent Pt‐BIMA (all 5 µM DNA, 10 mM HEPES, 50 mM NaOAc). Excitation spectra were recorded by monitoring the emission at 520 nm with a 475 nm cutoff filter. Emission spectra were recorded by exciting at 375 nm. Spectra for control samples containing Pt‐BIMA alone and with unlabelled 4WJ, and corresponding absorbance spectra for all samples can be seen in the supporting information (Figures S33, S34). c) Zoom in and overlay of the emission curves of Pt‐BIMA in the region 390–480 nm, where Pt‐BIMA emits. The portion of the graph in the green box shows a further zoom in on the quenched anthracene bands. d) Bar chart showing the ratio of the 520 nm FAM emission band in the presence of Pt‐BIMA to the same band in the absence of Pt‐BIMA, measured as the area under the curve. The bars represent the average of two samples, and the black crosses represent the individual datasets (for FAM11, they overlap).
Figure 6
Figure 6
a) MD snapshot of the M enantiomer of Pt‐BIMA bound inside a frayed 3WJ (frayed base pairs shown in pink). Hydrogens are omitted for clarity. b) MD snapshot of the M enantiomer bound to a T‐shaped two‐base‐bulged 3WJ after rearrangement caused by fraying of two base pairs (shown in pink and green). Hydrogens are omitted for clarity. c) PAGE gel showing binding of Pd‐BIMA and Pt‐BIMA to a bulged 3WJ. Gel contains 3WJ (lanes 1–2), mismatched mm3WJ (lanes 3–5). The dotted line represents a splice point, as three lanes of this gel are not included for clarity (full raw image Figure S36). d) PAGE gel showing binding of Pd‐BIMA and Pt‐BIMA to bulged 3WJs. Gel contains one‐base‐bulged 3WJ (lanes 1–3), two‐base‐bulged 3WJ (lanes 4–6) and 3WJ (lanes 7–8; aliquots of same samples used in lanes 1 and 2 of Figure 6c). The gels in parts 6c and 6d were run in parallel under identical conditions (details in Figure S36). e) Plot of normalised intensity of the 3WJ band upon increasing additions of competitor 3WJ S1 (i.e., zero‐base‐bulged), one‐base‐bulged 3WJ S1 and two‐base‐bulged 3WJ S1. Each data point is plotted as the average of at least three independent samples with associated error bars. f) Normalised fluorescence intensities of the 4WJ band (represented as % of total fluorescence) in PAGE competition assays of a fluorescent FAM‐labelled 4WJ versus 4WJ (control), 3WJ, one‐base‐bulged 3WJ and two‐base‐bulged 3WJ DNA at increasing equivalents (0, 0.5, 1, 2, 3, 4). Each data point represents the average of three experiments, normalised to the average fluorescence intensity of the 4WJ band in the absence of competitor. g) MD snapshot of the M enantiomer of Pt‐BIMA bound inside a one‐base‐bulged 3WJ (adapted from PDB 1F44). The unpaired base is highlighted in pink. Hydrogens are omitted for clarity.

Similar articles

References

    1. Zhang C., Xu C., Gao X., Yao Q., Theranostics 2022, 12, 2115–2132. - PMC - PubMed
    1. Kenny R. G., Marmion C. J., Chem. Rev. 2019, 119, 1058–1137. - PubMed
    1. Rottenberg S., Disler C., Perego P., Nat. Rev. Cancer 2021, 21, 37–50. - PubMed
    1. Martins‐Teixeira M. B., Carvalho I., ChemMedChemChemMedChem 2020, 15, 933–948. - PubMed
    1. Ivens E., Cominetti M. M. D., Searcey M., Bioorg. Med. Chem. 2022, 69, 116897. - PubMed

LinkOut - more resources