. 2025 May 14;16(5):e0048525.
doi: 10.1128/mbio.00485-25. Epub 2025 Apr 17.

Fructose activates a stress response shared by methylglyoxal and hydrogen peroxide in Streptococcus mutans

Affiliations

Fructose activates a stress response shared by methylglyoxal and hydrogen peroxide in Streptococcus mutans

Alejandro R Walker et al. mBio. .

Abstract

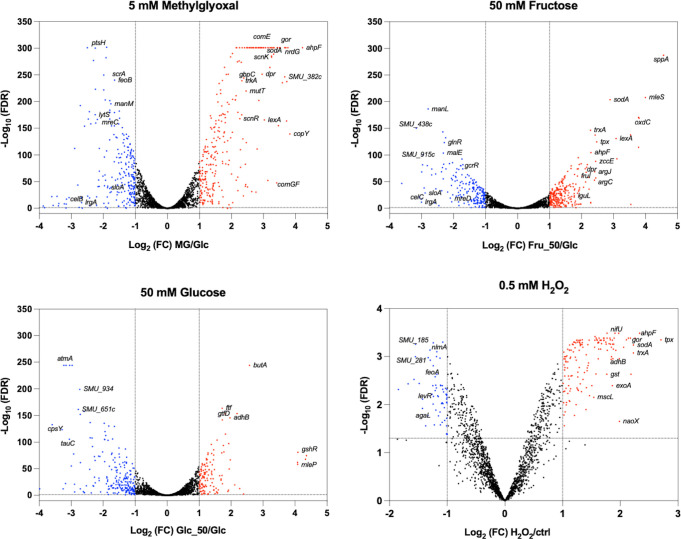
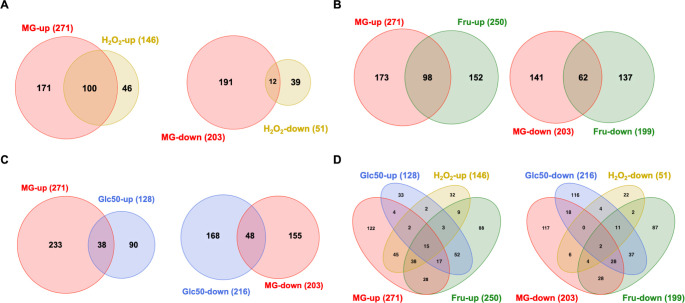
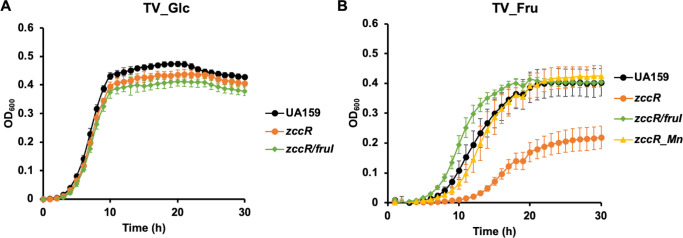
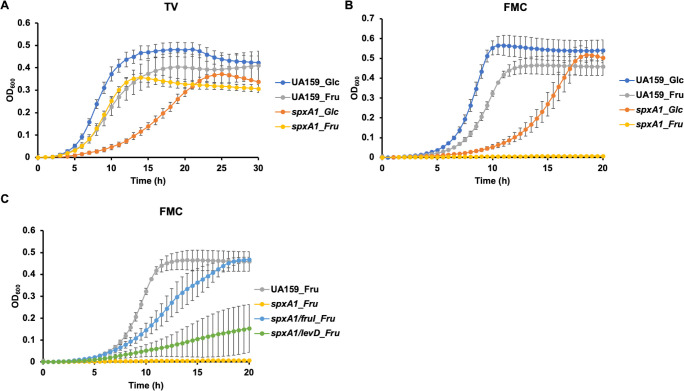
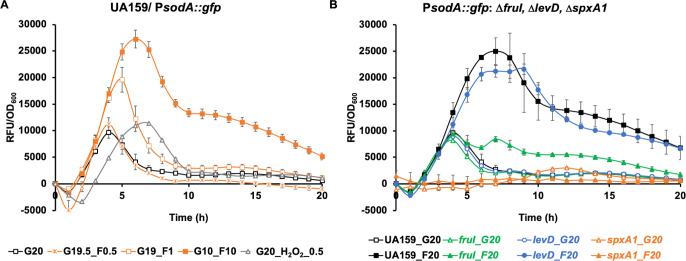
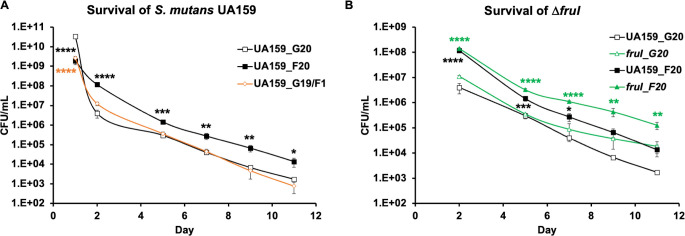
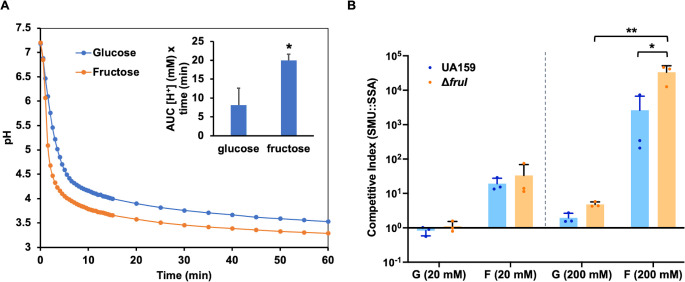
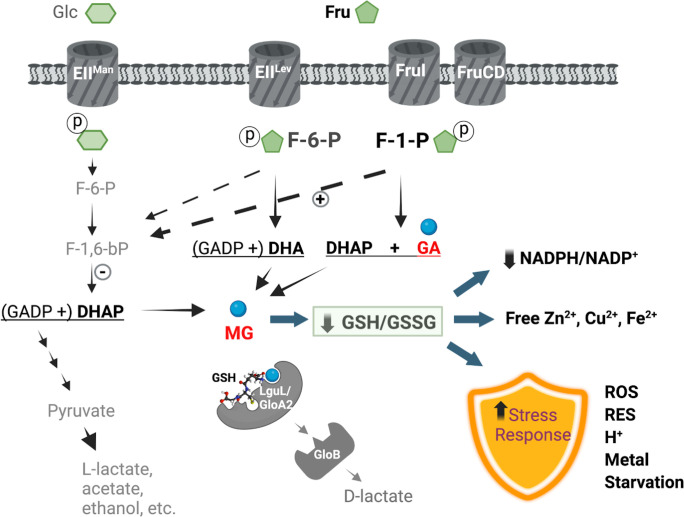
Fructose catabolism by Streptococcus mutans is initiated by three phosphotransferase (PTS) transporters yielding fructose-1-phosphate (F-1-P) or fructose-6-phosphate. Deletion of one such F-1-P-generating PTS, fruI, was shown to reduce the cariogenicity of S. mutans in rats fed a high-sucrose diet. Moreover, a recent study linked fructose metabolism in S. mutans to a reactive electrophile species methylglyoxal. Here, we conducted a comparative transcriptomic analysis of S. mutans treated briefly with 50 mM fructose, 50 mM glucose, 5 mM methylglyoxal, or 0.5 mM hydrogen peroxide (H2O2). The results revealed a striking overlap between the fructose and methylglyoxal transcriptomes, totaling 176 genes, 61 of which were also shared with the H2O2 transcriptome. This core of 61 genes encompassed many of the same pathways affected by exposure to low pH or zinc intoxication. Consistent with these findings, fructose negatively impacted the metal homeostasis of a mutant deficient in zinc expulsion and the growth of a mutant of the major oxidative stress regulator SpxA1. Importantly, fructose metabolism lowered culture pH at a faster pace, allowed better survival under acidic and nutrient-depleted conditions, and enhanced the competitiveness of S. mutans against Streptococcus sanguinis, although a moderated level of F-1-P might further boost some of these benefits. Conversely, several commensal streptococcal species displayed a greater sensitivity to fructose that may negatively affect their persistence and competitiveness in dental biofilm. In conclusion, fructose metabolism is integrated into the stress core of S. mutans and regulates critical functions required for survival and its ability to induce dysbiosis in the oral cavity.IMPORTANCEFructose is a common monosaccharide in the biosphere, yet its overconsumption has been linked to various health problems in humans including insulin resistance, obesity, diabetes, non-alcoholic liver diseases, and even cancer. These effects are in large part attributable to the unique biochemical characteristics and metabolic responses associated with the degradation of fructose. Yet, an understanding of the effects of fructose on the physiology of bacteria and its implications for the human microbiome is severely lacking. Here, we performed a series of analyses on the gene regulation of a dental pathogen Streptococcus mutans by exposing it to fructose and other important stress agents. Further supported by growth, persistence, and competition assays, our findings revealed the ability of fructose to activate a set of stress-related functions that may prove critical to the ability of the bacterium to persist and cause diseases both within and without the oral cavity.

Keywords: F-1-P; fructose; gene regulation; hydrogen peroxide; metal homeostasis; methylglyoxal; stress response.


Conflict of interest statement

The authors declare no conflict of interest.

Figures

Fig 1
Fig 1
Volcano plots illustrating transcriptomes of four treatments. S. mutans UA159 was grown to the exponential phase in a synthetic fortified M1 medium with citrate (FMC) containing 20 mM glucose. The samples were treated for 30 min with 5 mM methylglyoxal, 50 mM fructose, or 50 mM glucose before harvesting for mRNA sequencing. Differential expression analyses were performed against untreated cells using edgeR, with cutoffs for fold change >2 and false discovery rate (FDR) <0.05. Upregulated genes are shown in red and downregulated ones in blue. The results of treatment by H2O2 (0.5 mM, 5 min) were from an independent study (36).
Fig 2
Fig 2
Transcriptomic overlaps among treatments of methylglyoxal (MG), fructose, glucose, and H2O2. The Venn diagrams show the numbers of shared and unique genes in the genome of UA159, separated into groups of upregulated and downregulated, among treatments of (A) 5 mM MG and 0.5 mM H2O2, (B) MG and 50 mM fructose (Fru), (C) MG and 50 mM glucose (Glc50), and (D) all four treatments.
Fig 3
Fig 3
Fructose impacts metal homeostasis in ΔzccR deficient in zinc expulsion. S. mutans strains UA159 and its mutant derivatives were diluted from exponential phase cultures into TV supplemented with 20 mM glucose (A) or fructose (B). Mn2+ was added at 25 µM (MnSO4). Growth was monitored using a Synergy 2 plate reader maintained at 37°C. Results are an average of three biological replicates, each tested in technical duplicates. Error bars denote SDs.
Fig 4
Fig 4
Fructose impacts the growth of spxA1 in a medium-specific manner. S. mutans strains UA159 and various mutant derivatives were each diluted from exponential phase cultures into TV (A) or FMC (B and C) supplemented with 20 mM glucose (Glc) or fructose (Fru). Growth was monitored using a Synergy 2 plate reader maintained at 37°C. Results are an average of three biological replicates, each tested in technical duplicates. Error bars denote SDs.
Fig 5
Fig 5
Induction of the sodA promoter by fructose. (A) Cultures of UA159 harboring a PsodA::gfp fusion were diluted into FMC containing specified concentrations (in mM) of glucose (G), fructose (F), or H2O2. The cultures were monitored in a Synergy 2 plate reader for green fluorescence and optical densities (OD600) for 20 h. (B) The same experiment was performed on various mutants derived from UA159/PsodA::gfp, using FMC containing 20 mM glucose (G20) or fructose (F20). The relative fluorescence units (RFU) of each culture were recorded as a measure of sodA promoter activity, subtracted with RFUs of a control strain (the same genetic background but without the gfp fusion) cultured under the same condition, and normalized against corresponding OD600 values of the bacterial cultures. Results are the average from three biological replicates, conducted in technical duplicates. Error bars denote SDs.
Fig 6
Fig 6
Fructose promotes long-term survival of S. mutans. Cultures of S. mutans UA159 (A and B) or ∆fruI (B) were diluted into FMC containing 20 mM of glucose (G20) or fructose (F20), or a combination of 19 mM glucose and 1 mM fructose (G19/F1), followed by incubation without medium refreshment for 11 days. At specified time points, an aliquot of culture was removed for CFU enumeration. Each strain was represented by three independent cultures, with results presenting average and SD. Statistical significance was assessed using (A) one-way ANOVA followed by Dunnett’s comparisons against G20 samples and (B) two-way ANOVA followed by Tukey’s multiple comparisons against G20 samples (*, P < 0.05; **, P < 0.01; ***, P < 0.001; ****, P < 0.0001).
Fig 7
Fig 7
Fructose enhances acidogenicity (A) and competitiveness (B) of S. mutans. (A) pH drop assay. UA159 was cultured in TV with 20 mM glucose or fructose to exponential phase and harvested and resuspended in a solution of 50 mM KCl and 1 mM MgCl2, with OD600 adjusted to 5.0. The pH was adjusted to 7.2 slowly with 0.1 N KOH to consume intracellular carbohydrate storage. Immediately after the addition of 50 mM glucose or fructose, the same as the sugar used in the TV medium, the pH of the suspension was monitored continuously on a stirring plate for the next 60 min. Each experiment was repeated three times (Fig. S5), with representative results shown here. After conversion into proton concentrations, the area under the curve (AUC, see inset) of each sample was calculated and used to assess statistical significance using Student’s t-test (*, P < 0.05). (B) Cultures of S. mutans wild-type UA159 or ∆fruI were mixed at a 1:1 ratio with a differentially marked SSA strain, then diluted at 1:100 into FMC containing glucose (G) or fructose (F), each used at 20 mM or 200 mM. After 24 h of incubation, the cultures were sonicated and used for CFU enumeration. CFUs from both the start and end of the incubation (Fig. S6) were used to calculate competitive indices. The results were the average of three independent repeats, with error bars denoting SDs. Statistical significance was assessed using two-way ANOVA followed by Tukey’s multiple comparisons (*, P < 0.05; **, P < 0.01).
Fig 8
Fig 8
Fructose metabolism triggers a stress response in streptococci. Fructose is internalized by oral streptococci primarily through an F-1-P-generating PTS transporter, FruI, but also through two additional PTS permeases, including EIILev (LevDEFG) that generates F-6-P. Compared to the glucose pathway, fructose is likely catabolized more rapidly via glycolysis, during which RES such as methylglyoxal is accumulated and impacts cytoplasmic redox balance represented by the ratios of GSH/GSSG and NADPH/NADP+. Increased F-1-P kinase activities (denoted by a plus sign) and reduced expression of F-1,6-bP aldolase (by a minus sign) may further contribute to RES production through impeded F-6-P phosphorylation and increased cleavage of F-6-P into DHA. Also affected are the pools of intracellular metal ions. Sensing these and other not-yet-characterized physiological changes and specific metabolites, the bacterium reprograms a suite of stress-responsive genes. The outcomes of exposure to fructose include not only elevated activities in processing RES, through the functions of LguL/GloB and related protein GloA2, but importantly enhanced tolerance to multiple environmental stressors including ROS, RES, acidic pH, toxic metals, and nutrient depletion.

Update of

Similar articles

References

    1. Baker JL, Mark Welch JL, Kauffman KM, McLean JS, He X. 2024. The oral microbiome: diversity, biogeography and human health. Nat Rev Microbiol 22:89–104. doi:10.1038/s41579-023-00963-6 - DOI - PMC - PubMed
    1. Hsu CL, Schnabl B. 2023. The gut-liver axis and gut microbiota in health and liver disease. Nat Rev Microbiol 21:719–733. doi:10.1038/s41579-023-00904-3 - DOI - PMC - PubMed
    1. Willenborg J, Goethe R. 2016. Metabolic traits of pathogenic streptococci. FEBS Lett 590:3905–3919. doi:10.1002/1873-3468.12317 - DOI - PubMed
    1. Bowen WH, Burne RA, Wu H, Koo H. 2018. Oral biofilms: pathogens, matrix, and polymicrobial interactions in microenvironments. Trends Microbiol 26:229–242. doi:10.1016/j.tim.2017.09.008 - DOI - PMC - PubMed
    1. Tanner ACR, Kressirer CA, Rothmiller S, Johansson I, Chalmers NI. 2018. The caries microbiome: implications for reversing dysbiosis. Adv Dent Res 29:78–85. doi:10.1177/0022034517736496 - DOI - PubMed

MeSH terms

LinkOut - more resources