. 2025 May 14;16(5):e0386124.
doi: 10.1128/mbio.03861-24. Epub 2025 Apr 17.

Hidden origami in Trypanosoma cruzi nuclei highlights its non-random 3D genomic organization

Affiliations

Hidden origami in Trypanosoma cruzi nuclei highlights its non-random 3D genomic organization

Natália Karla Bellini et al. mBio. .

Abstract

The protozoan Trypanosoma cruzi is the causative agent of Chagas disease and is known for its polycistronic transcription, with about 50% of its genome consisting of repetitive sequences, including coding (primarily multigenic families) and non-coding regions (such as ribosomal DNA, spliced leader [SL], and retroelements, etc). Here, we evaluated the genomic features associated with higher-order chromatin organization in T. cruzi (Brazil A4 strain) by extensive computational processing of high-throughput chromosome conformation capture (Hi-C). Through the mHi-C pipeline, designed to handle multimapping reads, we demonstrated that applying canonical Hi-C processing, which overlooks repetitive DNA sequences, results in a loss of DNA-DNA contacts, misidentifying them as chromatin-folding (CF) boundaries. Our analysis revealed that loci encoding multigenic families of virulence factors are enriched in chromatin loops and form shorter and tighter CF domains than the loci encoding core genes. We uncovered a non-random three-dimensional (3D) genomic organization in which nonprotein-coding RNA loci (transfer RNAs [tRNAs], small nuclear RNAs, and small nucleolar RNAs) and transcription termination sites are preferentially located at the boundaries of the CF domains. Our data indicate 3D clustering of tRNA loci, likely optimizing transcription by RNA polymerase III, and a complex interaction between spliced leader RNA and 18S rRNA loci, suggesting a link between RNA polymerase I and II machineries. Finally, we highlighted a group of genes encoding virulence factors that interact with SL-RNA loci, suggesting a potential regulatory role. Our findings provide insights into 3D genome organization in T. cruzi, contributing to the understanding of supranucleosomal-level chromatin organization and suggesting possible links between 3D architecture and gene expression.IMPORTANCEDespite the knowledge about the linear genome sequence and the identification of numerous virulence factors in the protozoan parasite Trypanosoma cruzi, there has been a limited understanding of how these genomic features are spatially organized within the nucleus and how this organization impacts gene regulation and pathogenicity. By providing a detailed analysis of the three-dimensional (3D) chromatin architecture in T. cruzi, our study contributed to narrowing this gap. We deciphered part of the origami structure hidden in the T. cruzi nucleus, showing the unidimensional genomic features are non-randomly 3D organized in the nuclear organelle. We uncovered the role of nonprotein-coding RNA loci (e.g., transfer RNAs, spliced leader RNA, and 18S RNA) in shaping genomic architecture, offering insights into an additional epigenetic layer that may influence gene expression.

Keywords: CF unities; Hi-C; TAD boundaries; Trypanosoma cruzi; epigenetic; nonprotein-coding RNA loci; nuclear architecture.


Conflict of interest statement

The authors declare no conflict of interest.

Figures

Fig 1
Fig 1
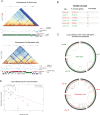
Inclusion of multimapped reads in Hi-C data analysis provides an enhancement of Hi-C contacts. (A) Juicebox view of individual Hi-C matrices obtained excluding multimapped reads via the HiCExplorer pipeline (upper panel). The inclusion of multimapped reads from the mHi-C pipeline is shown in the lower panel. The black rectangles highlight DNA‒DNA contacts and loop enhancement, and gap filling recovered to the repetitive regions (light blue tracks). DNA loops are commonly seen in Hi-C matrices as punctual dots, potentially enriched for disruptive regions of the genome (Chr 12 and Chr 25). Tracks seen above the individual matrices indicate multigenic families located in the GpDR (dark blue), disruptive (red) compartment, and core (green) compartment. (B) Hi-C contacts enhancement for the 18S array using the mHiC tool (UNI & MULTI), third matrix. UNI (first) and MULTI (second) matrices were generated using exclusively single-mapped and multimapped reads, respectively.
Fig 2
Fig 2
The core-rich chromosomes contain fewer DNA loops than disruptive/GpDR-rich ones. (A) Knight-Ruiz-normalized Hi-C heatmaps with the identification of loops (blue semicircles—x-axis) for a core-rich chromosome (chr 15) and a disruptive-rich chromosome (chr 12). (B) Analysis of chromosome pairs with differing core gene contents (e.g., chromosomes 6 and 7, 12 and 13, and 25 and 26). Chromosomes enriched in core genes (chr 7, 13, and 26) displayed fewer loops than did those enriched in disruptive genes (chr 6, 12, and 25). (C) Loop calling for core and disruptive enriched chromosomes. The Circos plot (https://circos.ca/) was used to draw the interactions. (D) Dot plot showing the number of loops (x-axis) per numbered chromosome. There is a negative correlation (R = −0.5) between the percentage of core genes (y-axis) and the number of loops (x-axis) across all 43 chromosomes, indicating that loops in T. cruzi are influenced by the linear genomic organization into core and disruptive compartments.
Fig 3
Fig 3
Repetitive DNA in Hi-C data analysis mitigates bias in CF calling and its boundaries. (A) Distribution of repetitive DNA (light blue) and nonrepetitive DNA (gray) within CF domains, boundaries, unstructured regions, and the genome (control) compared with the results obtained when processing Hi-C data excluding multimapped reads, HiCExplorer, upper panel, or including it, mHiC, lower panel, pipelines. *** P-value < 0.01 using the χ2 test (False Discovery Rate [FDR]-adjusted P-values). (B) Shifts in TAD boundaries (vertical dashed lines) and CF domains (black triangles). The exclusion of repetitive reads causes an enrichment of CF domain boundaries in repetitive regions (e.g., chromosomes 4 and 5), while their inclusion shifted some boundaries to nonrepetitive regions, indicating biases in TAD calling due to the exclusion of multimapped reads.
Fig 4
Fig 4
The non-random positioning of T. cruzi genomic features along CF domains, their boundaries, and unstructured regions. (A) Distribution profile of core, disruptive, and GpDR genes across 3D structures (CF domains, boundaries, and unstructured regions) compared to the genome as a control. GpDR (blue) genes and disruptive (red) compartments are enriched in unstructured regions. The others (gray) represent all genomic sequences that remained after excluding the core, disruptive, and GpDR sequences. (B) Distribution of genes and pseudogenes across the 3D structures. Pseudogenes (light purple) show a predominance in unstructured regions. The others (gray) represent all the genomic sequences that remained after excluding genes and pseudogenes. (C) Distribution of extragenomic regions, specifically cSSR and dSSR sites, with cSSR sites predominantly located at boundaries. (D) Distribution of small RNA genes (rRNA, snoRNA, snRNA_U, tRNA, and mRNA) across 3D genomic structures. Notably, snoRNA, snRNA_U, and tRNA loci are preferentially located at CF domain boundaries. For A to D, the χ2 test indicates significance for False Discovery Rate FDR-adjusted P-values <0.05. From A to D, the percentages represent the abundance of each feature (in length, bp) divided by the length of each 3D compartment, or by the entire genome length, for the controls. (E) Co-localization of snRNAs, tRNAs, snoRNA genes, and cSSR at CF domain boundaries for chromosomes 2, 17, and 4. (F) Model illustrating the preferential positioning of target genomic features within the 3D nuclear architecture.
Fig 5
Fig 5
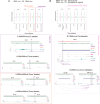
Virtual 4C analysis of tRNA loci as VPs. Panels (A) and (B) display the comparison of DNA‒DNA interaction frequencies (log10) for tRNA loci with RNA loci and 3D genomic structure, respectively. For each target (purple boxplots), their control counterparts (green boxplots) are compared. Significant differences are indicated by ***P < 0.001 and ****P < 0.0001 (for False Discovery Rate FDR-adjusted P-values). Rectangles in orange, purple, and rose indicate genomic features that have a greater frequency of contacts with tRNA genes than with their respective controls. The orange arrows indicate whether the interactions observed for VPs are above or below the control interactions. (A) Integrative Genomics Viewer snapshots depicting cis-acting, intra, (A.1) and trans-acting, inter, (A.2) chromosomal contacts between the tRNA locus (VP) and other tRNA loci. Trans-acting (A.3 and A.4) interactions between the tRNA locus (VP) and snoRNA locus. (B) Significant interactions highlight that DNA‒DNA contacts are frequent between tRNAs and CF domain boundaries in addition to the extragenomic regions cSSRs and dSSRs (rose rectangle). Cis-acting (B.1) and trans-acting (B.2) chromosomal contacts among the tRNA locus (VP), 3D structures, and extragenomic regions.
Fig 6
Fig 6
The 3D contacts involving the SL-RNA loci in T. cruzi. (A) Virtual 4C plot profile. The plot shows interaction frequencies of SL-RNA loci (VPs), orange plot, across the entire genome (the x-axis represents the genomic coordinates to all 43 chromosomes). Control viewpoints are included for comparison via flipped gray plots. A zoomed-in view of chromosome 23 depicts the viewpoints (VP1 and VP2) of origin for the SL-RNA loci, highlighting the interaction frequencies with the 18S rRNA, 5.8S rRNA, and 24S rRNA loci, excluding the 5S rRNA loci. (B) The top 1 to top 3 plots focused on the greatest number of DNA‒DNA interactions between SL-RNA loci and other genomic regions, indicating significant 3D nuclear architecture features.
Fig 7
Fig 7
The 3D contacts involving the rRNA loci in T. cruzi. The plot profile highlights the virtual 4C results for the rRNA loci (VPs), purple plots, across the entire genome (the x-axis represents the genomic coordinates of all 43 chromosomes). Control viewpoints are included for comparison via flipped gray plots. A zoomed-in image of chromosome 16 shows the origin of the 18S rRNA, 5.8S rRNA, and 24S rRNA loci. SL-RNA locus interaction sites are highlighted, and no remarkable interactions are observed between the three rRNA genes (18S, 5.8S, and 24S) and the 5S rRNA locus. (B) The top (1 and 2) DNA‒DNA interactions involving the 18S rRNA locus. The figure includes annotations for genomic elements such as core genes and histone H4 regions.
Fig 8
Fig 8
The spatial organization of chromatin within the nuclei of T. cruzi and its resemblance to origami art. (A) The non-random 3D nuclear architecture of T. cruzi. (1) Illustration of CF domains and loop formation, showing fewer loops in the core compartment and an increased number of loops in disruptive/GpDR genes. (2) Genomic features relevant to 3D structure formation. (3) Nucleolar organization: representation of the nucleolus, highlighting the localization of 18S rRNA loci (Pol I machinery) and SL-RNA loci (Pol II machinery). (4) DNA‒DNA interactions involving rRNA loci, the histone H4 array, and SL-RNA loci. (5) Prominent nuclear interaction networks in T. cruzi reveal frequent interactions between SL-RNA loci and disruptive/GpDR genes. (6) In contrast, core genes frequently interact with 18S rRNA loci. (B) Resemblance between origami art and chromatin folding. Steps “a” to “l” show the process of folding a flat piece of paper from its unidimensional view up to its 3D form.

References

    1. Lidani KCF, Andrade FA, Bavia L, Damasceno FS, Beltrame MH, Messias-Reason IJ, Sandri TL. 2019. Chagas disease: from discovery to a worldwide health problem. Front Public Health 7:166. doi:10.3389/fpubh.2019.00166 - DOI - PMC - PubMed
    1. Gilinger G, Bellofatto V. 2001. Trypanosome spliced leader RNA genes contain the first identified RNA polymerase II gene promoter in these organisms. Nucleic Acids Res 29:1556–1564. doi:10.1093/nar/29.7.1556 - DOI - PMC - PubMed
    1. Teixeira SM, de Paiva RMC, Kangussu-Marcolino MM, Darocha WD. 2012. Trypanosomatid comparative genomics: contributions to the study of parasite biology and different parasitic diseases. Genet Mol Biol 35:1–17. doi:10.1590/s1415-47572012005000008 - DOI - PMC - PubMed
    1. Clayton C. 2019. Regulation of gene expression in trypanosomatids: living with polycistronic transcription. Open Biol 9:190072. doi:10.1098/rsob.190072 - DOI - PMC - PubMed
    1. Herreros-Cabello A, Callejas-Hernández F, Gironès N, Fresno M. 2020. Trypanosoma cruzi genome: organization, multi-gene families, transcription, and biological implications. Genes (Basel) 11:1196. doi:10.3390/genes11101196 - DOI - PMC - PubMed

LinkOut - more resources