Differential Temperature-Induced Responses in Immortalized Oral and Skin Keratinocytes
- PMID: 40243437
- PMCID: PMC11988828
- DOI: 10.3390/ijms26072851
Differential Temperature-Induced Responses in Immortalized Oral and Skin Keratinocytes
Abstract
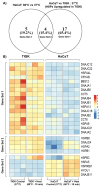
The epidermis of the skin and oral mucosa is constantly exposed to various environmental stimuli, including temperature changes. In particularly extreme conditions, such as excess heat or cold, significant injury may occur. Oral and skin keratinocytes exhibit tissue-specific differences in wound healing outcomes and the transcriptomic response to injury. This study investigated if skin and oral keratinocytes also have differential responses to heat- and cold-induced injury. Oral keratinocytes (TIGKs) were found to exhibit an enhanced viability following heat-induced injury compared to skin keratinocytes (HaCaTs). However, there were no discernible differences between skin and oral keratinocyte viability following cold-induced injury. To examine the transcriptomic differences between skin and oral keratinocytes in response to temperature-induced injury, we generated an mRNA-sequencing gene expression dataset. Differentially expressed genes (DEGs) including heat shock proteins (HSPs) were identified between HaCaTs and TIGKs at baseline (37 °C) and after heat- (60 °C) or cold-induced (-25 °C) injury. Our comparative analyses suggest that skin and oral keratinocytes exhibit transcriptomic differences at baseline and in their responses to heat or cold exposure. The enhanced heat tolerance of TIGKs relative to HaCaTs may be due to an advantageous expression of a subset of HSPs at baseline in TIGKs. Our work also provides a source of skin and oral keratinocyte gene expression data following heat- and cold-induced injury that can be used for future analyses.
Keywords: keratinocyte; oral mucosa; skin; temperature-induced injury; transcriptomics.
Conflict of interest statement
The authors declare no conflicts of interest.
Figures


Similar articles
-
Transcriptomic Differences Between Immortalized Oral and Skin Keratinocytes.FASEB J. 2025 Jun 30;39(12):e70744. doi: 10.1096/fj.202500374R. FASEB J. 2025. PMID: 40540308 Free PMC article.
-
Differential Expression and Function of Bicellular Tight Junctions in Skin and Oral Wound Healing.Int J Mol Sci. 2020 Apr 23;21(8):2966. doi: 10.3390/ijms21082966. Int J Mol Sci. 2020. PMID: 32340108 Free PMC article.
-
Reprogramming of epidermal keratinocytes by PITX1 transforms the cutaneous cellular landscape and promotes wound healing.JCI Insight. 2024 Dec 20;9(24):e182844. doi: 10.1172/jci.insight.182844. JCI Insight. 2024. PMID: 39480496 Free PMC article.
-
Cold shock induces the synthesis of stress proteins in human keratinocytes.J Invest Dermatol. 1993 Aug;101(2):196-9. doi: 10.1111/1523-1747.ep12363791. J Invest Dermatol. 1993. PMID: 8345221
-
Heat shock proteins in the physiology and pathophysiology of epidermal keratinocytes.Cell Stress Chaperones. 2019 Nov;24(6):1027-1044. doi: 10.1007/s12192-019-01044-5. Epub 2019 Nov 16. Cell Stress Chaperones. 2019. PMID: 31734893 Free PMC article. Review.
References
-
- Muñoz-Garcia A., Ro J., Brown J.C., Williams J.B. Cutaneous water loss and sphingolipids in the stratum corneum of house sparrows, Passer domesticus L. from desert and mesic environments as determined by reversed phase high-performance liquid chromatography coupled with atmospheric pressure photospray ionization mass spectrometry. Pt 3J. Exp. Biol. 2008;211:447–458. - PubMed
-
- Holland D.B., Roberts S.G., Wood E.J., Cunliffe W.J. Cold shock induces the synthesis of stress proteins in human keratinocytes. J. Investig. Dermatol. 1993;101:196–199. - PubMed
MeSH terms
Substances
Grants and funding
LinkOut - more resources
Full Text Sources

