

Elucidating Immune Cell Changes in Celiac Disease: Revealing New Insights from Spectral Flow Cytometry
- PMID: 40243487
- PMCID: PMC11988382
- DOI: 10.3390/ijms26072877
Elucidating Immune Cell Changes in Celiac Disease: Revealing New Insights from Spectral Flow Cytometry
Abstract
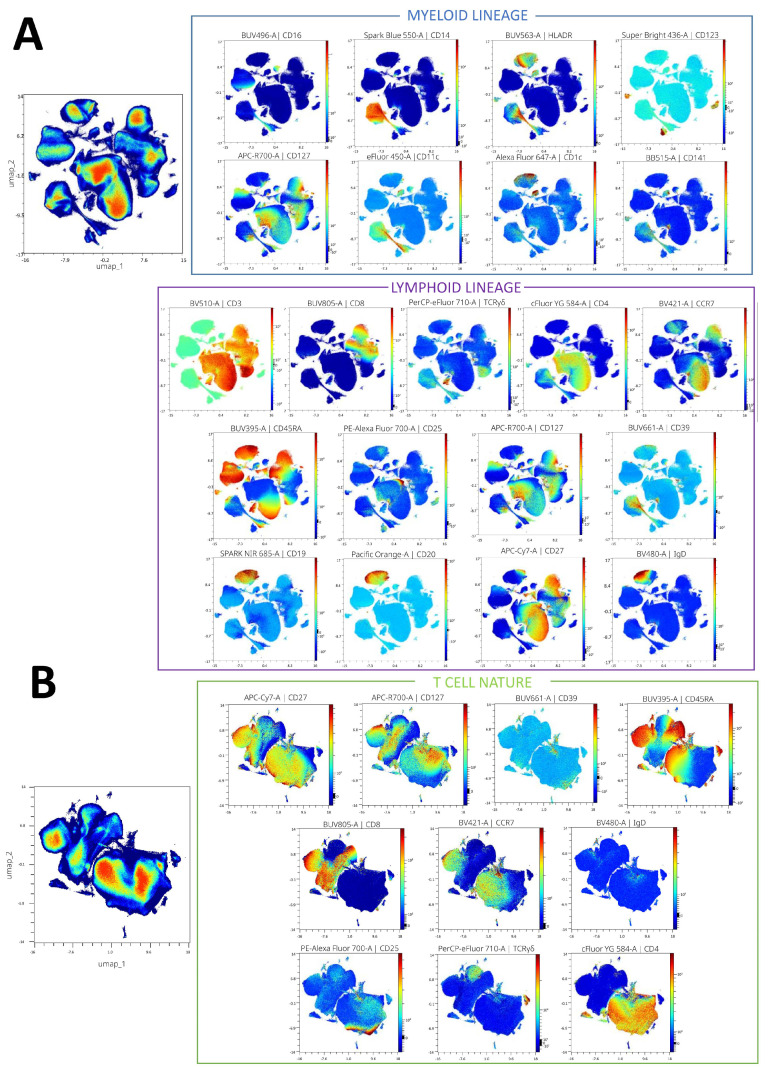
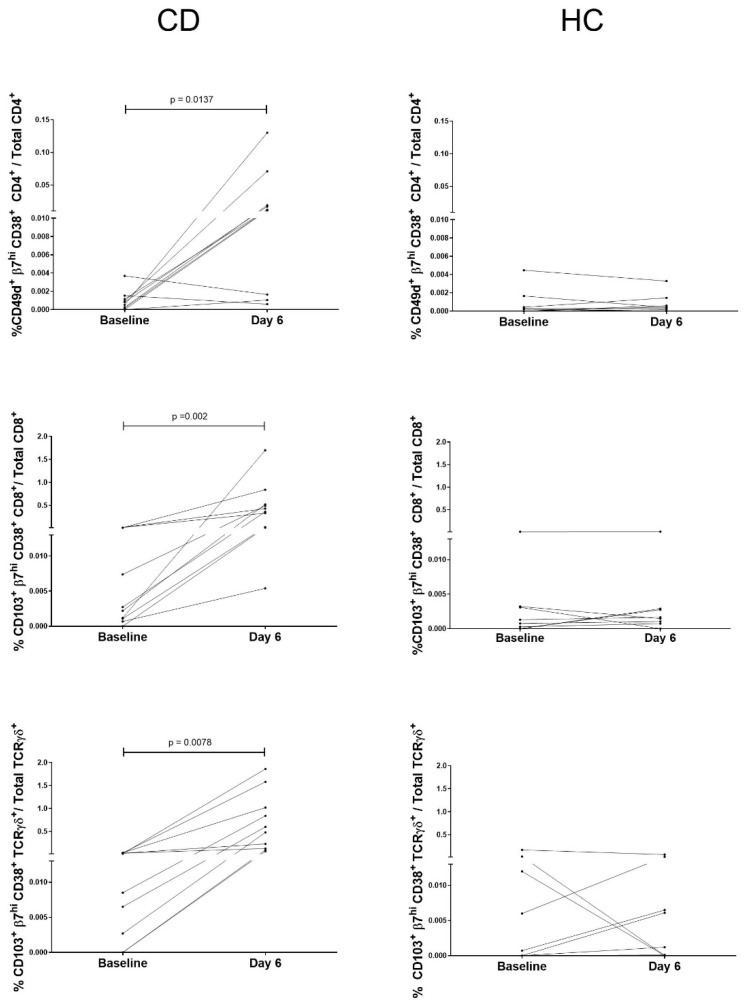
Celiac disease (CD) is an immune-mediated enteropathy of the small intestine triggered by gluten ingestion. Although the small bowel is the main organ affected, peripheral blood cell alterations have also been described in CD. We aimed to investigate immunological cell patterns in the blood of treated CD patients and in response to a 3-day gluten challenge (GC). Blood samples were collected from 10 patients with CD and 8 healthy controls on a gluten-free diet at baseline and 6 days after initiating the GC. All the samples were analyzed by spectral flow cytometry using a 34-marker panel. We found that patients with CD displayed a lower proportion of memory B cells compared to healthy controls, both at baseline and post-GC. Additionally, we observed the previously reported activated gut-homing CD4+, CD8+, and TCRγδ+ T lymphocytes on day 6 post-GC, and found the CD8+ subpopulation to be the most readily identifiable by flow cytometry. Importantly, the CCR9 marker proved effective in enhancing the selection of these gluten-responsive T cells, offering the potential for increased diagnostic accuracy. Spectral flow cytometry involves a complex data analysis, but it offers valuable insights into previously unexplored immunological responses and enables in-depth cell characterization.
Keywords: B cells; T cells; gluten challenge; gluten-free diet; spectral cytometry.
Conflict of interest statement
The authors declare no conflicts of interest.
Figures


Similar articles
-
Diagnosis of celiac disease on a gluten-free diet: a multicenter prospective quasi-experimental clinical study.BMC Med. 2025 Mar 26;23(1):182. doi: 10.1186/s12916-025-04008-y. BMC Med. 2025. PMID: 40140887 Free PMC article.
-
Activated gut-homing CD8+ T cells for coeliac disease diagnosis on a gluten-free diet.BMC Med. 2021 Oct 6;19(1):237. doi: 10.1186/s12916-021-02116-z. BMC Med. 2021. PMID: 34610833 Free PMC article.
-
γδ+ T-Cells Is a Useful Biomarker for the Differential Diagnosis between Celiac Disease and Non-Celiac Gluten Sensitivity in Patients under Gluten Free Diet.Nutrients. 2024 Jul 17;16(14):2294. doi: 10.3390/nu16142294. Nutrients. 2024. PMID: 39064736 Free PMC article.
-
Intestinal and blood lymphograms as new diagnostic tests for celiac disease.Front Immunol. 2023 Jan 10;13:1081955. doi: 10.3389/fimmu.2022.1081955. eCollection 2022. Front Immunol. 2023. PMID: 36713361 Free PMC article. Review.
-
Flow cytometry of intestinal intraepithelial lymphocytes in celiac disease.J Immunol Methods. 2011 Jan 5;363(2):177-86. doi: 10.1016/j.jim.2010.09.002. Epub 2010 Sep 15. J Immunol Methods. 2011. PMID: 20833175 Review.
Cited by
-
Reproductive Health and Assisted Conception in Celiac Disease and Non-Celiac Gluten Sensitivity: A Narrative Review.Nutrients. 2025 Jul 3;17(13):2215. doi: 10.3390/nu17132215. Nutrients. 2025. PMID: 40647319 Free PMC article. Review.
References
-
- Han A., Newell E.W., Glanville J., Fernandez-Becker N., Khosla C., Chien Y.-H., Davis M.M. Dietary gluten triggers concomitant activation of CD4+ and CD8+ αβ T cells and γδ T cells in celiac disease. Proc. Natl. Acad. Sci. USA. 2013;110:13073–13078. doi: 10.1073/pnas.1311861110. - DOI - PMC - PubMed
-
- López-Palacios N., Pascual V., Castaño M., Bodas A., Fernández-Prieto M., Espino-Paisán L., Martínez-Ojinaga E., Salazar I., Martínez-Curiel R., Rey E., et al. Evaluation of T cells in blood after a short gluten challenge for coeliac disease diagnosis. Dig. Liver Dis. 2018;50:1183–1188. doi: 10.1016/j.dld.2018.04.014. - DOI - PubMed
-
- Fernández-Bañares F., López-Palacios N., Corzo M., Arau B., Rubio M., Fernández-Prieto M., Tristán E., Pujals M., Farrais S., Horta S., et al. Activated gut-homing CD8+ T cells for coeliac disease diagnosis on a gluten-free diet. BMC Med. 2021;19:237–246. doi: 10.1186/s12916-021-02116-z. - DOI - PMC - PubMed
MeSH terms
Substances
Grants and funding
LinkOut - more resources
Full Text Sources
Medical
Research Materials
Miscellaneous
