. 2025 Mar 24;26(7):2921.
doi: 10.3390/ijms26072921.

Trabectedin Induces Synthetic Lethality via the p53-Dependent Apoptotic Pathway in Ovarian Cancer Cells Without BRCA Mutations When Used in Combination with Niraparib

Affiliations

Trabectedin Induces Synthetic Lethality via the p53-Dependent Apoptotic Pathway in Ovarian Cancer Cells Without BRCA Mutations When Used in Combination with Niraparib

Bongkyun Kang et al. Int J Mol Sci. .

Abstract

This study investigated whether combining niraparib and trabectedin in BRCA-proficient epithelial ovarian cancer induces deficiencies in ssDNA break repair and dsDNA homologous recombination, leading to synthetic lethality. A2780 and SKOV3 ovarian cancer cell lines were treated with niraparib and trabectedin. Cell viability was assessed using CCK-8 assays, while RT-qPCR and Western blot analyzed the expression of DNA repair and apoptosis-related genes. Apoptosis was evaluated via Annexin V/PI assays. The combination therapy exhibited a synergistic effect on A2780 cells but not on SKOV3 cells. Treatment reduced BRCA1, BRCA2, RAD51, PARP1, and PARP2 expression, indicating impaired DNA repair. γ-H2AX levels increased, suggesting DNA damage. The therapy also upregulated p53, PUMA, NOXA, BAX, BAK, and p21, promoting p53-mediated apoptosis and cell cycle arrest. Apoptosis induction was confirmed via Annexin V/PI assays. Silencing p53 with siRNA abolished all synergistic effects in A2780 cells. Niraparib and trabectedin combination therapy impairs DNA repair in BRCA-proficient ovarian cancer, leading to synthetic lethality through p53-dependent apoptosis.

Keywords: homologous recombination deficiency; ovarian carcinoma; poly (ADP-ribose) polymerase inhibitor; synthetic lethality; trabectedin.


Conflict of interest statement

The authors declare no conflicts of interest.

Figures

Figure 1
Figure 1
Niraparib effectively inhibits the proliferation of A2780 and SKOV3 cells. Cell viability was assessed using the CCK-8 assay to determine the optimal dose and treatment time for niraparib (a PARP inhibitor). A2780 and SKOV3 cells were cultured and treated with varying concentrations of niraparib for 24, 48, and 72 h, followed by the CCK-8 assay. The normalized values of the control group were set as fold 1 (* p < 0.05, ** p < 0.01 vs. Control; group/n = 5). Data represent mean ± s.e.m. Statistical analysis was performed using a two-tailed t-test. The black dots represent the measurement values from three separate experiments.
Figure 2
Figure 2
Cell viability changes in A2780 and SKOV3 cells by trabectedin. A2780 and SKOV3 cells were cultured and treated with varying concentrations of trabectedin for 48 h, followed by CCK-8 assay. The normalized values of the control group were set as fold 1 (** p < 0.01 vs. Control; group/n = 5). Data represent mean ± s.e.m. Statistics by two-tailed t-test.
Figure 3
Figure 3
Cell viability decreased in A2780 cells by trabectedin and niraparib is dependent on p53. Cell viability of A2780 and SKOV3 cells was measured by CCK-8 assay after transfection with NC siRNA or p53 siRNA for 24 h, treatment with trabectedin, niraparib, or trabectedin + niraparib for 48 h. The normalized values of the control group were set as fold 1 (** p < 0.01 vs. each Control; group/n = 5). Data represent mean ± s.e.m. Statistics by two-tailed t-test.
Figure 4
Figure 4
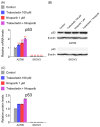
Trabectedin and niraparib increased p53 mRNA and protein levels in A2780 cells. (A) The expression levels of p53 in A2780 and SKOV3 cells were determined 48 h after treatment with trabectedin, niraparib, or a combination of trabectedin and niraparib using RT-qPCR analysis. mRNA levels were normalized to β-actin, with the normalized values of the A2780 control group set as fold 1 (** p < 0.01 vs. Control; group/n = 3). Data represent mean ± s.e.m., and statistical analysis was performed using a two-tailed t-test. (B) Cell lysates from A2780 and SKOV3 cells treated with trabectedin (100 pM), niraparib (1 μM), or a combination of trabectedin and niraparib (100 pM/1 μM) for 48 h were analyzed, with β-actin used as a loading control. (C) Quantification of each band was performed using ImageJ software version 1.54b.
Figure 5
Figure 5
Trabectedin and niraparib lead to an increase in both mRNA and protein levels of genes associated with the p53-mediated apoptosis pathway. (A) The expression levels of genes related to the p53-mediated apoptosis pathway in A2780 and SKOV3 cells were measured by RT-qPCR after treatment with NC siRNA or p53 siRNA for 24 h, followed by treatment with trabectedin, niraparib, or trabectedin + niraparib for 48 h. mRNA levels are relative to β-actin. The normalized values of the A2780 NC siRNA control group were set as fold 1 (* p < 0.05, ** p < 0.01 vs. Control; group/n = 3). Data represent mean ± s.e.m. Statistics by two-tailed t-test. (B) The lysates from A2780 and SKOV3 cells were transfected with either NC siRNA or p53 siRNA for 24 h, and then treated with trabectedin, niraparib, or trabectedin + niraparib for 48 h. β-actin was used as a loading control. (C) Each band was quantified using ImageJ software.
Figure 5
Figure 5
Trabectedin and niraparib lead to an increase in both mRNA and protein levels of genes associated with the p53-mediated apoptosis pathway. (A) The expression levels of genes related to the p53-mediated apoptosis pathway in A2780 and SKOV3 cells were measured by RT-qPCR after treatment with NC siRNA or p53 siRNA for 24 h, followed by treatment with trabectedin, niraparib, or trabectedin + niraparib for 48 h. mRNA levels are relative to β-actin. The normalized values of the A2780 NC siRNA control group were set as fold 1 (* p < 0.05, ** p < 0.01 vs. Control; group/n = 3). Data represent mean ± s.e.m. Statistics by two-tailed t-test. (B) The lysates from A2780 and SKOV3 cells were transfected with either NC siRNA or p53 siRNA for 24 h, and then treated with trabectedin, niraparib, or trabectedin + niraparib for 48 h. β-actin was used as a loading control. (C) Each band was quantified using ImageJ software.
Figure 6
Figure 6
Trabectedin and niraparib reduce the mRNA and protein levels of SSB repair-related genes in A2780 cells. (A) The expression levels of PARP1 and PARP2 in A2780 and SKOV3 cells were measured by RT-qPCR analysis after treatment with either NC siRNA or p53 siRNA for 24 h, followed by treatment with trabectedin, niraparib, or a combination of trabectedin and niraparib for 48 h. mRNA levels were normalized to β-actin, with the normalized values of the A2780 NC siRNA control group set as fold 1 (* p < 0.05, ** p < 0.01 vs. Control; group/n = 3). Data represent mean ± s.e.m., and statistical analysis was performed using a two-tailed t-test. (B) Cell lysates from A2780 and SKOV3 cells were transfected with either NC siRNA or p53 siRNA for 24 h, followed by treatment with trabectedin, niraparib, or a combination of trabectedin and niraparib for 48 h. (C) Quantification of each band was performed using ImageJ software.
Figure 7
Figure 7
Trabectedin and niraparib reduce the mRNA and protein levels of DSB repair-related genes in A2780 cells, and their combination increases DNA damage. (A) The expression levels of genes related to double-strand break (DSB) repair in A2780 and SKOV3 cells were assessed by RT-qPCR analysis after treatment with either NC siRNA or p53 siRNA for 24 h, followed by treatment with trabectedin, niraparib, or a combination of trabectedin and niraparib for 48 h. mRNA levels were normalized to β-actin, with the normalized values of the A2780 NC siRNA control group set as fold 1 (* p < 0.05, ** p < 0.01 vs. Control; group/n = 3). Data represent mean ± s.e.m., and statistical analysis was performed using a two-tailed t-test. (B) Cell lysates from A2780 and SKOV3 cells were transfected with either NC siRNA or p53 siRNA for 24 h, followed by treatment with trabectedin, niraparib, or a combination of trabectedin and niraparib for 48 h. (C) Quantification of each band was performed using ImageJ software.
Figure 7
Figure 7
Trabectedin and niraparib reduce the mRNA and protein levels of DSB repair-related genes in A2780 cells, and their combination increases DNA damage. (A) The expression levels of genes related to double-strand break (DSB) repair in A2780 and SKOV3 cells were assessed by RT-qPCR analysis after treatment with either NC siRNA or p53 siRNA for 24 h, followed by treatment with trabectedin, niraparib, or a combination of trabectedin and niraparib for 48 h. mRNA levels were normalized to β-actin, with the normalized values of the A2780 NC siRNA control group set as fold 1 (* p < 0.05, ** p < 0.01 vs. Control; group/n = 3). Data represent mean ± s.e.m., and statistical analysis was performed using a two-tailed t-test. (B) Cell lysates from A2780 and SKOV3 cells were transfected with either NC siRNA or p53 siRNA for 24 h, followed by treatment with trabectedin, niraparib, or a combination of trabectedin and niraparib for 48 h. (C) Quantification of each band was performed using ImageJ software.
Figure 8
Figure 8
Identification of apoptosis through FCM assay using Annexin V/PI double staining. FCM assay is represented by dot plot diagrams that demonstrate the typical apoptotic cell population with Annexin V-FITC and PI staining. The upper left quadrants (Q1) of the panels show necrotic cells, which were negative for Annexin V and positive for PI; the upper right quadrants (Q2) represent late apoptotic cells, which were positive for both Annexin V and PI; the lower left quadrants (Q3) represent the intact viable cells, which were negative for both Annexin V and PI; the lower right quadrants (Q4) represent early apoptotic cells, which were positive for Annexin V and negative for PI.

Similar articles

References

    1. Sung H., Ferlay J., Siegel R.L., Laversanne M., Soerjomataram I., Jemal A., Bray F. Global Cancer Statistics 2020: GLOBOCAN Estimates of Incidence and Mortality Worldwide for 36 Cancers in 185 Countries. CA Cancer J. Clin. 2021;71:209–249. doi: 10.3322/caac.21660. - DOI - PubMed
    1. Siegel R.L., Miller K.D., Jemal A. Cancer statistics, 2019. CA Cancer J. Clin. 2019;69:7–34. doi: 10.3322/caac.21551. - DOI - PubMed
    1. Kaelin W.G., Jr. The concept of synthetic lethality in the context of anticancer therapy. Nat. Rev. Cancer. 2005;5:689–698. doi: 10.1038/nrc1691. - DOI - PubMed
    1. DiSilvestro P., Banerjee S., Colombo N., Scambia G., Kim B.G., Oaknin A., Friedlander M., Lisyanskaya A., Floquet A., Leary A., et al. Overall Survival with Maintenance Olaparib at a 7-Year Follow-Up in Patients with Newly Diagnosed Advanced Ovarian Cancer and a BRCA Mutation: The SOLO1/GOG 3004 Trial. J. Clin. Oncol. 2023;41:609–617. doi: 10.1200/JCO.22.01549. - DOI - PMC - PubMed
    1. Poveda A., Floquet A., Ledermann J.A., Asher R., Penson R.T., Oza A.M., Korach J., Huzarski T., Pignata S., Friedlander M., et al. Olaparib tablets as maintenance therapy in patients with platinum-sensitive relapsed ovarian cancer and a BRCA1/2 mutation (SOLO2/ENGOT-Ov21): A final analysis of a double-blind, randomised, placebo-controlled, phase 3 trial. Lancet Oncol. 2021;22:620–631. doi: 10.1016/S1470-2045(21)00073-5. - DOI - PubMed

MeSH terms