

Chlorine Modulates Photosynthetic Efficiency, Chlorophyll Fluorescence in Tomato Leaves, and Carbohydrate Allocation in Developing Fruits
- PMID: 40243522
- PMCID: PMC11988456
- DOI: 10.3390/ijms26072922
Chlorine Modulates Photosynthetic Efficiency, Chlorophyll Fluorescence in Tomato Leaves, and Carbohydrate Allocation in Developing Fruits
Abstract
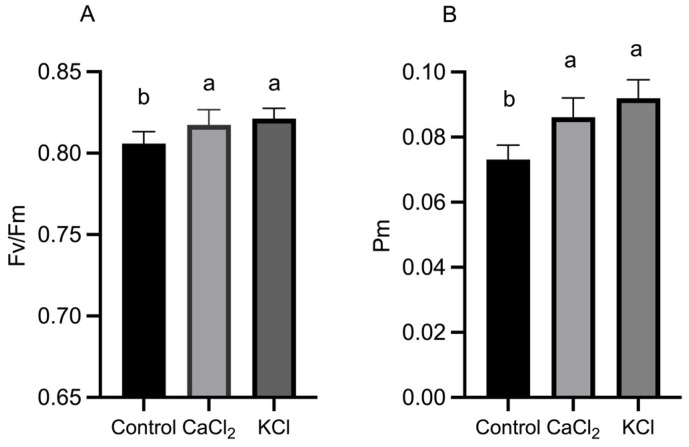
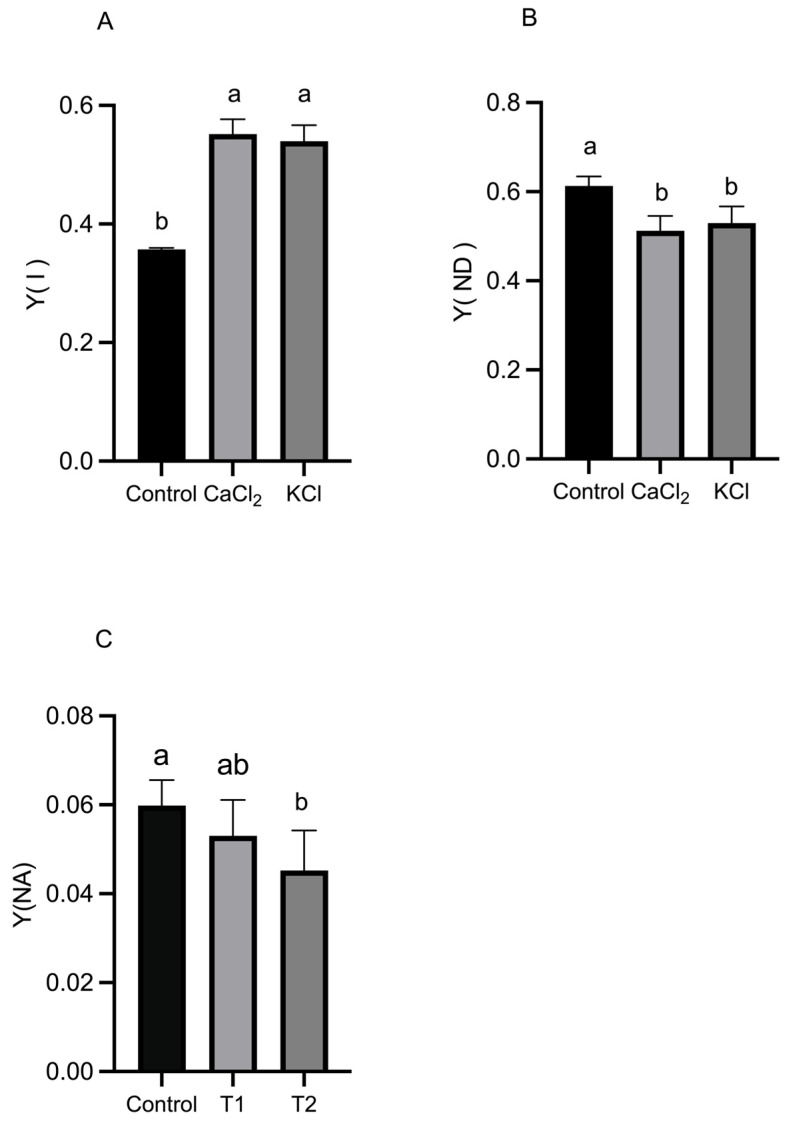
Chlorine (Cl) is an essential nutrient for higher plants, playing a critical role in their growth and development. However, excessive Cl application can be detrimental, leading to its limited use in controlled-environment agriculture. Recently, Cl has been recognized as a beneficial macronutrient, yet studies investigating its impact on plant growth and fruit quality remain scarce. In this study, we determined the optimal Cl concentration in nutrient solutions through a series of cultivation experiments. A comparative analysis of Cl treatments at 1, 2, and 3 mM revealed that 3 mM Cl- significantly enhanced chlorophyll content, biomass accumulation, and yield. Furthermore, we examined the effects of 3 mM Cl- (supplied as 1.5 mM CaCl2 and 3 mM KCl) on leaf photosynthesis, chlorophyll fluorescence, and fruit sugar metabolism. The results demonstrated that Cl- treatments enhanced the activity of Photosystem I (PS I) and Photosystem II (PS II), leading to a 25.53% and 28.37% increase in the net photosynthetic rate, respectively. Additionally, Cl- application resulted in a 12.3% to 16.5% increase in soluble sugar content in mature tomato fruits. During fruit development, Cl- treatments promoted the accumulation of glucose, fructose, and sucrose, thereby enhancing fruit sweetness and overall quality. The observed increase in glucose and fructose levels was attributed to the stimulation of invertase activity. Specifically, acidic invertase (AI) activity increased by 61.6% and 62.6% at the green ripening stage, while neutral invertase (NI) activity was elevated by 56.2% and 32.8% in the CaCl2 and KCl treatments, respectively, at fruit maturity. Furthermore, sucrose synthase (SS-I) activity was significantly upregulated by 1.5- and 1.4-fold at fruit maturity, while sucrose phosphate synthase (SPS) activity increased by 76.4% to 77.8% during the green ripening stage. These findings provide novel insights into the role of Cl- in tomato growth and metabolism, offering potential strategies for optimizing fertilization practices in protected horticulture.
Keywords: chlorine; photosynthesis; quality; sucrose metabolism; yield.
Conflict of interest statement
The authors declare no conflicts of interest.
Figures


Similar articles
-
Chloride modulates carbohydrate metabolism and ethylene synthesis in tomato fruits.Plant J. 2025 May;122(4):e70132. doi: 10.1111/tpj.70132. Plant J. 2025. PMID: 40411284
-
Comprehensive analysis of the effects on photosynthesis and energy balance in tomato leaves under magnesium deficiency.Plant Physiol Biochem. 2025 May;222:109671. doi: 10.1016/j.plaphy.2025.109671. Epub 2025 Feb 18. Plant Physiol Biochem. 2025. PMID: 40043460
-
Long-term effects of silver nanoparticles and mineral nutrition components on the photosynthetic processes, chloroplast ultrastructure and productivity of Solanum lycopersicum plants.J Photochem Photobiol B. 2024 Nov;260:113038. doi: 10.1016/j.jphotobiol.2024.113038. Epub 2024 Sep 27. J Photochem Photobiol B. 2024. PMID: 39366295
-
Effects of exogenous melatonin on the growth and photosynthetic characteristics of tomato seedlings under saline-alkali stress.Sci Rep. 2025 Feb 12;15(1):5172. doi: 10.1038/s41598-025-88565-5. Sci Rep. 2025. PMID: 39939713 Free PMC article.
-
Chlorophyll breakdown and chlorophyll catabolites in leaves and fruit.Photochem Photobiol Sci. 2008 Oct;7(10):1114-20. doi: 10.1039/b802356p. Epub 2008 Jun 3. Photochem Photobiol Sci. 2008. PMID: 18846275 Free PMC article. Review.
References
-
- Xu G., Magen H., Tarhitzkya J. Advances in chloride nutrition of plants. Adv. Agron. 2000;68:97–110. doi: 10.1016/S0065-2113(08)60844-5. - DOI
-
- Broadley M., Brown P., Cakmak I., Rengel Z., Zhao F. Marschner’s Mineral Nutrition of Higher Plants. Elsevier; Amsterdam, The Netherlands: 2012. Function of Nutrients; pp. 191–248.
MeSH terms
Substances
Grants and funding
LinkOut - more resources
Full Text Sources
